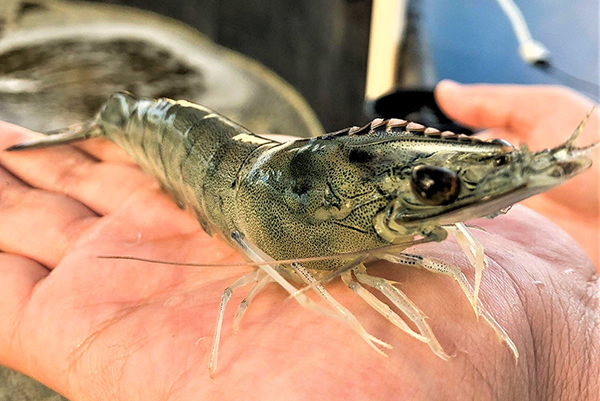
Factors impacting the nutritive value of biofloc for Pacific white shrimp juveniles
Biofloc nutritive value is influenced by dietary protein and carbon sources sugarcane bagasse and wheat flour
Several studies have evaluated the impact of using various carbon sources, concentrations and ingestion on water quality, growth performance and feed utilization by shrimp in biofloc technology (BFT)-based production systems. Many carbon sources have been extensively investigated as sources for BFT production – including starch, glucose, sugarcane bagasse, sugarcane molasses, rice bran, rice flour, wheat bran, wheat flour, cassava flour, gram flour and corn flour – as well as agriculture byproducts.
Although not all carbon sources support the production of BFT with the same efficiency, some carbon sources are considered more promising substrates for BFT production due to their ability to support rapid ammonia elimination and a higher production of BFT volume. In BFT systems, some carbon sources have produced significantly improved growth, feed utilization, water quality control and enhanced total heterotrophic bacteria (THB).
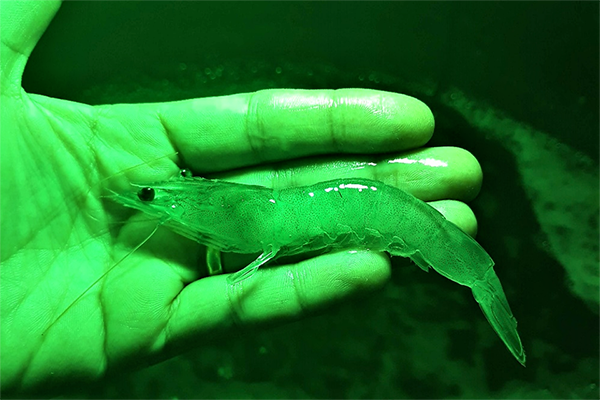
The production of Pacific white shrimp (Litopenaeus vannamei) in BFT-based intensive systems with zero-water exchange has become popular and has grown significantly over the last decade. Several researchers have calculated the various ideal dietary protein requirements for L. vannamei under various farming conditions, with reported values ranging from 32 to 40 percent. BFT consumption can improve feed utilization efficiency by recovering a portion of non-consumed or excreted nutrients, and by improving nitrogen retention in shrimp by 7 to 13 percent.
This article – adapted and summarized from the original publication [Mansour, A.T. et al. 2022. The Optimization of Dietary Protein Level and Carbon Sources on Biofloc Nutritive Values, Bacterial Abundance, and Growth Performances of Whiteleg Shrimp (Litopenaeus vannamei) Juveniles. Life 2022, 12(6), 888] – reports on a study to investigate the effect of dietary protein levels (250, 300, and 350 g protein/kg) and two different carbon sources, sugarcane bagasse (SB) and wheat flour (WF), to improve L. vannamei production, feed utilization and water quality.
![Ad for [BSP]](https://www.globalseafood.org/wp-content/uploads/2025/07/BSP_B2B_2025_1050x125.jpg)
Study setup
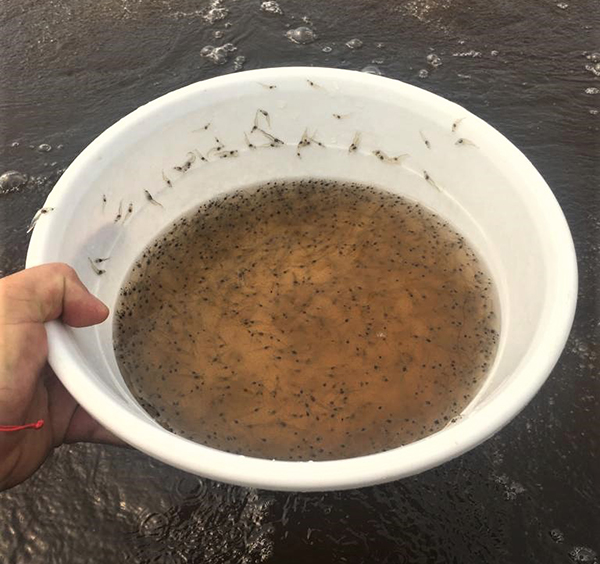
A 75-day feeding experiment was conducted at the National Institute of Oceanography and Fisheries (NIOF), Suez Branch, Egypt. L. vannamei juveniles (avg. initial weight 0.23 ± 0.04 grams) were obtained from a commercial shrimp hatchery in Damietta, Egypt. Animals were acclimatized in an indoor glass aquarium for 14 days before the feeding trial began to a water temperature of 29.1 ± 0.2 degrees-C, pH of 8 ± 0.01, and salinity of 20 ± 0.1 g/L. During this period, they were fed twice daily with a control diet containing 450 protein (C450).
The shrimp growth trial was then conducted in indoor, 80-liter glass aquaria to evaluate the effects of two different carbon sources (sugarcane bagasse, SB, and wheat flour, WF) on the biofloc composition, bacterial abundance, and growth of the L. vannamei juveniles. Three different levels of dietary protein content (250, 300 and 350 grams protein/kg diet) and two carbon sources (SB and WF) were applied in six dietary treatments (SB250, WF250, SB300, WF300, SB350 and WF350, respectively), comparing these to a controlled diet without biofloc and with 450 grams protein/kg (C450). The formulated experimental diets were isolipidic (≈ 87.7 g/kg) and isocaloric (gross energy ≈ 19.27 MJ/kg diet).
For detailed information on the experimental design and animal husbandry; diets, feeding and water quality; carbon sources and biofloc analysis; bacterial counts and shrimp performance; and statistical analyses, refer to the original publication.
Collaboration drives innovations in super-intensive indoor shrimp farming, part 2
Results and discussion
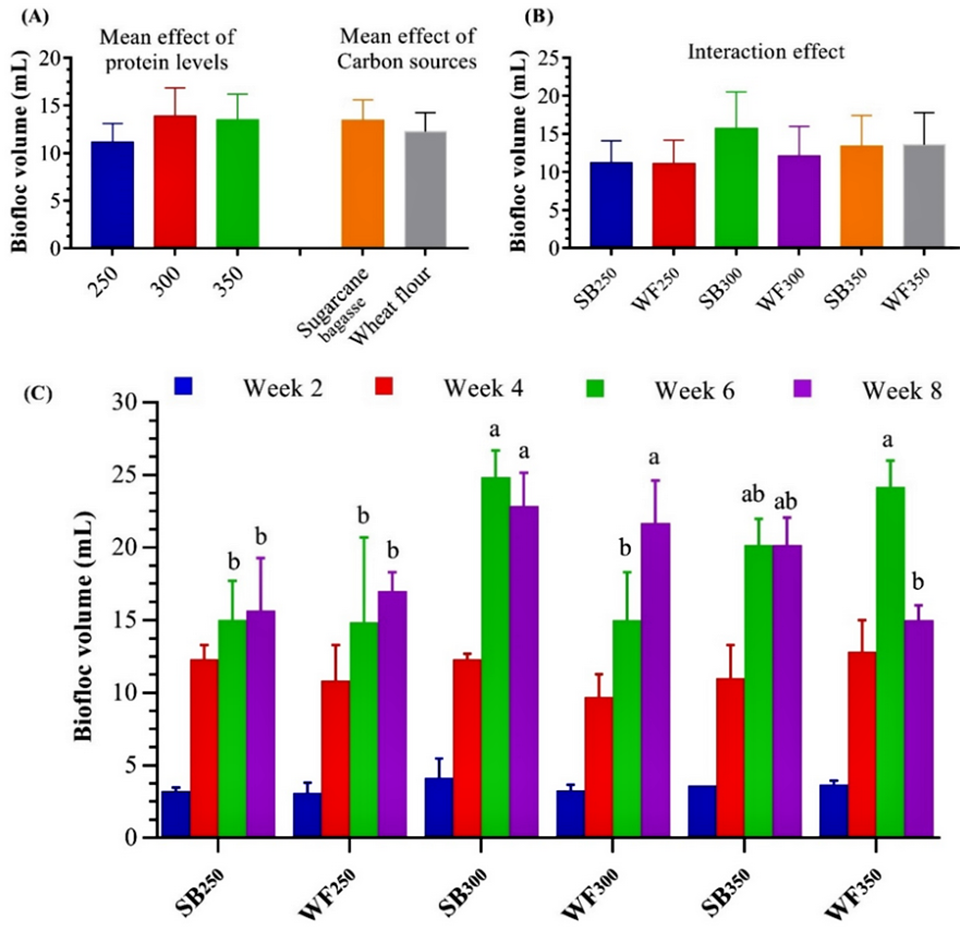
Our results showed that BFT levels and quality were enhanced through the appropriate addition of different carbon sources. The BFT volume and other water quality conditions were gradually improved and were maintained within optimum ranges. The formation and development of BFT in shrimp-rearing water depended on the assimilation of dissolved nitrogenous substances from uneaten feed and shrimp excretions by THB. The optimum C/N ratio (16:1) we used promoted the growth of THB in the water column and improved the BFT composition relative to the control diet.
Our data show that the higher THB load/count developed in the BFT treatments increased the growth of L. vannamei compared to the control treatment. This could be due to the assimilation by the shrimp of the formed BFT as additional supplemental food. In this regard, other researchers have suggested that the Lactobacillus bacterial strain abundant in BFT is a good feed additive to improve fish growth and enhance immune responses.
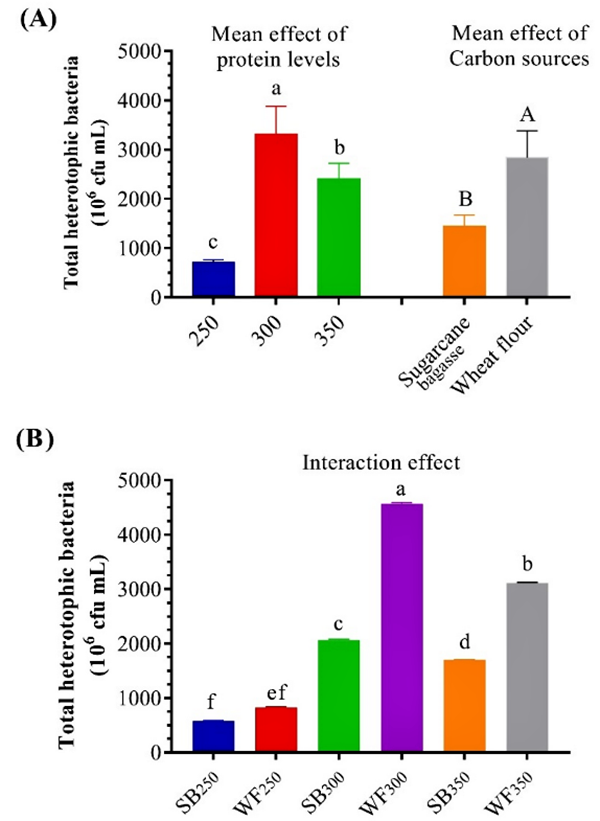
Our results demonstrate that the THB count increases gradually at the end of the experiment, which agrees with the results of other researchers that reported that the THB count increased in BFT treatments in the 10th and 12th weeks, suggesting that that THB might effectively assimilate the total ammonia nitrogen (TAN) to generate bacterial protein and new cells if an appropriate carbon source was used. Our additions of different carbon sources of SB and WF stimulated THB growth in the test system water.
The increase in THB likely improved water quality by immobilizing inorganic nitrogen, the most common waste material in aquaculture systems, and by converting it into microbial protein that could be used as additional nutrition and also improve the digestive enzyme activity of the experimental shrimp.
We observed that the BFT crude protein content was significantly higher in the SB300, WF300, SB350 and WF350 treatments, showing that BFT protein content increases with increasing dietary protein level.
However, reducing the dietary protein level from 350 to 250 grams of protein/kg did not affect the BFT protein composition. In a proximate analysis, the carbon source we used as well as levels of total suspended solids (TSS), salinity, stocking density, light intensity, phytoplankton, zooplankton, and bacterial populations all influenced the nutritional characteristics of BFT.
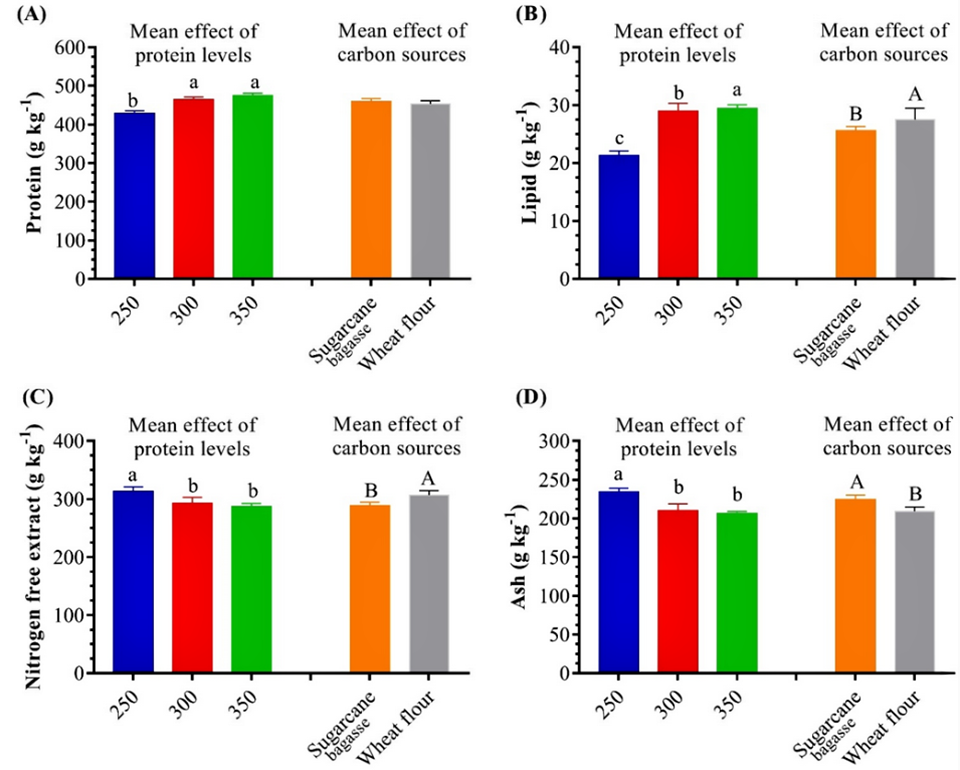
Our data also agrees with other researchers who reported that the protein, lipid and fiber contents of BFT produced in BFT with WF in L. vannamei tanks were significantly higher than those in the control. We noted high protein content in the BFT produced with wheat flour, followed by BFT with sugarcane molasses. BFT with more than 25 percent crude protein, 4 percent fiber and 7 percent ash can be regarded as acceptable for aquatic animal nutrition, particularly for herbivorous/omnivorous fish and shrimp species.
Generally, the protein level in the shrimp diet is the most influential factor in shrimp culture. In our study, the shrimp fed on SB350 and WF350 grams of protein/kg had better growth performance, compared to the shrimp fed on C450. This means that shrimp fed lower levels of protein with BFT could compensate for the higher protein diet (control diet).
The addition of the appropriate amount of carbon promoted L. vannamei growth and survival in our study. This could be due to the combined impact of better water quality and higher bacterial and zooplankton concentrations. Several studies have indicated that carbon-source additions are related to the formation and accumulation of biofloc, providing an essential food source and promoting shrimp growth, and shelter for zooplankton, an additional food source for L. vannamei.
We observed improved values of protein efficiency (PE) in the BFT treatments. Protein efficiency ratio (PER) values were highly significant in SB250 and WF250 than in the other treatments. When there is a high abundance of BFT in the culture system, feeding shrimp a high-protein diet may be unnecessary and uneconomical.
In other words, a low level of dietary protein might be compensated for by consuming BFT, allowing for the dietary protein content to be reduced. The BFT influence on protein feeding could have contributed to the adequate development of shrimp in the BFT treatments. Various other studies have reported that juveniles of L. vannamei and black tiger shrimp (Penaeus monodon) had higher growth rates in BFT-based systems than when reared in clear water systems.
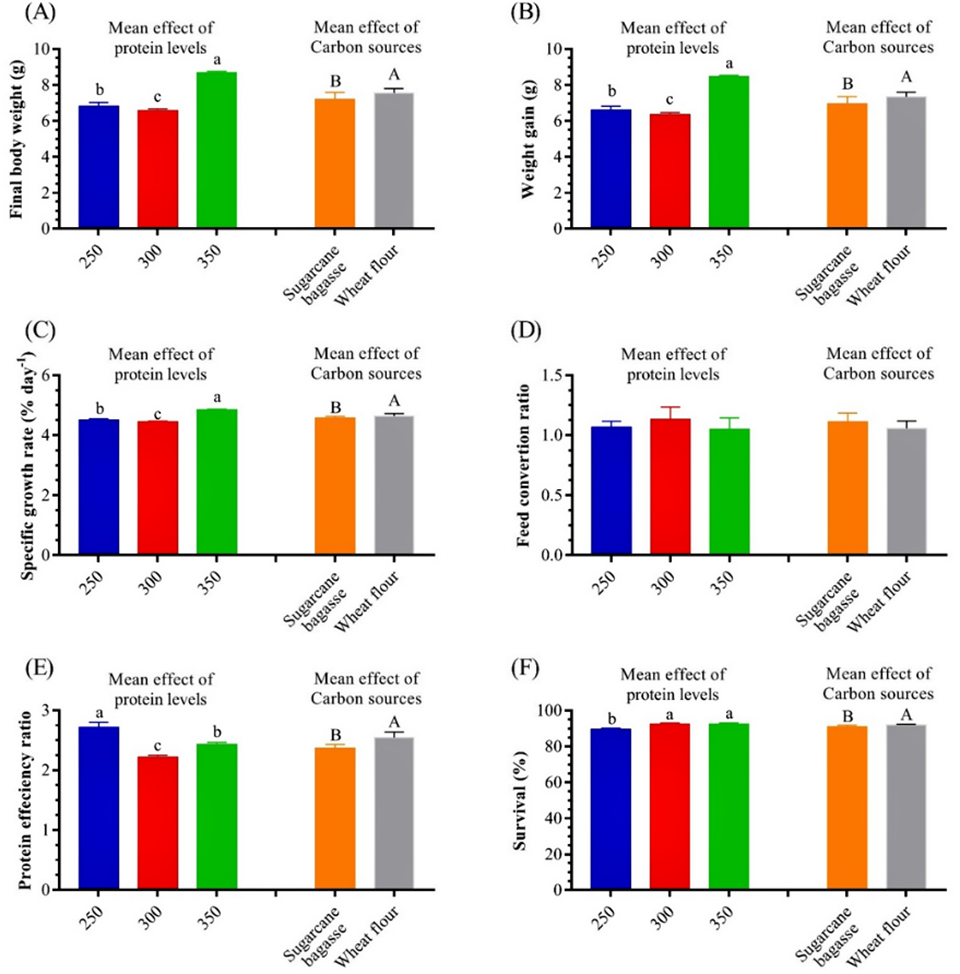
The final weight, weight gain and specific growth rates of L. vannamei in our BFT treatments fed diets containing 250, 300 and 400 grams of protein/kg were markedly higher than those obtained in the control groups that were fed diets containing 450 grams of protein/kg, suggesting that rearing shrimp in BFT systems could compensate for the reduction in dietary protein. The reduction in dietary protein levels without affecting shrimp growth has been reported by several authors where microbial proteins could provide an alternative source of protein for shrimp in BFT systems.
Perspectives
Our results showed that different carbon sources and protein levels could effectively influence the nutritional value of biofloc. Our data suggested that, by rearing L. vannamei in a biofloc system, dietary protein levels may be reduced from 450 to 350 grams of protein/kg diet while improving the growth performance and feed utilization of the animals. The total heterotrophic bacterial count in WF300 and WF350 grams of protein/kg using wheat flour as a carbon source was significantly higher than in the other treatments. The 350 grams of protein/kg provided the best performance indices and economic performance in our study.
Now that you've reached the end of the article ...
… please consider supporting GSA’s mission to advance responsible seafood practices through education, advocacy and third-party assurances. The Advocate aims to document the evolution of responsible seafood practices and share the expansive knowledge of our vast network of contributors.
By becoming a Global Seafood Alliance member, you’re ensuring that all of the pre-competitive work we do through member benefits, resources and events can continue. Individual membership costs just $50 a year.
Not a GSA member? Join us.
Authors
-

Corresponding author
Al Bilad Bank Scholarly Chair for Food Security in Saudi Arabia, The Deanship of Scientific Research, The Vice Presidency for Graduate Studies and Scientific Research, King Faisal University, P.O. Box 420, Al-Ahsa 31982, Saudi Arabia; and
Department of Aquaculture and Animal Production, College of Agriculture and Food Sciences, King Faisal University, P.O. Box 420, Al-Ahsa 31982, Saudi Arabia -
Faculty of Agriculture, Suez Canal University, Ismailia 41522, Egypt
-
National Institute of Oceanography and Fisheries (NIOF), Cairo 11516, Egypt
-
Al Bilad Bank Scholarly Chair for Food Security in Saudi Arabia, The Deanship of Scientific Research, The Vice Presidency for Graduate Studies and Scientific Research, King Faisal University, P.O. Box 420, Al-Ahsa 31982, Saudi Arabia; and
Department of Aquaculture and Animal Production, College of Agriculture and Food Sciences, King Faisal University, P.O. Box 420, Al-Ahsa 31982, Saudi Arabia -
Al Bilad Bank Scholarly Chair for Food Security in Saudi Arabia, The Deanship of Scientific Research, The Vice Presidency for Graduate Studies and Scientific Research, King Faisal University, P.O. Box 420, Al-Ahsa 31982, Saudi Arabia; and
Department of Biochemistry, Faculty of Agriculture, Ain Shams University, Cairo 11566, Egypt -
National Institute of Oceanography and Fisheries (NIOF), Cairo 11516, Egypt
Related Posts
Aquafeeds
Biofloc consumption by Pacific white shrimp postlarvae
The stable isotopes technique with δ13C and δ15N can be used to determine the relevance of different food sources to shrimp feeding during the pre-nursery phase of Litopenaeus vannamei culture. During this trial, different types of commercial feed, microalgae, Artemia sp. nauplii and bioflocs were used as food sources.
Health & Welfare
Colored LED lights can influence shrimp growth, water quality in biofloc culture
Pacific white shrimp reared with green and red lights grew much larger but showed little differences for survival, feed conversion or productivity.
Health & Welfare
Mojave yucca extracts are a beneficial phytogenic aquafeed additive
Yucca extracts can enhance farmed fish and shrimp growth and immunity, prevent antioxidative stress and improve culture water quality.
Health & Welfare
Survival of Pacific white shrimp juveniles after exposure to critical oxygen levels in biofloc culture
A study in Brazil evaluated the survival of Pacific white shrimp juveniles after exposure to critical oxygen levels in biofloc culture conditions.