Spatial distribution of global mariculture production
Study is the first to use a reproducible, globally consistent methodology mapping mariculture locations
Emerging opportunities to increase mariculture production and increasing recognition of the potentially lower environmental impacts of mariculture compared with land-based animal products suggest that mariculture holds significant promise for providing sustainable and nutritious food sources to help meet growing protein demand.
However, to realize this potential, policymakers, investors and regulators need accurate and reliable information on the location of mariculture and the amount and type of species being produced. Without this information, it is impossible to understand the impacts of mariculture on the environment (e.g., water pollution, land-use change, disease outbreaks, escapes) and people (e.g., nutrition, economics, competition with other sectors and resources) or to invest in and plan for the sustainable growth of the sector. Yet, unlike other major food production systems – like marine industrial fisheries, crops, and livestock – we do not have a detailed understanding of the spatial footprint of mariculture globally.
This is particularly critical given climate change, which has the potential to affect mariculture in many different ways, including the loss or reduction of suitable area due to sea level rise, more frequent extreme weather events, changing productivity, ocean acidification and increases in sea surface temperature. Without an understanding of the current distribution of mariculture, adapting and planning for future growth in a changing climate is impossible. Several approaches have been used to help fill this information gap, and while these efforts hold significant potential, they do not fully account for current reported production levels across multiple taxa.
This article – adapted and summarized from the original publication (Clawson, G. et al. 2022. Mapping the spatial distribution of global mariculture production. Aquaculture, Volume 553, 15 May 2022, 738066) – reports on a study with a novel approach to determining where mariculture occurs, combining previously disparate datasets to better estimate the number and location of mariculture farms for data-limited taxa and/or countries, which describes the majority (88 percent) of mariculture production.
![Ad for [membership]](https://www.globalseafood.org/wp-content/uploads/2025/07/membership_web2025_1050x125.gif)
Methodology
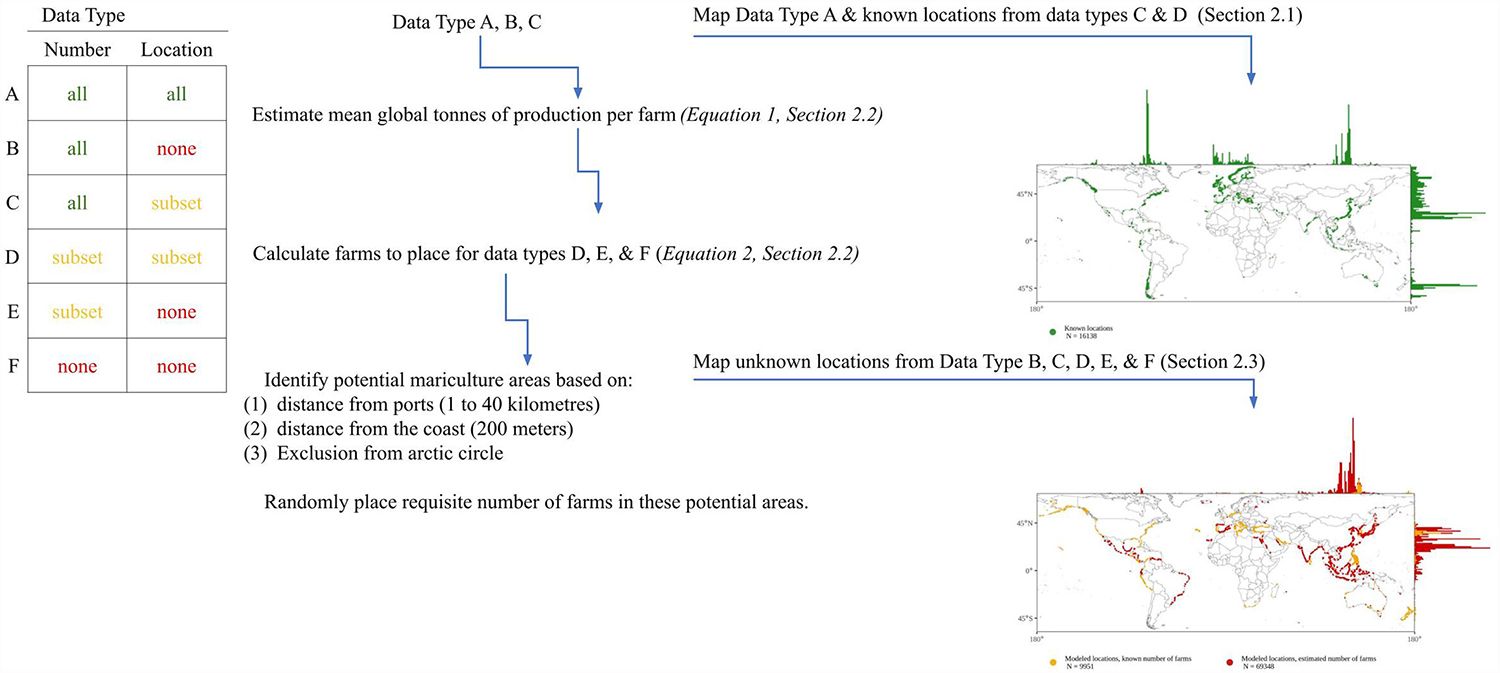
We categorized mariculture production into six broad categories (salmonidae fish, unfed or algae fed bivalve molluscs, shrimps and prawns, bluefin tuna, general marine fish and non-shrimp crustaceans), based on functional and taxonomic groupings consistent with existing literature and comprising 96 percent of global fish and invertebrate mariculture production for 2017. Our map does not include seaweed mariculture due to a lack of information on farming locations that would be needed to inform our modeling.
We included all countries (n = 73) that reported more than 500 tons of production of any single mariculture species in 2017 to the Food and Agriculture Organization of the United Nations, FAO. We excluded countries reporting those species with lower production levels because they tended to report highly variable production levels and produced a tiny fraction of global mariculture production in 2017 (<0.1 percent combined), implying established production systems for those species do not yet exist in these places.
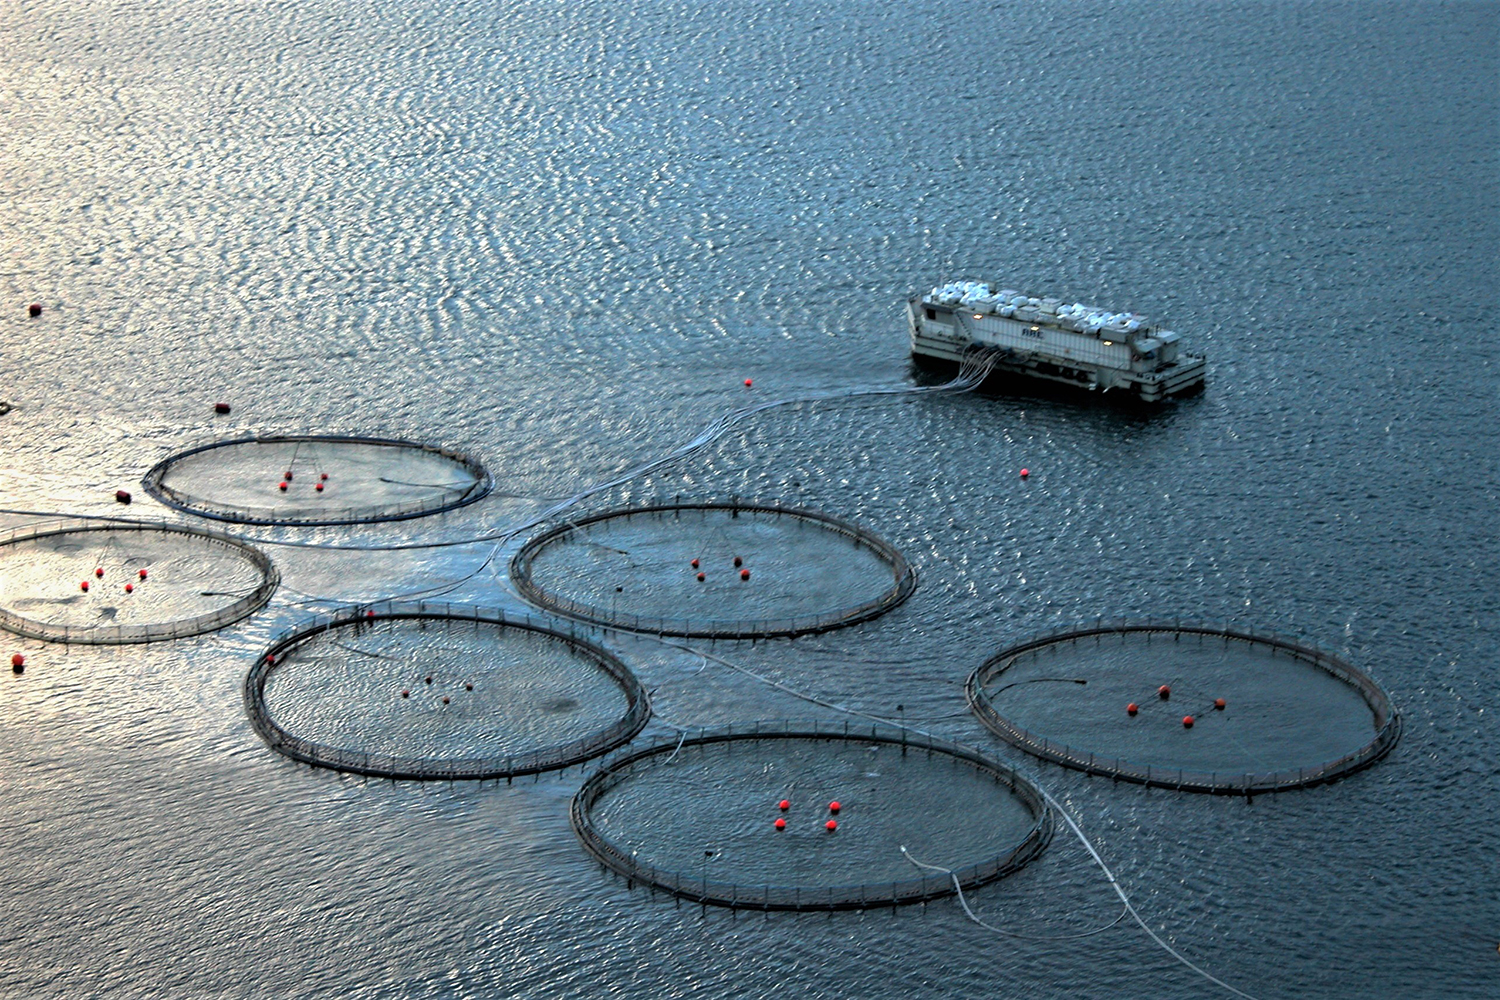
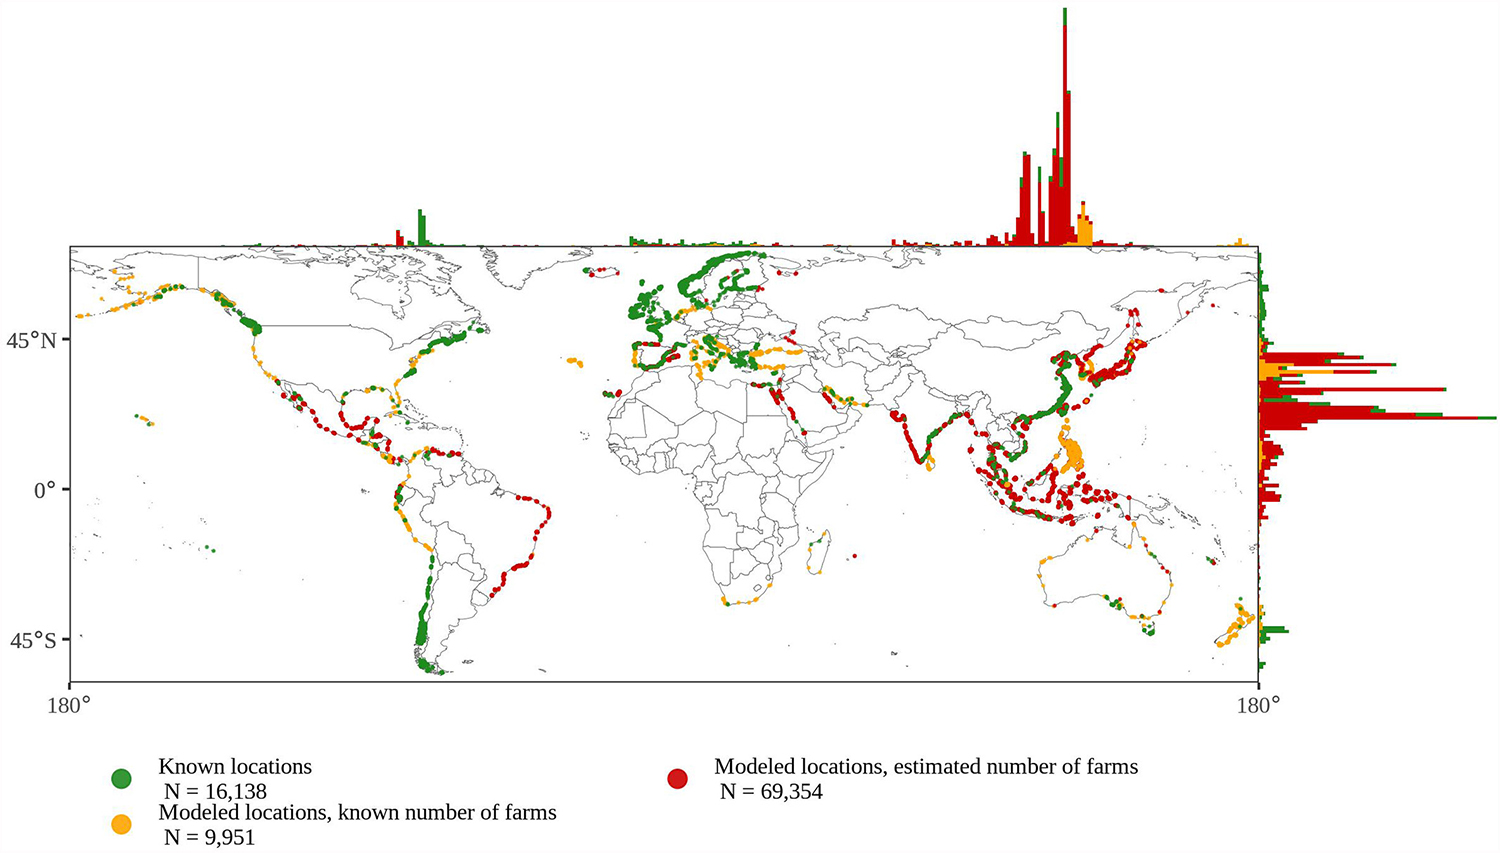
Combining available mariculture location information with reported marine and brackishwater aquaculture production by FAO, we estimated the number of mariculture farms within each reporting country, and spatially allocate those farms into suitable mariculture areas based on distance to shore and distance to port. This produced a database of known and estimated mariculture locations for six different major categories of taxa, providing the most comprehensive global information to date.
For detailed information on the information used to locate mariculture operations; estimation of farm numbers; mapping of suitable mariculture locations; and assessment of farm placement accuracy, refer to the original publication.
Results and discussion
In this study, we compiled known mariculture locations and applied a simple and repeatable production-allocation approach to map global mariculture based on distance to shore, distance to ports, and number of known farms. By combining previously disparate datasets, our map provides a novel and important new resource for aquaculture research, which can be used to assess potential impacts of mariculture on people and the environment, as well as understand trade-offs of future growth. We also provide an estimate of the number of farms at a national level, which can be refined at regional scales with improved data and/or locally developed models to more accurately map farm locations and production.
This global map provides two distinct benefits. First, it gives us a starting point for understanding the distribution of mariculture, which allows us to highlight major data gaps and spur future improved mapping efforts. Second, it allows for the mapping of environmental pressures and impacts to inform policy decisions and plan for climate change impacts.
We acknowledge that our dataset may exclude some available data that were not uncovered in our search. Several major producing countries, like China, have a massive amount of production with relatively little location data. By revealing this lack of explicit farm location data, our results highlight how countries’ abilities to evaluate the impacts of mariculture are hindered. However, even revealing these data gaps is an important contribution, highlighting where future efforts for mapping mariculture should be directed.
While a seemingly simple problem to fix, collecting and collating detailed location data on mariculture can be resource-intensive, data can quickly become obsolete as the sector rapidly evolves and relocates in response to environmental and societal pressures, and small-scale or traditional mariculture operations can be hard to identify and track.
However, many countries have the capacity to collect and maintain databases of commercial mariculture location information and can do more to report this data in a standardized and accessible format. Countries with permitting processes likely already collect these data, but in most cases do not make them readily available or report varying levels of metadata. For example, the United States reports the total number of farms within the country but lacks specific locations in many instances. This is likely due to confidentiality, especially for small-scale farmers, which is protected by law in some places.
‘Spatiotemporal patterns’ indicate improving perceptions of aquaculture
These data gaps prevent reliable comparisons with other food production types, in turn, limiting the development of environmentally and socially responsible food, agriculture and development policies, as well as assessments of the cumulative impacts of food. These shortfalls are particularly detrimental considering the rapid growth and increasing importance of mariculture, both economically and as a vital component of food production and security.
Another key limitation is the lack of data on particular taxa. For non-shrimp crustaceans we had to estimate farm-level productivity using shrimp and prawn data, because no comprehensive farm level production or location information exists. Nearly 64 percent of non-shrimp crustacean production included in this assessment is mud crab/swamp crab production, which have relatively lower stocking densities when compared to penaeid shrimp (which make up 100 percent of global shrimp and prawn production included), our approach therefore likely underestimates the number of farms for non-shrimp crustaceans.
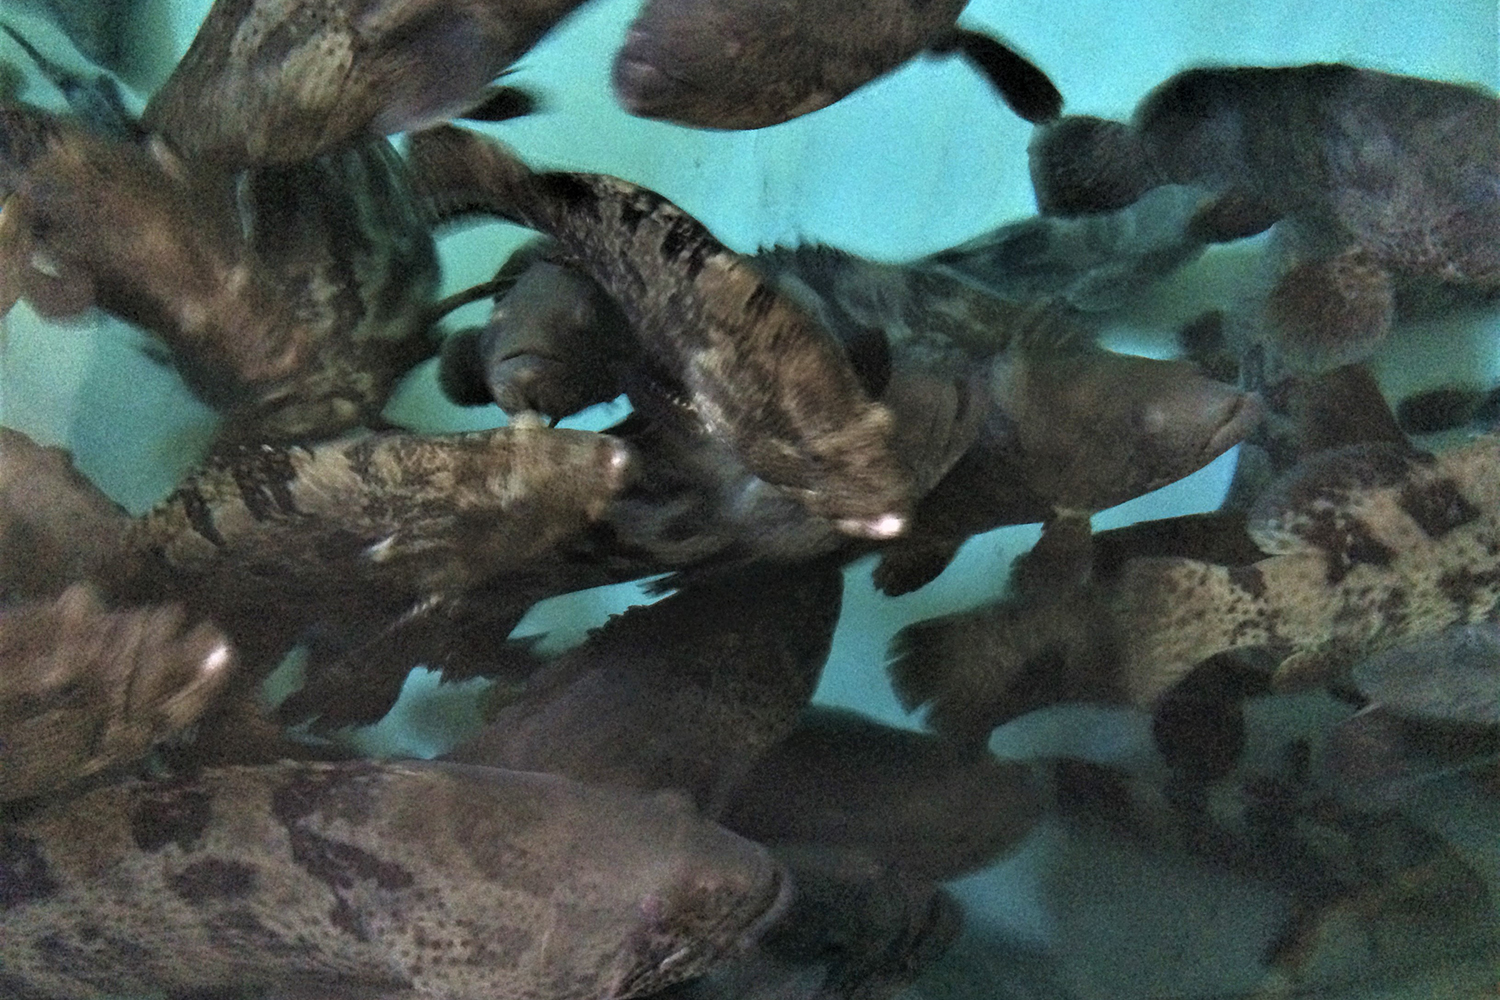
Additionally, our “general marine fish” species group is composed of 38 different species of fish (13 percent of global production). Because of the variability of species within the group, there is likely to be a wide range of error associated with the distribution of farms, and potential future understanding of the spatial footprint of these taxa.
To systematically and sustainably guide mariculture production, reduce competition with other human activities for land and water resources, and plan for the potential effects of climate change, fine-scale, spatially explicit production data is critical.
It is clear that greater availability of high-quality, standardized data will be essential for improving our understanding of the location of aquaculture farms, their intensity and efficiency of production, and the likely social, economic and environmental impacts of aquaculture farming. Given the wide distribution of different species farmed across the world, this would be a major undertaking. Prioritizing global assessments for specific species or production types is necessary, but very time and resource-intensive.
We applaud efforts by countries such as Norway, Canada, Chile and Ireland that have robust aquaculture licensing and reporting guidelines and that make data publicly accessible. Even where spatial data are available, important details for achieving a full picture of aquaculture production can be missing. For example, data rarely include details on the area farmed, species-specific production, culture type, or activeness of the farm, preventing a complete understanding of both the probable intensity of localized impacts and the distribution of production across producing regions. In addition, while identifying very data-poor countries is easy, even for better-reported countries, the completeness of their datasets is unclear, limiting our ability to build a robust picture of national or global mariculture.
Overcoming these limitations requires better data availability and reporting across countries, with a standardized, complete global spatial mariculture database being the gold standard to aspire to. We suggest that farms should report, at a minimum, information about what types of species are grown, production environment, farm size and stocking rates at each location at annual intervals. Whilst new remote sensing technologies could help determine aquaculture locations, these data will still need to be supplemented with farm level data to fully assess aquaculture production.
At the country or province/state level, policies requiring more precise and detailed mariculture data – as is the case for many commercial fisheries in nations like the United States – could help improve the quality of the information. Improved provincial production reporting will help to remedy the mismatches that often happen between what countries report to the FAO and what they publish in regional or national reports. Importantly, better data can also improve governance and sustainability of the sector itself by increasing the ability to accurately assess environmental and economic impacts, improve the predictability of farming practices over time, track the volatility of the system long-term, and support adaptive responses under the threat of increasing pressures to the system (e.g., climate change, COVID-19).
Major producers with the capacity to collect and provide data to international organizations, such as the FAO, should be incentivized to do so. For example, the USA has a paucity of spatial data on general finfish and shrimp aquaculture locations, while China, the world’s largest mariculture producer severely lacks spatial data across all species groups. The spatial data that does exist for China is derived from satellite data and neural network modeling, which is not ground-truthed and lacks specifics on species type. China has greatly improved the quality of statistical reporting in recent years; however, sights should now be set on spatially explicit information. Both countries have extensive agricultural data services and infrastructure, and the ability to mobilize vast resources to improve understanding of the aquaculture sector and how to improve its management.
Globally, the FAO is likely the best place to coordinate national efforts to ensure data reporting, collation, and comparability, based on its expertise in collating and reporting production and trade information that have greatly improved our understanding of food systems. Currently, efforts to do this exist within the FAO, but further resources are urgently needed to create a more comprehensive data set and to provide clearer guidelines for the minimum reporting standards.
Extending this level of support for the fastest growing food sector in the world, aquaculture, should, we believe, be a priority over the coming years. Elsewhere, funding bodies could prioritize the collection and collation of high-quality, spatially explicit data on aquaculture production systems, incorporating species, production type, yields and spatial extent where feasible. Examining how countries such as Norway achieve excellent data coverage, including farm-level information, could provide guidance as to how to improve matters elsewhere. We also renew calls to support the free and open sharing of such data through organizations such as the FAO, as well as national and subnational equivalents.
Perspectives
Mariculture is a prominent and rapidly growing sector that has the potential to supply relatively low-impact, high-quality nutrition to millions more people, but can also have lasting impacts on marine and coastal environments and socio-ecological systems. To systematically and sustainably guide mariculture production, reduce competition with other human activities for land and water resources, and plan for the potential effects of climate change, fine-scale, spatially explicit production data is critical.
Our generalized modeling approach provides a look at the global distribution of mariculture farms, something that has never been available before, and could be further improved through more sophisticated approaches based on farm-level attributes (e.g., production type, regional production statistics). Coordinated efforts should focus on filling key data gaps and providing support and guidance for creating a global, standardized mariculture location database to better inform policies and practices across scales.
Now that you've reached the end of the article ...
… please consider supporting GSA’s mission to advance responsible seafood practices through education, advocacy and third-party assurances. The Advocate aims to document the evolution of responsible seafood practices and share the expansive knowledge of our vast network of contributors.
By becoming a Global Seafood Alliance member, you’re ensuring that all of the pre-competitive work we do through member benefits, resources and events can continue. Individual membership costs just $50 a year.
Not a GSA member? Join us.
Author
-

Corresponding author
National Center for Ecological Analysis and Synthesis
University of California
Santa Barbara, CA 93101 USA
Editor’s note: The original article has 12 co-authors.
Related Posts
Responsibility
A global overview of restorative shellfish mariculture
A review of restorative shellfish mariculture case studies around the world to identify emergent patterns across species and ecoregions.
Responsibility
With entrenched aquaculture views, Alaska weighs its future in farming
The word aquaculture is a dirty one in Alaska, where finfish farming is firmly prohibited. But if your farm fits a certain description, permits to proceed can indeed be obtained.
Responsibility
Can sustainable mariculture match agriculture’s output?
Global, sustainable mariculture production, developed on a massive, sustainable scale and using just a small fraction of the world’s oceanic areas, could eventually match the output of land-based agriculture production. Scale and international law considerations require the involvement of many stakeholders, including national governments and international organizations.
Responsibility
Beefing up seaweed production to green up beef
Josh Goldman is on a mission to reproduce asparagopsis, a tropical seaweed that could have a significant impact on global greenhouse gas emissions.