Nitrogen, phosphorus, eutrophication and effluent standards for aquaculture certification
Developing meaningful standards for maximum acceptable concentration limits, load limits challenging
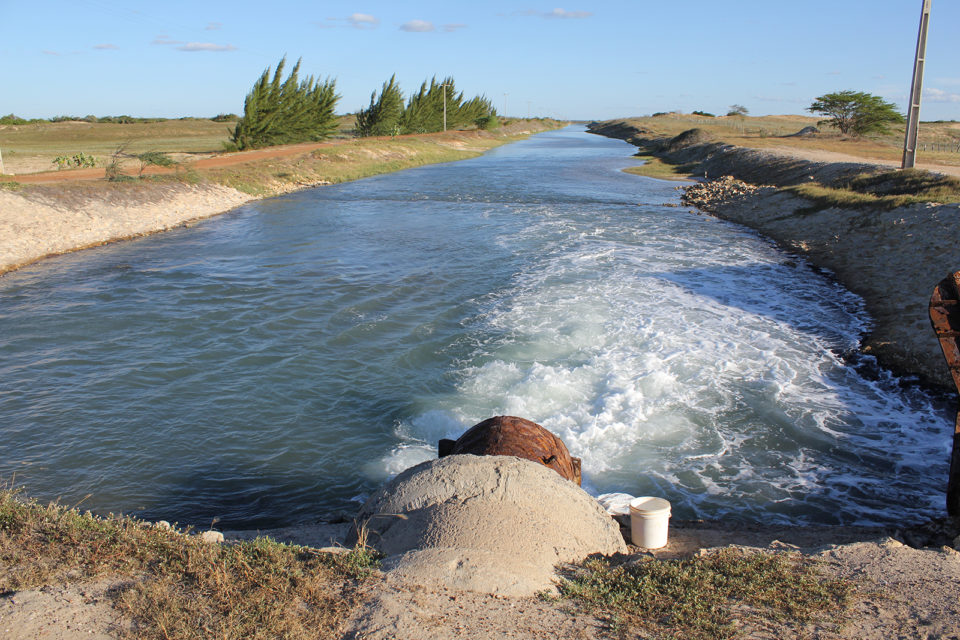
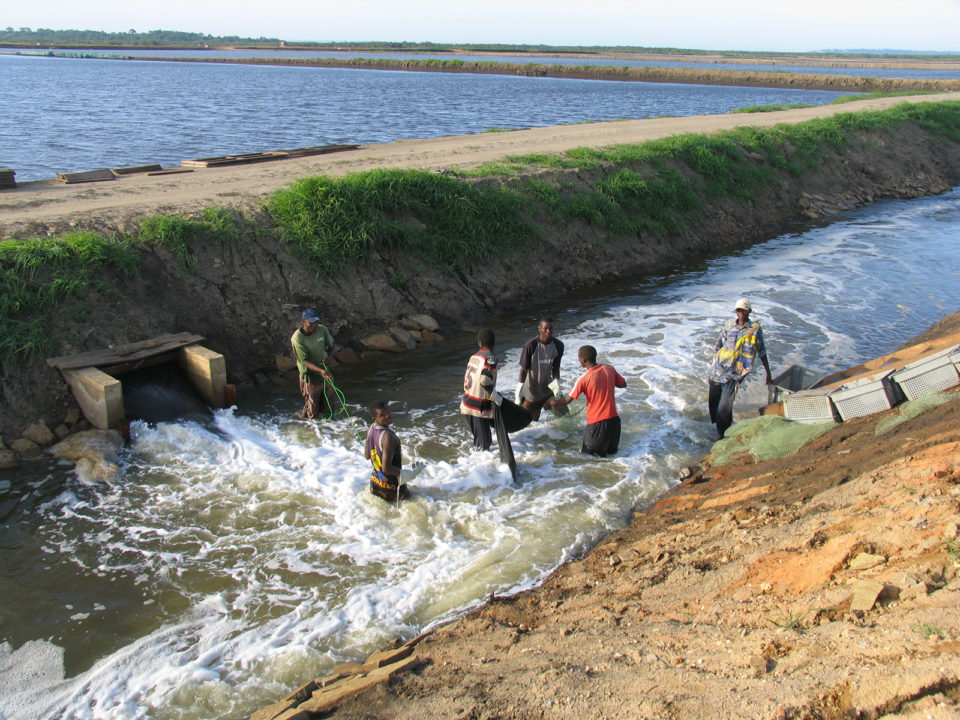
Aquaculture certification standards intend to avoid or at least minimize negative environmental impacts of aquaculture production. Effluents from aquaculture facilities typically are released into streams, lakes, estuaries or the sea. Standards are included in certification programs to protect against effluents causing negative impacts on the quality of receiving water bodies and aquatic life in them.
The main concern about aquaculture effluents is the possibility of them causing eutrophication of receiving water bodies. Eutrophication is defined in the Merriam-Webster Dictionary as “the process by which a body of water becomes enriched in dissolved nutrients (such as phosphates) that stimulate the growth of aquatic plant life usually resulting in the depletion of dissolved oxygen.” The online version of the dictionary further states that the word eutrophication is from the Greek “eutrophos” meaning well-nourished and further states that the term was first used in 1946. However, the concept of trophic states of water bodies and the word eutrophic have been used in ecology since the early 1900s.
Early on, ecologists classified lakes as oligotrophic if they were nutrient impoverished and low in productivity and as eutrophic if they were nutrient enriched and high in productivity. Lakes that fell between these two categories were considered mesotrophic. Those studying lakes also found that lakes accumulated sediment and nutrients as they aged to become more eutrophic. Lakes naturally progress from oligotrophic status to eutrophic status (undergo eutrophication). Some indicators of trophic status of lakes are provided in Table 1.
Boyd, eutrophication, Table 1
| Variable | Oligotrophic | Mesotrophic | Eutrophic |
|---|---|---|---|
| Total photophorus (ug/L) | |||
| Annual mean | 8.0 | 26.7 | 84.4 |
| Range | 30.0 – 17.7 | 10.9 – 95.6 | 16 – 386 |
| Total nitrogen (ug/L) | |||
| Annual mean | 661 | 753 | 1,875 |
| Range | 307 – 1,630 | 361 – 1,387 | 393 – 6,100 |
| Chlorophyll a (ug/L) | |||
| Annual mean | 1.7 | 4.7 | 14.3 |
| Annual maximum | 4.2 | 16.1 | 42.6 |
| Range | 0.3 – 4.5 | 3 – 11 | 3 – 78 |
| Secchi transparency depth (m) | |||
| Annual mean | 9.9 | 4.2 | 2.45 |
| Range | 5.4 – 28.3 | 1.5 – 8.1 | 0.8 – 7.0 |
Eutrophication, effluents
The concept of eutrophication has since been applied to water bodies in general, and two nutrients, nitrogen and phosphorus, are most likely to increase aquatic plant productivity and accelerate the rate of eutrophication in water bodies. As aquatic plant productivity increases, there is an increasing likelihood of low dissolved oxygen concentration during the night. Organic matter also accumulates in sediment, sediment oxygen demand increases, and anaerobic conditions may develop at the sediment-water interface. The overall effect of eutrophication is the disappearance of ecologically-sensitive species and the proliferation of a few of the less ecologically-sensitive species. The domination of phytoplankton blooms by a few species of blue-green algae (cyanobacteria) is a common phenomenon in eutrophic waters.
Nitrogen and phosphorus limits for effluents are included as standards in aquaculture certification programs in an attempt to avoid accelerated eutrophication of water bodies receiving these effluents. The development of meaningful standards for nitrogen and phosphorus is problematic, because the response of water bodies to nitrogen and phosphorus inputs vary depending upon many factors.
Most water bodies respond with greater productivity to increased inputs of either nitrogen, phosphorus or both, but productivity in some water bodies is limited by other factors. For example, in a water body that has high turbidity from suspended soil particles, turbidity reduces light penetration into the water preventing plants from increasing their growth rates in response to greater nitrogen and phosphorus inputs.
Nitrogen, phosphorus input variations
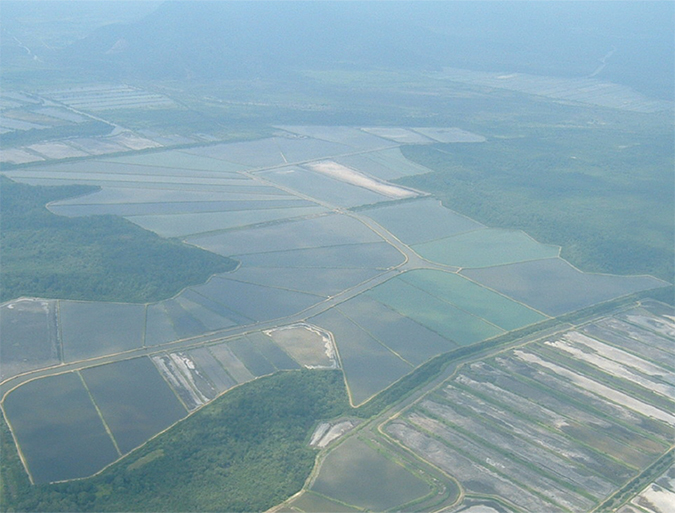
There is considerable variation in amounts of nitrogen and phosphorus that can be introduced into different water bodies without causing them to undergo accelerated eutrophication (greater aquatic plant productivity). The most important reasons for this variation are existing nitrogen and phosphorus concentrations, concentrations of other plant nutrients in the system (productivity in some water bodies might be limited by nutrients other than nitrogen and phosphorus), non-nutrient related factors such as light availability that may limit productivity, the volume of the receiving water body, the hydraulic retention time (flushing rate) of the water body, and the capacity of the water body to assimilate nitrogen and phosphorus. Furthermore, many water bodies receive nitrogen and phosphorus from sources other than aquaculture, and this further complicates the establishment of permissible inputs for an aquaculture facility.
Maximum, permissible concentration limits for nitrogen and phosphorus in the effluent are basically meaningless, because we do not know the nutrient concentration increase that will result in the receiving water body. Moreover, even if we could determine the resulting concentration, we would not know if it would cause greater aquatic plant productivity. The incipient concentrations of nitrogen and phosphorus necessary to cause phytoplankton blooms varies among water bodies as explained above.
The loads of amount of nitrogen and phosphorus entering a water body from a particular facility may be calculated from nitrogen and phosphorus concentrations in effluent and effluent volume. However, the assimilative capacity of the water body will seldom (if ever) be known, and inputs of nitrogen and phosphorus from other sources – also which will seldom be known – contribute to nitrogen and phosphorus loads.
Monitoring discharges
The solution to the dilemma of how much nitrogen and phosphorus can be discharged from an aquaculture facility without accelerating eutrophication might seem to be monitoring to detect if the trophic status of the receiving water body is increasing. Nevertheless, because of nitrogen and phosphorus inputs from other sources, monitoring would not necessarily indicate that aquaculture is the reason for a detected increase in trophic status.
There is no practical or meaningful way of developing nitrogen and phosphorus standards for aquaculture certification programs to assure eutrophication will not occur. The sole exception would be situations where there are no inputs of nitrogen and phosphorus to a water body other than from aquaculture. In such a case, monitoring could be a means of assessing changes in tropic status of the receiving water body.
The tipping point presents another complication in assessing eutrophication. Ecological systems are resilient, and they can adjust to maintain normal structure and function across a wide range of conditions. In the case of eutrophication, there are natural processes that allow systems to assimilate increasing inputs of nutrients with relatively little change in trophic state. However, if nutrient inputs continue, a threshold is eventually reached that causes the system to abruptly shift to a new state. It is very difficult to identify when the tipping point will occur. A water body may suddenly change from oligotrophic to mesotrophic or from mesotrophic to eutrophic.
Perspectives
The development of maximum acceptable concentration limits and load limits for nitrogen and phosphorus discharge from aquaculture facilities is fraught with difficulty. The questions of what concentrations and loads of nitrogen and phosphorus can be applied without causing eutrophication and the proportions of nitrogen and phosphorus loads in a water body that come from aquaculture are too complex to be answered in aquaculture certification programs.
Although monitoring may be required, it likely will not warn of an impending change in trophic status soon enough to avoid the event. It probably would be better in aquaculture certification to simply require facilities to limit inputs of nitrogen and phosphorus to the lowest loads feasible.
These limits could be based on an assessment of the amount of nitrogen and phosphorus released per metric ton of aquaculture product by facilities using good feeds and feeding practices, sufficient aeration, and good water quality management in production units. Nevertheless, putting limits on individual facilities will not prevent eutrophication if the amounts of nitrogen and phosphorus discharged from all sources combined exceed the capacity of the water body to resist eutrophication.
Now that you've reached the end of the article ...
… please consider supporting GSA’s mission to advance responsible seafood practices through education, advocacy and third-party assurances. The Advocate aims to document the evolution of responsible seafood practices and share the expansive knowledge of our vast network of contributors.
By becoming a Global Seafood Alliance member, you’re ensuring that all of the pre-competitive work we do through member benefits, resources and events can continue. Individual membership costs just $50 a year.
Not a GSA member? Join us.
Author
-

School of Fisheries, Aquaculture and Aquatic Sciences
Auburn University
Auburn, Alabama 36849 USA
Related Posts
Responsibility
Constantly changing pH unavoidable, completely normal
Prof. Claude Boyd discusses the importance of pH for farmed fish and shellfish, the normal and natural fluctuations and how aquaculture systems can manage it.
Responsibility
Reviewing the ‘near-magical’ properties of water
Understanding the hydrologic cycle, water’s unique physical properties and their behavior in aquaculture systems – phases, humidity, saturation, stratification, light reflection and refraction – is pertinent to properly manage water quality in production systems, according to world-renowned expert Dr. Claude Boyd.
Aquafeeds
Multiple methods for phytoplankton assessment
The simplest tool for assessing phytoplankton abundance in aquaculture ponds is the Secchi disk. An electronic turbidimeter can be used to measure the amount of light scattered by a water sample.
Responsibility
Carbon-nitrogen ratios in pond fertilization and biofloc systems
Prof. Claude Boyd on the importance of carbon-nitrogen ratios for pond fertilization and biofloc systems, and the relevance of precise carbohydrate inputs.