Multiple methods for phytoplankton assessment
Secchi disks, turbidimeters are common, efficient tools
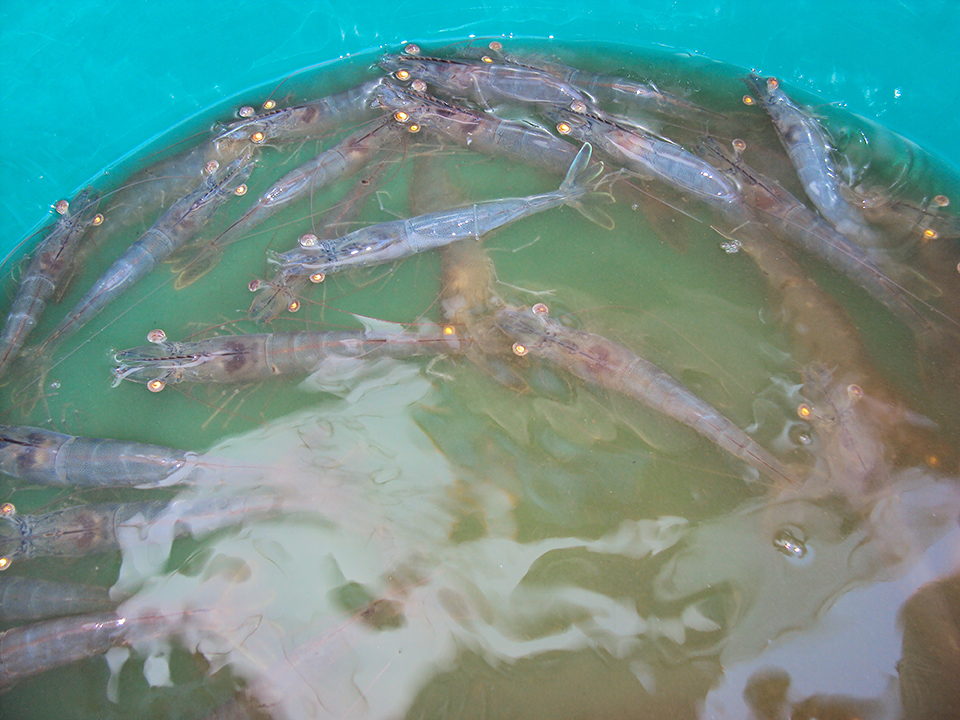
Phytoplankton form the base of the food web in fertilized aquaculture ponds. In ponds with feeding, some species need natural food during the first few weeks of culture, but later, phytoplankton usually contribute relatively little to the nutrition of the culture animals.
Nevertheless, phytoplankton are important in nearly all ponds as a source of dissolved oxygen from photosynthesis and for creating turbidity to minimize the growth of underwater aquatic plants. In ponds with feeding, phytoplankton remove carbon dioxide and ammonia nitrogen from the water and transform these substances – both of which can be harmful at high concentration to culture species – into organic matter.
Excessive phytoplankton in ponds can be detrimental by causing high afternoon pH, low nighttime dissolved oxygen concentrations and shallow thermal stratification of the water column. Some species of blue-green algae produce odorous chemical compounds that are absorbed by fish and shrimp, imparting off-flavors to the flesh. Other algae, including certain species of blue-green algae, produce substances that are toxic to fish and shrimp. Pigments from blue-green algae also can cause discoloration of shrimp heads during processing.
Because of both the beneficial and harmful roles of phytoplankton in aquaculture ponds, managers often desire to assess the abundance of phytoplankton. There are several techniques by which this can be done.
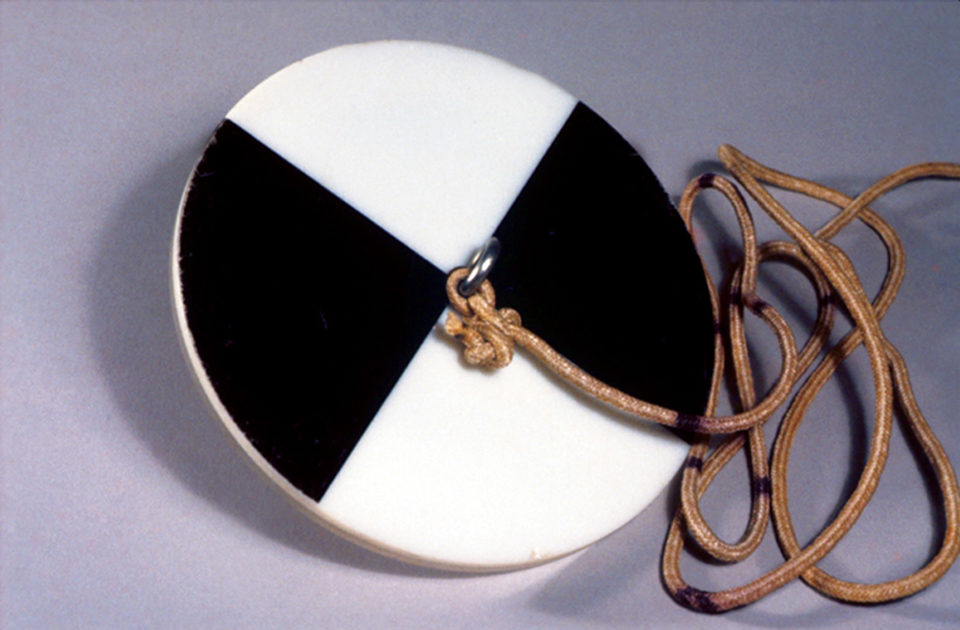
Secchi disk
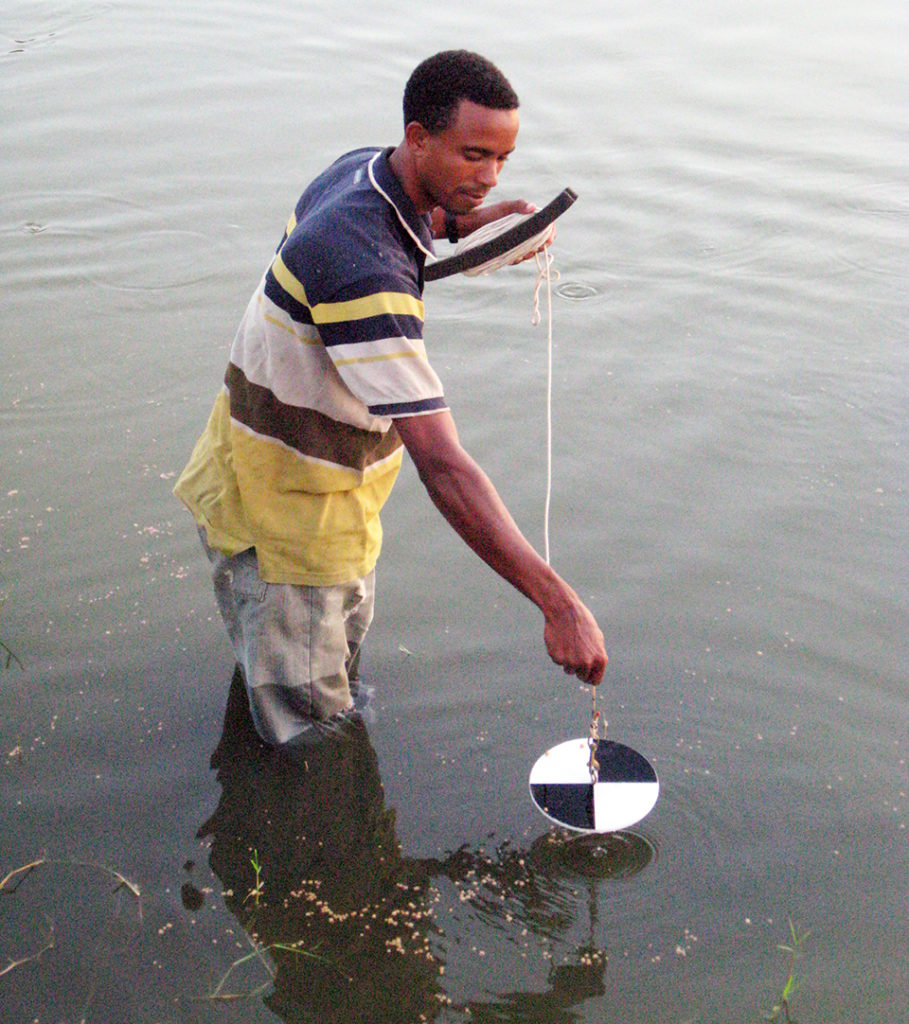
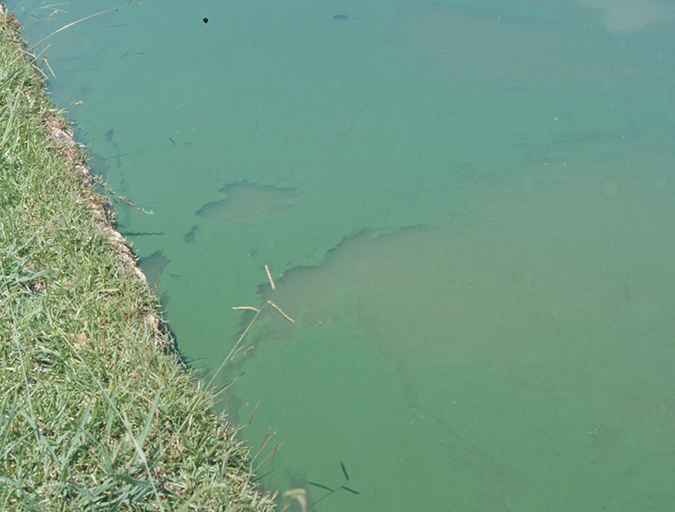
The simplest tool for assessing phytoplankton abundance is the Secchi disk. The depth at which this 20-cm-diameter disk disappears from view is the Secchi disk visibility. Because phytoplankton are the major source of turbidity in most pond waters, Secchi disk visibility usually is a fair estimate of the amount of phytoplankton. Of course, when using the Secchi disk, it is a good idea to observe the general appearance of the water, for suspended soil particles – like plankton – lessen visibility into the water.
In ponds where turbidity is mainly from phytoplankton, guidelines such as those shown in Table 1 can be developed for assessing the status of the phytoplankton community for a particular aquaculture operation. Different observers may obtain considerably different readings of Secchi disk visibility for the same pond at the same time if the method for making observations is not standardized.
Boyd, Assessment of Secchi disk, Table 1
| Secchi Disk Reading (cm) | Comments |
|---|---|
| Less than 20 cm | Pond is too turbid. If pond is turbid with phytoplankton, there will be problems with low dissolved oxygen concentrations without sufficient aeration. When turbidity is from suspended soil particles, natural productivity will be low. |
| 20-30 cm | Turbidity is becoming excessive. |
| 30-45 cm | If turbidity is from phytoplankton, pond is in good condition. |
| 45-60 cm | Phytoplankton are becoming scarce. |
| More than 60 cm | Water is too clear. Low natural productivity and danger of aquatic weed problems. |
Turbidimeter
An electronic turbidimeter can be used to measure the amount of light scattered at 90 degrees to the incident by a water sample. As more light is scattered, the abundance of suspended particles and, usually, phytoplankton is greater.
This technique has the same limitation as the Secchi disk in not being able to distinguish between phytoplankton cells, colonies or filaments, and other suspended particles. It is, however, not subject to as much observer variation as can occur in the determination of Secchi disk visibility.
Light-dark technique
The rate of photosynthetic oxygen production by phytoplankton and the rate of oxygen consumption by respiration within the water column can be assessed by the oxygen, light-dark bottle technique.
In the simplest application of this procedure, three bottles, one of which has been coated with black tape or some similar substance to completely eliminate light, are filled with pond water. Dissolved oxygen concentration is measured immediately in one of the clear bottles, called the initial bottle. The other two bottles – the remaining clear or light bottle and the opaque or dark bottle – are incubated at the same depth in the pond.
Incubating the bottles at about 25 percent of the depth of the Secchi disk visibility provides an acceptable average illumination for the water column. But for best results, several sets of light and dark bottles should be incubated at different depths. After an incubation period of several hours, usually from dawn until noon or noon until sundown, bottles are removed and dissolved oxygen concentrations are measured.
Normally, the dissolved oxygen (D.O.) concentration increases in the light bottle because the photosynthetic rate exceeds the respiratory rate. D.O. concentration declines in the dark bottle because of the lack of light for photosynthesis.
Example
As an example, suppose the initial bottle had 4.0 mg/L dissolved oxygen, and after incubation from dawn until noon, the dark bottle has 2.5 mg/L dissolved oxygen as compared to 7.0 mg/L in the light bottle. For simplicity, assume that the lengths of daytime and nighttime are equal.
The respiration is calculated by subtracting the value for the dark bottle from that of the light bottle (1.5 mg/L in six hours or 6 mg/L in 24 hours). The gross oxygen production by photosynthesis can be estimated by subtracting dark bottle from light bottle (4.5 mg/L in six hours or 9 mg/L in 24 hours, for there is no photosynthesis at night). Net dissolved oxygen production in the pond over a 24-hour period is gross photosynthesis minus respiration or 3 mg/L.
These results are typical of aquaculture ponds with dense phytoplankton blooms. Although much dissolved oxygen is produced by photosynthesis, most of that oxygen is used up by respiration of phytoplankton and other microorganisms in the water column. Nevertheless, the greater the rate of net photosynthesis, the higher the dissolved oxygen concentration at night.
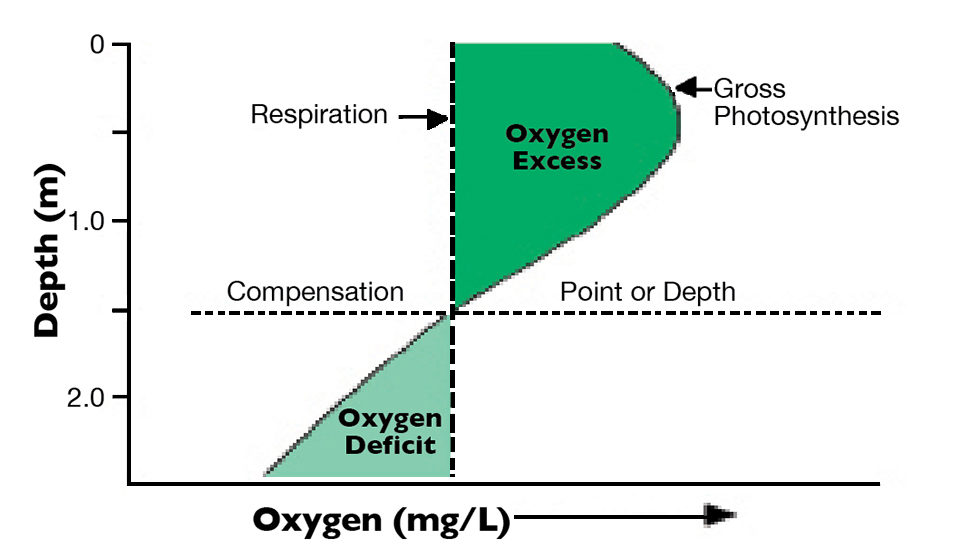
Photosynthesis, water depth
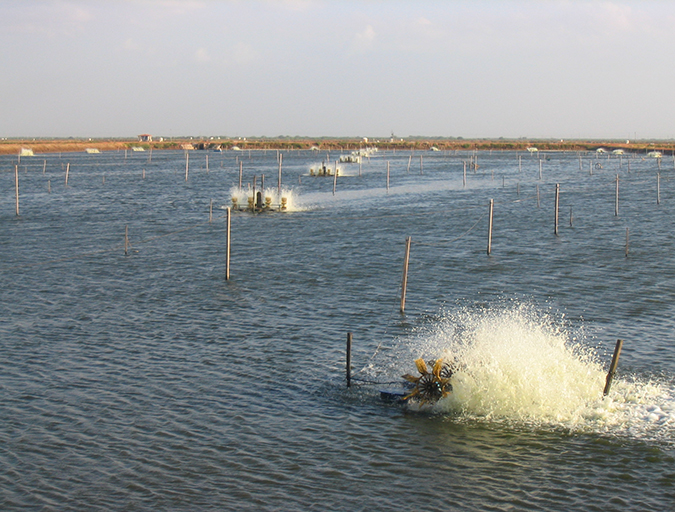
Typically, photosynthesis declines with depth in an aquaculture pond because of decreasing illumination with greater depth. The water column usually mixes relatively well from surface to bottom in aquaculture ponds less than 2 m deep, especially if ponds are mechanically aerated. Mixing results in a fairly uniform temperature profile, and respiration rate is similar throughout the water column. Dissolved oxygen produced in surface water by photosynthesis also is mixed throughout the water column.
The depth where the quantity of dissolved oxygen produced in photosynthesis just equals the amount used in respiration is the compensation depth (Fig. 1). When the amount of dissolved oxygen produced above the compensation depth exceeds the oxygen deficit below the compensation depth, a non-aerated pond should not suffer dissolved oxygen depletion during the night. But if the oxygen deficit below the compensation depth is equal to or greater than the oxygen surplus above this depth, dissolved oxygen depletion is likely, especially during calm weather, when diffusion of oxygen from air to water is slow.
Chlorophyll a
Phytoplankton also can be assessed by measuring chlorophyll a concentration. With this method, a water sample is filtered through a glass fiber filter, and the phytoplankton retained on the filter is extracted with acetone or acetone plus methanol to remove the pigment. The amount of chlorophyll a (and other pigments if desired) in the extract can be measured by spectrophotometry.
There is a linear, positive relationship between chlorophyll a concentration and phytoplankton abundance. In an unfertilized pond, chlorophyll a concentration often is only 2 to 5 µg/L, as compared to 20 to 80 µg/L in a fertilized pond and over 100 µg/L in ponds with large feed inputs. Since chlorophyll a concentration can be measured fairly easily, it is surprising that more large aquaculture facilities do not use this technique.
Microscopic counts
The number of phytoplankton cells, colonies or filaments per milliliter of water can also be counted microscopically. This technique is laborious, and it is difficult to evaluate the results. The difficulty arises because algal species differ tremendously in size, and a sample with a huge abundance of small species may not have as much algal biomass as a sample with a lower abundance of larger species.
The procedure also is tedious and time-consuming, and requires an analyst skilled in algal identification. It is surprising that many large aquaculture facilities rely upon this method.
Microscopic examination, however, is the only way to ascertain the abundance of particular algal genera or species. Such information is needed in assessments of off-flavor and algal toxicity events.
(Editor’s Note: This article was originally published in the March/April 2011 print edition of the Global Aquaculture Advocate.)
Author
-

Department of Fisheries and Allied Aquacultures
Auburn University
Auburn, Alabama 36849 USA
Related Posts
Health & Welfare
Ammonia toxicity degrades animal health, growth
Ammonia nitrogen occurs in aquaculture systems as a waste product of protein metabolism by aquatic animals and degradation of organic matter, or in nitrogen fertilizers. Exposure can reduce growth and increase susceptibility to diseases in aquatic species.
Responsibility
Light penetration in water
Light penetrating water is scattered and absorbed exponentially as it passes downward. The presence of dissolved organic matter and suspended solids further impedes light penetration, and different types of solids absorb different wavelengths.
Health & Welfare
Phytoplankton a crucial component of aquaculture pond ecosystems
Phytoplanktonic organisms, or microalgae, are very abundant in aquaculture ponds and have critical roles in these ecosystems, significantly influencing overall pond ecology and water quality. Proper management of phytoplankton populations is essential for successful aquaculture pond production.
Health & Welfare
Proper water circulation in aquaculture ponds critical
Promoting water circulation during the day time is an effective strategy to enrich pond water with oxygen produced by photosynthesis, and can significantly reduce the costs of night time supplemental aeration.