Lifecycle analysis model quantifies ecological footprint of salmon feed
EWOS teams with Canadian academic researchers specializing in sustainability modeling
Ecological footprinting or eco-printing was introduced in the United States in the early 1990s and quickly became globally recognized as a method for measuring sustainability. An eco-footprint is a measure of the demand placed on Earth’s ecosystems by specific activities. It is calculated by assessing the area of biologically productive land and marine ecosystem required to produce the resources necessary to support the activity, along with the area needed to absorb and render harmless a subset of the corresponding wastes.
EWOS Innovation has worked in cooperation with Canadian academic researchers specializing in sustainability modeling to develop a unique model to measure the eco-footprints of EWOS feeds. The EWOS group has begun to use this ecological footprint (E.F.) modeling tool to quantify the scale of ecosystem support required to sustain the production of its fish feeds and assist in the development of more sustainable feed input sourcing and product offerings at its companies in Canada, Chile, the United Kingdom and Norway.
E.F. model
The footprint model is a sophisticated tool into which a number of different layers of data are built for each raw material. The two primary sub-components of the ecological footprint analyzed are the area of ecosystem support required to sustain the production of biotic resource inputs, whether from marine or terrestrial origins, and to assimilate carbon equivalent to the total greenhouse gases emitted in feed production.
The quantification of supply chain greenhouse gas emissions associated with the production, processing, packaging and transport of each feed input, along with the production of salmon feeds has been undertaken using ISO-compliant lifecycle analysis methodologies.
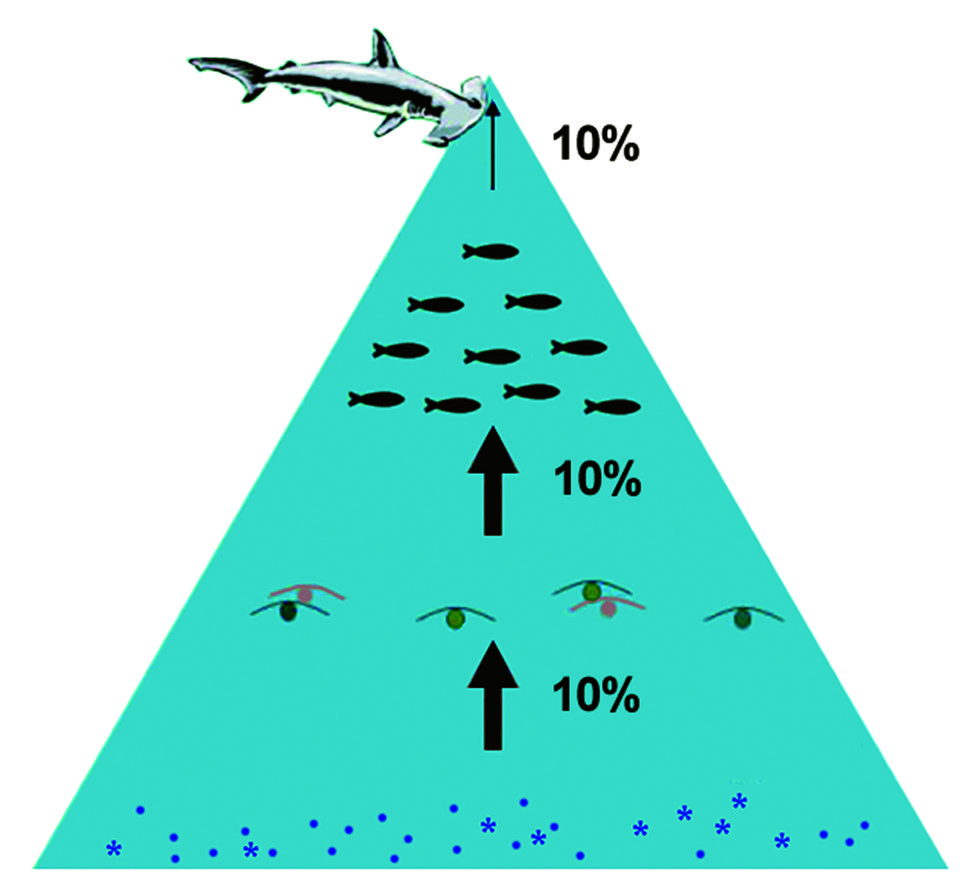
When using the tool, it is important to realize some intrinsic differences between the raw materials used in salmon feeds. Raw materials from marine ecosystems have a higher footprint than those from terrestrial systems in general. This should not be surprising, since natural marine ecosystems – which contain a variety of species, of which only one is targeted – are much less productive per hectare than an intensively farmed, terrestrial plot of land producing a monoculture crop.
This is perhaps the largest driver in the overall feed eco-footprinting. Other important drivers include the energy used to produce, process and transport the feed inputs, along with feed milling.
Assessing feeds
There are significant differences in the eco-footprints of feeds. Marine ingredients have by far the largest impacts on overall feed footprints. Their impacts are influenced by the quantity of marine ingredients in the dietary formulation, but even more by the trophic levels of the fish used in the production of the fishmeal and oil. Utilizing fish species from higher trophic levels results in much larger footprints, as greater total ecosystem resources are required to support these predators.
Choice of target fish species is therefore important when purchasing fishmeal and oil, as well as the total inclusion rate of marine ingredients, if the sole focus is to reduce the eco-footprint. It is worth noting that the fishing method for the target fish is also a contributory factor due to the energy consumption and associated greenhouse gas emissions.
Plant-derived raw materials
Aside from selecting marine resources and reducing their use, E.F. magnitude can also be reduced through the careful inclusion of selected plant-derived raw materials. As noted above, intensive crop monoculture is highly productive and has much lower E.F. values than for marine resources. However, the EWOS E.F. model accounts for processing and transport to the feed mills. This makes the models sensitive to regional energy sources and transport modes, both of which influence emission intensity; as well as regional farming techniques, which influence productivity from the land area.
By looking at the footprint of each raw material available, scientists can compare the compositions of different feeds and formulate diets with a lower E.F. However, it is essential that the feeds also provide the nutrients required by the fish at an economically viable cost.
There has to be a balance between lowering E.F. in the feed and the overall worth of the feed nutritionally and economically. For example, if nutritional quality was compromised, the fish would require more feed to grow. So while the feed E.F. would be low, the corresponding fish E.F. would be high. Feed manufacturers are therefore seeking ways to reduce E.F. while maintaining the nutritional quality of feeds at the right price.
Fishmeal, fish oil replacement
In general, the salmon-farming industry has gradually reduced its dependence on fishmeal and oil per unit output. However, it is still not able to completely remove these raw materials – which provide the long-chain n-3 highly unsaturated fatty acids (HUFAs) that are so beneficial to human health and currently only available in high volumes through the use of fish oil. EWOS and other manufacturers are using new technologies in instrumentation, biotechnology and trial design to get closer to “marine independence.” Fast-track innovations are achieving lower feed eco-footprints while maintaining the nutritional quality of the salmon we eat.
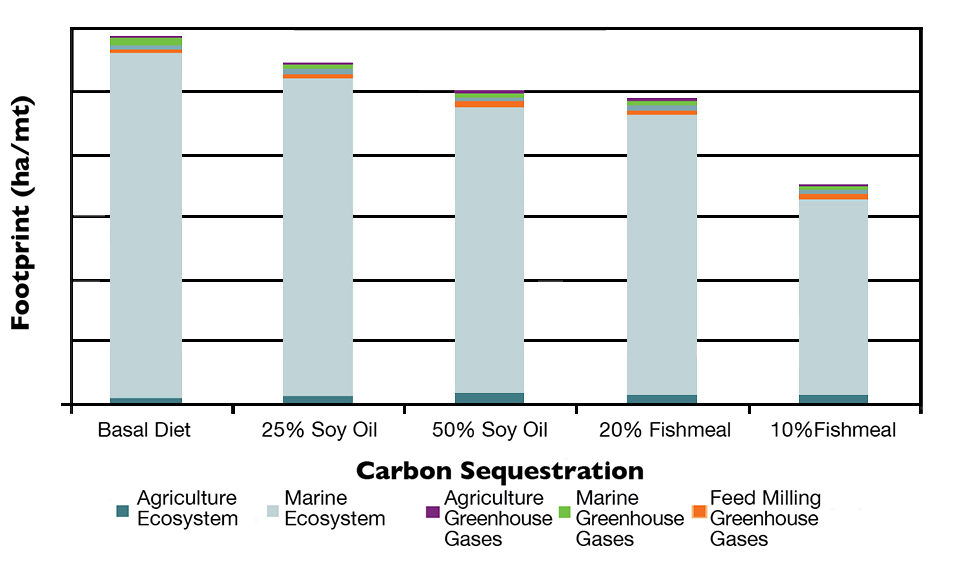
Running the E.F. model on new salmon feeds in which fishmeal content is reduced from 20 to 10 percent of the diet and replaced, for example, by soy meal indicates a large reduction in the total feed E.F. (Fig. 1). Similarly, replacing fish oil with soy oil also achieves a significant reduction.
Limitation
One important limitation of the model is that it cannot yet account for the nutritional benefits of different feeds. The inclusion of n-3 HUFAs has already been mentioned as an example. Fish oil inclusion in feed secures a concentration of n-3 HUFAs in the salmon fed the diet, but also raises the E.F.
The human health benefits of n-3 HUFAs are well known and reported by doctors, scientists and governments. Failure to include these will have a much greater impact on long-term sustainability than can be measured by the E.F. alone, highlighting the complexities of sustainability issues that have to be considered by the salmon industry.
Greenhouse gases
It is worth noting that salmon farming yields significantly lower “farm gate” greenhouse gas emissions than most other animal protein sources, mainly due to much greater efficiencies in feed conversion into meat. In an October 2009 article on life cycle assessment of salmon-farming systems in Environmental Science and Technology, Dr. Nathan Pelletier and fellow researchers identified greenhouse emissions for salmon of 2.15 t CO2-e/t production. The values for Swedish pork and Belgian beef were 3.3-4.4 t CO2-e/t and 14.5 t CO2-e/t, respectively.
More importantly, the potential for further improvement is significant, given the relative impact feed has upon the total environmental impact of salmon farming and the wide range of impacts characteristic of available feed inputs.
(Editor’s Note: This article was originally published in the January/February 2011 print edition of the Global Aquaculture Advocate.)
Authors
-

EWOS Innovation
Dirdal N 4335, Norway -
Global Ecologic Environmental Consulting and Management Services
British Columbia, Canada -
School for Resource and Environmental Studies
Faculty of Management
Dalhousie University
Halifax, Canada -
EWOS Scotland
Westfield, Bathgate, West Lothian
United Kingdom
Related Posts

Intelligence
Aquaculture 2016: Examining the industry’s role in the food system
A wide range of important topics was discussed at the Aquaculture 2016 conference and trade show in Las Vegas last week. Editor Emeritus Darryl Jory shares his notes from the four-day event, which occurs every three years.
Responsibility
Land-use efficiency study puts aquaculture on a pedestal
Focused on land-use implications of terrestrial meat production, the study concluded that aquaculture can meet the protein demands of a growing global population without adding strain on arable land, water or our other natural resources.
Innovation & Investment
Opinion: America needs another revolution
The Ocean Stewards Institute responds to a critical article in The Hill over and argues that offshore aquaculture is the food revolution America needs.
Responsibility
Woodchip bioreactors effectively treat aquaculture effluent
Woodchip bioreactors can efficiently remove nitrate, phosphorus and total suspended solids from aquaculture wastewaters. Denitrification treatment of the relatively organic-rich aquaculture wastewater is a new and useful application to protect against water pollution.