Global map of fishmeal and fish oil plants seeks to improve seafood traceability and management
Results identified 506 plants in 63 countries, owned and/or operated by 413 companies
A new paper by Canadian researchers highlights a critical gap in the global aquaculture supply chain: while fishmeal and fish oil are essential ingredients in commercial aquafeeds, there is limited publicly available information that pinpoints where these inputs are produced. This lack of seafood traceability makes it harder to evaluate the environmental, economic and social impacts of specific production plants – and the global footprint of the industry as a whole.
The study – authored by Lauren Shea, MSc (corresponding author, currently at The Baum Lab) and Drs. Colette C.C. Wabnitz, Wlliam W.L. Cheung, Daniel Pauly and U. Rashid Sumalia of the Institute for the Oceans and Fisheries, The University of British Columbia, Vancouver, Canada – offers a first look at the geographic distribution of the fishmeal and fish oil industry. It’s a valuable resource for marine resource managers and policymakers, and provides an open-source database listing plant locations, company names and the types of raw material type used.
“Understanding the spatial distribution of fishmeal and fish oil plants is critical for better, more sustainable management of this industry. With this information, we can begin to investigate questions related to the social, environmental and economic impacts of individual plants and/or clusters of plants,” Shea told the Advocate. “Also, as fish species begin to shift their ranges due to climate change, we must work towards the development of cooperative international fisheries management agreements and policies.”
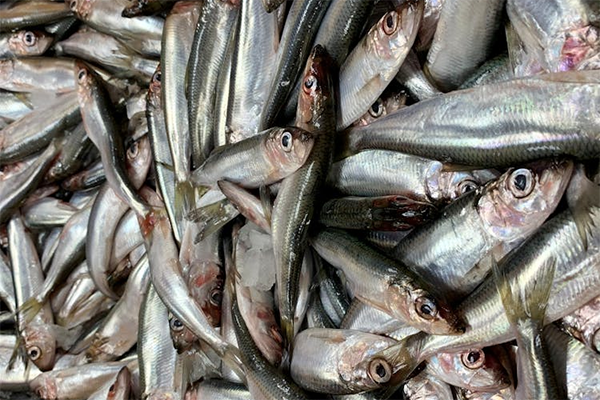
Fishmeal and fish oil are critical to the fed aquaculture sector due to their unique nutrient profiles, palatability and high protein content. Fishmeal is particularly rich in protein, with a much higher protein-to-meal ratio compared to plant-based alternatives. The need for key nutrients in aquatic feeds has diverted millions of tons of nutritious fish away from countries with high rates of nutrition insecurity, the authors stated.
![Ad for [Aquademia]](https://www.globalseafood.org/wp-content/uploads/2025/07/aquademia_web2025_1050x125.gif)
Fishmeal and fish oil can be produced using whole fish and/or fish processing waste. However, a large proportion of the raw materials – 66 percent for fishmeal and 47 percent for fish oil – still originate from wild-capture, small pelagic fisheries, the so-called forage fisheries, but this practice is controversial.
While several studies have reported on the efficacy and prioritization of using whole fish for fishmeal and fish oil production, there is limited research on other relevant factors, such as the location of the fishmeal and fish oil plants, the species used as raw material and plant ownership. These data matter because of the implications for local and regional food insecurity, and also because plants can have significant localized environmental effects on nearby communities.
Understanding the spatial distribution of plants could help identify hotspots where these environmental and social impacts are most pronounced, enabling more targeted mitigation and management strategies, the authors note. Climate change adds another layer of complexity: as fish stocks shift, the viability of plant locations may be threatened. Temperature-driven shifts in fish stocks have already been seen in West Africa, where fishmeal and fish oil plants line the coast. Mapping plant positions offers a critical reference point for assessing how these changes in fish stocks could impact the industry and coastal communities over time.
The study identified 506 individual fishmeal and fish oil plants located in 63 countries (Fig. 1), owned and/or operated by 413 companies. Of these, 63 percent had known locations verified using satellite imagery and company website information (data type A), and the remaining 37 percent were missing specific location information and/or could not be verified using satellite imagery (data types B, C, or D). Peru had the highest number of FMFO plants (n = 125), followed by Mauritania (n = 42) and Chile (n = 33).
Fig. 1. Spatial distribution of plants. Plants are color-coded by data type. Plants in dark blue (data type A) represent plants whose locations were verified using satellite imagery and company website information. Green shaded circles represent and are scaled to the number of plants per producing country. Data A: Factory location verified using the Google Maps satellite image layer. Data B: Factory address published on company website or by a third-party source but not verified using satellite image layer. Data C: The city or province in which the factory is located is known, and the coordinates for the city/province are used or the geocode confidence score for the address is 0.5 or below. And Data D: Only the country in which the factory is located is known. For additional information, refer to the original article.
This research collected information on the raw materials used as inputs (whole fish or byproducts) by these plants for fishmeal and fish oil production. The database and results generated offer a valuable base to understand the regional distribution of the industry and to identify data gaps. These findings can be used in additional studies on the trade of marine ingredients for feeds and provide vital data for analyses into the environmental, economic and social impacts of fishmeal and fish oil plants, to support the implementation of effective policies for the responsible production and use of fishmeal and fish oil.
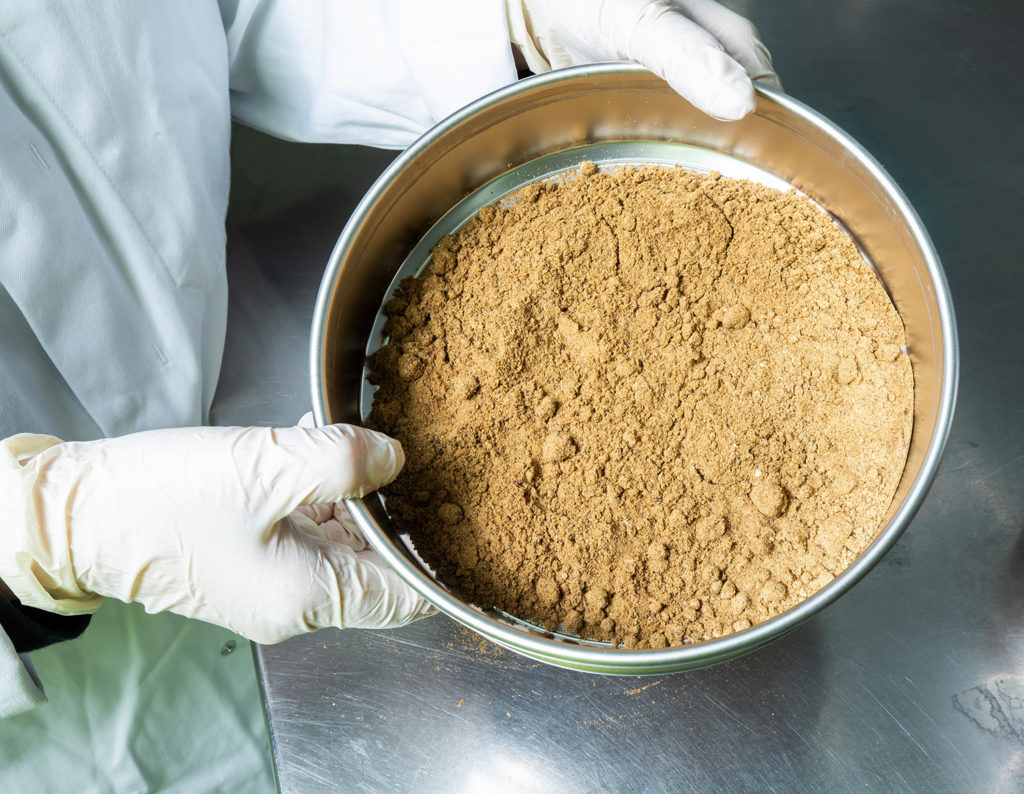
Information on raw material inputs (i.e., whole fish or byproducts) was available for 377 plants (75 percent of total). Species data, to the functional group level, were only available for 298 plants (59 percent). The most common single raw material used by plants (49 percent) were byproducts, with whole fish as the primary source of raw material for 37 percent of plants. The remaining plants (14 percent) used both whole fish and byproducts.
Most companies (60 percent) that source whole fish as raw material for fishmeal and fish oil production rely on small pelagic species (<30 cm). In contrast, byproducts come from a broader range of species and include waste from capture fisheries and aquaculture. The study used production data for the 63 countries to calculate the ratio of fishmeal to fish oil production for each country: it was variable and ranged among the top 20 producers between 17.8 and 1.1.
“Knowing the locations of plants and where fishmeal and fish oil production is concentrated can inform the development of cooperative national and international policies to ensure environmentally and socially responsible standards,” stated the authors.
One unexpected finding is that most plants are using fishery and/or aquaculture byproducts – rather than whole fish – for fishmeal and fish oil production. However, a larger proportion of fishmeal and fish oil still originates from whole fish. This is an important consideration for policymakers aiming to improve management of the industry. When fish byproducts are converted into fishmeal and fish oil in a transparent and well-regulated manner, it can represent an efficient waste-management strategy.
According to the results, the number of fishmeal and fish oil plants in a given country is not a reliable indicator of total production, as facilities vary widely in capacity depending on the processing technologies used. Many factors can affect these capacities, including production costs, equipment type, environmental conditions (particularly temperature) and the lipid content of raw materials used (different fish species have varied oil content). Additionally, the refining processes used can also affect both the quality and quantity of oil extracted.
“[Fishmeal and fish oil] are limited resources, and although the use of novel feed ingredients is on the rise, they are unlikely to make a major contribution to the industry for years to come. Therefore, it is crucial to support the environmentally sustainable and socially responsible management of the [fishmeal and fish oil] industry as it stands. Despite concerns regarding the use of whole fish for [fishmeal and fish oil] production, it remains an effective waste management strategy for fish processing activities via the use of by-products for [fishmeal and fish oil] production. Policies should be better designed to incentivize by-product rendering for circular food production systems,” concluded the authors.
Now that you've reached the end of the article ...
… please consider supporting GSA’s mission to advance responsible seafood practices through education, advocacy and third-party assurances. The Advocate aims to document the evolution of responsible seafood practices and share the expansive knowledge of our vast network of contributors.
By becoming a Global Seafood Alliance member, you’re ensuring that all of the pre-competitive work we do through member benefits, resources and events can continue. Individual membership costs just $50 a year.
Not a GSA member? Join us.
Author
-

Editor Emeritus
Related Posts
Aquafeeds
Point: There are no essential ingredients in aquaculture feeds
Kevin Fitzsimmons, leader of the F3 (fish-free feed) Challenge, says aquaculture may currently depend on fishmeal and fish oil, but farmed fish do not.
Aquafeeds
Counterpoint: Marine ingredients are stable in volume, strategic in aquaculture nutrition
IFFO Director General Petter M. Johannessen says fishmeal and fish oil offer unmatched nutrition and benefits to fuel aquaculture’s growth trajectory.
Aquafeeds
After testing new feed ingredients, Thai Union finds reluctant uptake
The company has engaged in feed trials with both algae and microbial meals, before its sustainability director said farmers, “by and large, don’t want it.”
Innovation & Investment
Artemia, the ‘magic powder’ fueling a multi-billion-dollar industry
Artemia, microscopic brine shrimp used as feed in hatcheries, are the unsung heroes of aquaculture. Experts say artemia is still inspiring innovation more than 50 years after initial commercialization. These creatures are much more than Sea-Monkeys.