FAO fish indices enhance global seafood price evaluations
Data give greater understanding of underlying drivers in seafood markets
A growing share of global seafood trade is dominated by a limited number of species, and often from aquaculture. These species are the most technologically and commercially successful products in the aquaculture industry, with pangasius, salmon, shrimp and tilapia as some of the most important ones.
The increasing dominance of these farmed species is reflected in the eating habits of consumers in the United States. Table 1 shows the top 10 seafood species in the United States in 2000 and 2012. Besides abundant capture species such as pollock and tuna, aquaculture products are increasingly lending U.S. consumers’ choices for seafood.
Shrimp and salmon both moved up one place to the first and third positions in 2012. At the same time, tilapia and pangasius “jumped” into the top 10 list to take the fifth and sixth positions. Aquaculture has become the preferred source of seafood products in the United States. On a global level, aquaculture is predicted to account for two-thirds of the seafood supply by 2030, according to the World Bank.
Asche, Most consumed seafood products, Table 1
| Rank | 2000 Species | 2000 (kg/capita) | 2012 Species | 2012 (kg/capita) |
|---|---|---|---|---|
| 1 | Canned tuna | 1.59 | Shrimp | 1.91 |
| 2 | Shrimp | 1.45 | Canned tuna | 1.18 |
| 3 | Pollock | 0.72 | Salmon | 0.88 |
| 4 | Salmon | 0.72 | Pollock | 0.59 |
| 5 | Catfish | 0.45 | Tilapia | 0.59 |
| 6 | Cod | 0.34 | Pangasius | 0.29 |
| 7 | Clams | 0.21 | Catfish | 0.25 |
| 8 | Crabs | 0.17 | Crab | 0.24 |
| 9 | Flatfish | 0.19 | Cod | 0.23 |
| 10 | Scallops | 0.12 | Clams | 0.15 |
![Ad for [BSP]](https://www.globalseafood.org/wp-content/uploads/2025/07/BSP_B2B_2025_1050x125.jpg)
Seafood trade competition
The influence of aquaculture on global seafood prices comes through increasing international seafood trade competition. During the last few years, the Food and Agricultural Organization of the United Nations (FAO) has published a fish price index in the publication Food Outlook that provides useful information on global fish prices.
Based on the 2012 FAO statistics, one can estimate that 78 percent of world seafood production was exposed to some kind of international trade competition. This share is probably even higher now, and importantly, competition has resulted in more harmonized price movements.
This is not to say that seafood prices exposed to competition now move in parallel, because there are still substantial differences among seafood products and their markets. Nevertheless, it does mean that seafood prices today share common long-term trends to a larger degree than they did, say, 20 years ago. This is particularly the case for price movements across different geographical seafood markets consisting of relatively homogenous products such as whitefish, tuna and salmon.
FAO fish price index
The increase in international seafood trade competition can be visualized by showing international seafood import flows. Figures 1 and 2 illustrate the growth in seafood trade based on the data used for the calculation of the FAO fish price index on imports of fresh and frozen seafood products to the European Union, Japan and United States. These import flows accounted for approximately 70 percent of the total imports to the areas.
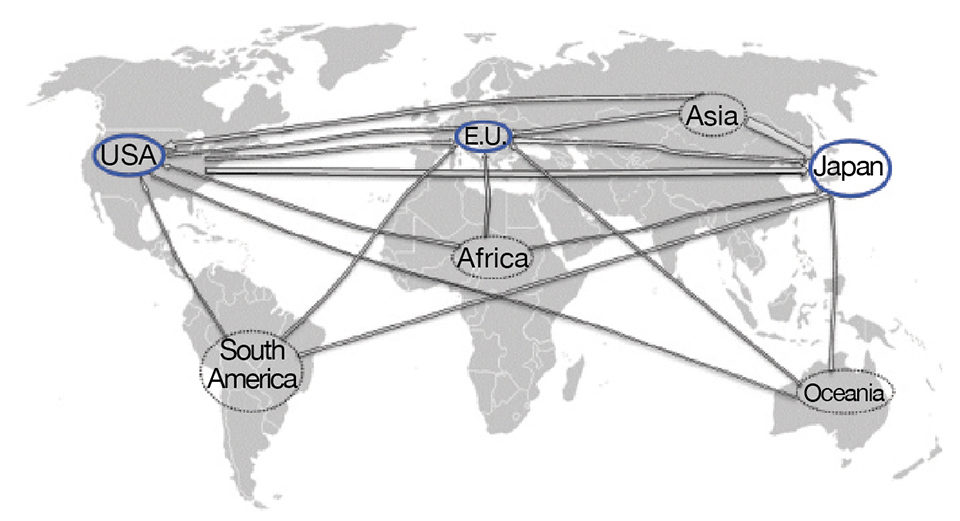
The figures show the real value of the seafood imports to these three markets in 1990 and 2011, respectively, using the price index as a deflator. This means the thickness of the arrows can be interpreted as a measure of the volume of seafood import flows.
The thicker arrows for 2011 in Figure 2 reflect the growth in seafood imports, especially from Asia, but also from other regions. The total real value of seafood imports in 1990 to the E.U., Japan and United States was U.S. $24.5 billion, compared to $39.7 billion in 2011. In real terms, this corresponded to an annual import growth of 2.3 percent, but the corresponding nominal growth in seafood imports was actually 4.7 percent – from U.S. $23.4 billion in 1990 to $61.0 billion in 2011.
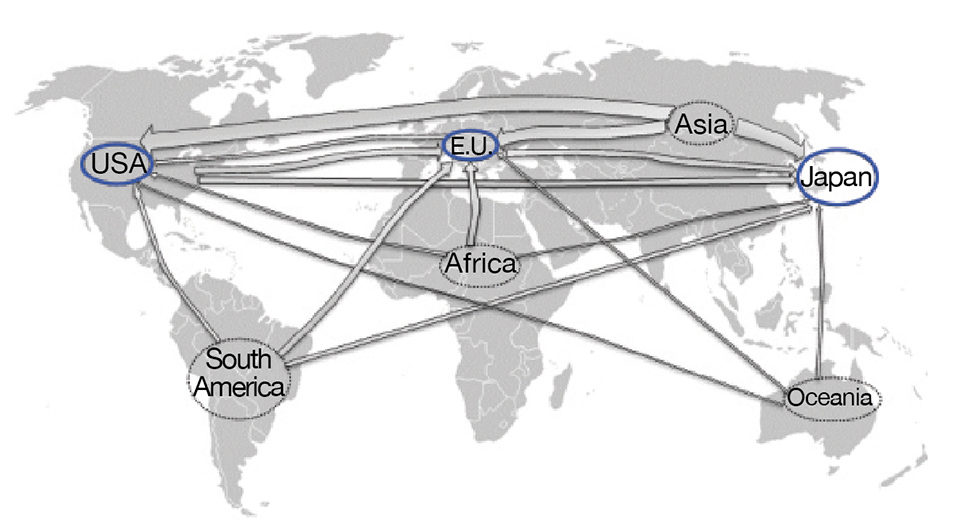
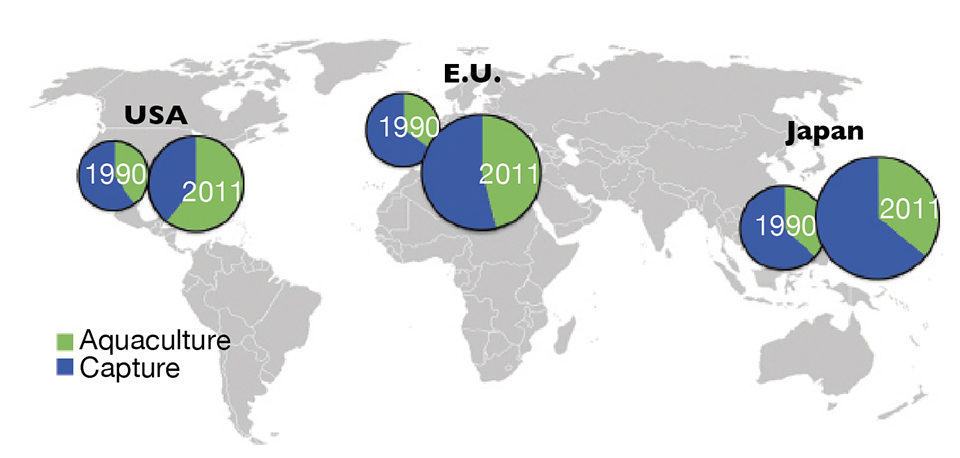
Fig. 3 shows both the sizes and shares of seafood imports sourced from capture fisheries and aquaculture for 1990 and 2011. The figure illustrates that growth in the aquaculture supply has allowed seafood trade to grow. It can also be inferred from this trend that seafood has become more commodified, knowing that aquaculture consists of fewer species of more homogenous size and quality.
FAO information
FAO’s fish price index is calculated and updated based on the 608 unique import product categories of fish and seafood provided by the Norwegian Seafood Council in cooperation with the FAO. In Fig. 4, the thick blue line is the aggregated FAO fish price index, while the others are sub-indices representing the individual price development of the species groups included in the aggregated price index.
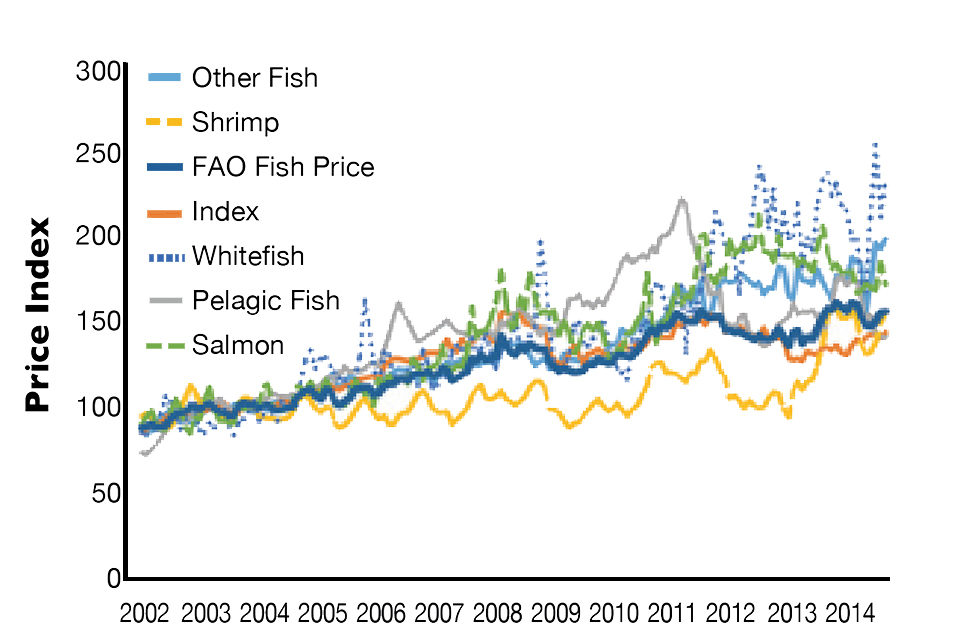
A simple way to interpret this graph is that price indices that track above the aggregated price index reflect scarce supply of those species groups, while the indices below represent species in relatively abundant supply. For example, the sharp rise in salmon prices from 2009 to 2011 was caused by an outbreak of infectious salmon anemia in Chilean aquaculture that seriously affected global supply. Salmon prices returned to previous levels close to the main index in late 2011, showing the flexibility of aquaculture production in the longer term.
Looking at the indices overall in the graph, a pattern that emerges is that those species whose total supply depends mostly on capture fisheries are the ones that usually are above the aggregated index. This includes tuna and pelagic fish. Species that depend on mostly aquaculture supply are below or close to the main index. Imported shrimp, which is mainly farmed, is clearly below the main index.
Finally, whitefish is an odd category. This was driven by high-value cod fish in the 1970s and 1980s, and then by lower-value species like hake and Alaska pollock in the 1990s. However, today the whitefish market is broader and includes farmed species like catfish, pangasius and tilapia, as well.
All fish species that can be used as raw material in whitefish products such as fish fingers and frozen fillets form this market. This has obviously led to strong price competition. This is also reflected in the price index for whitefish, which for some period was actually below the main price index. To reiterate a point made earlier, price movements have become more harmonized within traded species groups, but as the graph shows, price differences between groups can be substantial, at least in the short to medium term.
Food index comparison
In Fig. 5, the green aggregated fish price index line is compared to FAO’s other food price indices. As the figure shows, fish has remained price competitive in comparison to other food items. That said, the graph shows that the overall food price index, which excludes fish prices, has been on a downward slope since 2011.
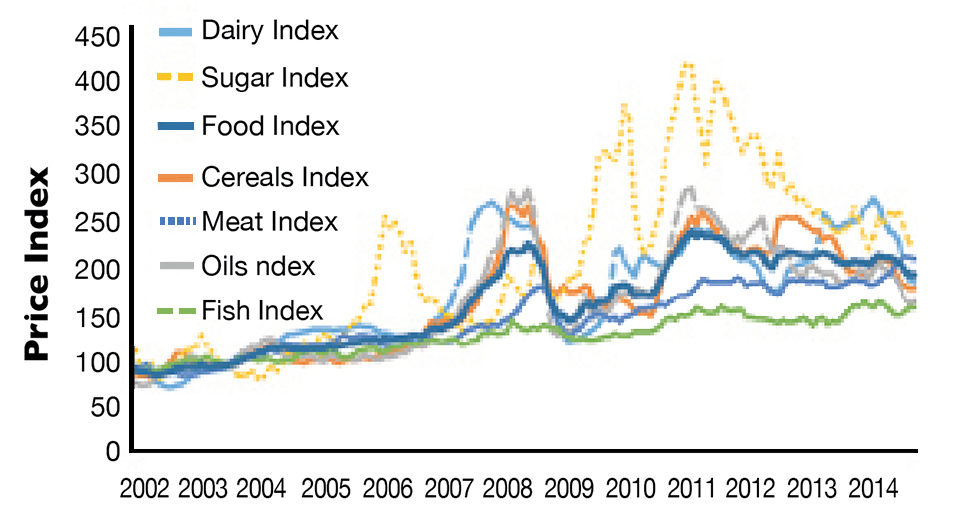
This means that the relative price competitiveness of seafood has declined, although it has remained price competitive relative to meat, the closest substitute among other food products. This is interesting, as the prices of key aquaculture inputs like fishmeal and fish oil have tended to increase compared to other feed inputs. This indicates that aquaculture’s dependence on these feed inputs is not a serious limiting factor for farmed output.
Aggregate effects
The FAO fish price indices clearly convey information about scarcity in seafood markets. In the short and medium terms, changes in scarcity (i.e., price) are normally driven by changes in supply (e.g., changes in fish stock abundance or disease outbreaks in aquaculture). In the longer term, however, scarcity also depends on how demand develops in markets, such as economic growth in emerging markets, economic downturns or changes in consumer tastes for seafood products.
The FAO price indices reflect the aggregate effects of all of these supply and demand influences. As such, the indices are a natural starting point for greater understanding of the underlying drivers in seafood markets.
(Editor’s Note: This article was originally published in the May/June 2015 print edition of the Global Aquaculture Advocate.)
Now that you've reached the end of the article ...
… please consider supporting GSA’s mission to advance responsible seafood practices through education, advocacy and third-party assurances. The Advocate aims to document the evolution of responsible seafood practices and share the expansive knowledge of our vast network of contributors.
By becoming a Global Seafood Alliance member, you’re ensuring that all of the pre-competitive work we do through member benefits, resources and events can continue. Individual membership costs just $50 a year.
Not a GSA member? Join us.
Authors
-

University of Stavanger
4036 Stavanger, Norway -
University of Stavanger
4036 Stavanger, Norway
Related Posts

Innovation & Investment
At seafood investor forum, a ‘blue-sky’ outlook and a search for the next salmon
At the IntraFish Seafood Investor Forum in New York, “all roads lead to salmon.” Buoyed by high prices and soaring demand, the sector is an example worth following. But it’s not without its challenges.

Intelligence
Aquaculture’s solid opportunity on The Rock
As aquaculture grows in Newfoundland, the socioeconomic future of this Canadian province with a population of 500,000 takes flight with it. It's a welcome development, after a two-decade slump due in part to the downturn of North Atlantic groundfish stocks.

Innovation & Investment
20 years of the Global Aquaculture Alliance
A timeline of key milestones and achievements by the Global Aquaculture Alliance and its third-party aquaculture certification scheme, Best Aquaculture Practices (BAP).

Intelligence
Aquaculture 2016: Examining the industry’s role in the food system
A wide range of important topics was discussed at the Aquaculture 2016 conference and trade show in Las Vegas last week. Editor Emeritus Darryl Jory shares his notes from the four-day event, which occurs every three years.