Assessing tilapia flour as an ingredient in bread
Results show enhanced nutritional value, acceptable sensory scores
Because bread is a good carrier of functional ingredients, a wide variety of studies have reported nutritional improvement after replacement of wheat flour by different industry by-products as fish flour or powder from several seafood sources, including tilapia, saithe surimi, red-tailed brycon (Brycon cephalus) and shrimp. However, the addition of byproduct ingredients in traditional bakery products may cause sensory changes and consumer rejection. To the best of our knowledge, no study has evaluated the consumer perception of bread enriched with tilapia flour (TF) made with mechanically separated meat (MSM) of Nile tilapia (Oreochromis niloticus).
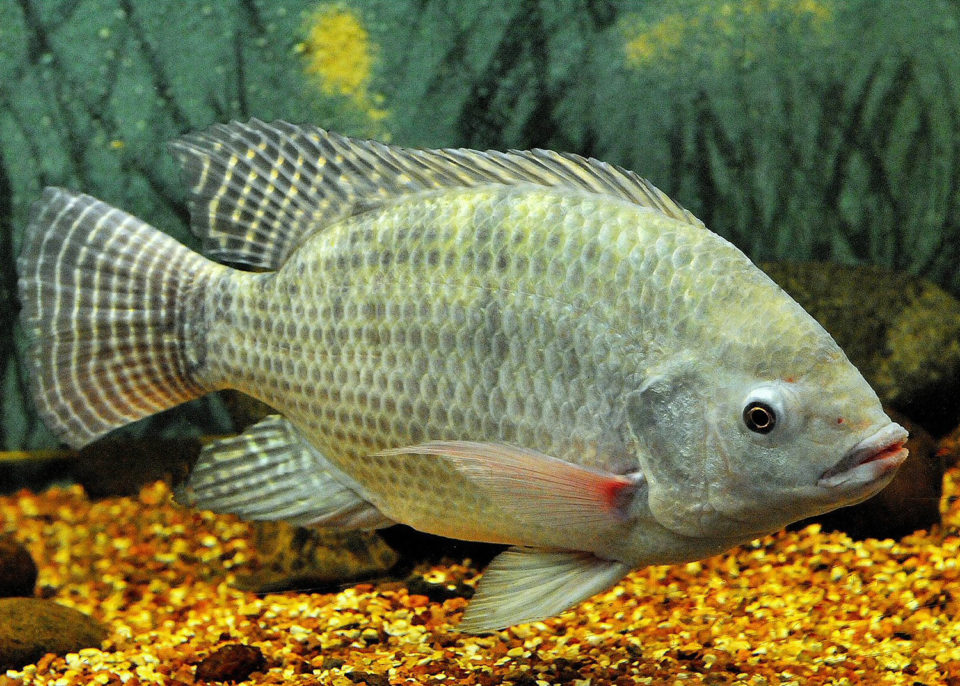
Although Nile tilapia is one of the most commercially important freshwater fish species, it has a low fillet yield of only about 30 percent of the live weight, and therefore most processed tilapia is considered processing waste. The high cost of disposal for this processing waste reportedly has prompted the food industry to develop recycling techniques to decrease environmental pollution and improve profits. Among fish byproducts, tilapia flour manufactured from meat adhered to skin and bones yields about 8 percent of the whole-fish weight, and is considered an inexpensive source of essential nutrients, constituting an interesting alternative nutritional supplement for bakery products.
Considering the market requirements, one of the main challenges of the food industry is to produce convenience food with added nutritional value, accessible cost, and pleasant sensory properties. Also, there is a lack of understanding of consumer perceptions about bread enriched with fish flour, which is important to promote the use of fish processing byproducts in the healthy food markets.
This article – adapted and summarized from the original publication – characterized formulations of bread fortified with different levels of tilapia flour made from MSM, from the point of view of nutritional value and sensory attributes; determined the overall liking for all bread formulations; and determined the cutoff point for wheat flour replacement by tilapia flour in wheat bread, using a consumer-based approach.
We are thankful for the fellowship support provided by the Fundação Carlos Chagas Filho de Amparo à Pesquisa do Estado do Rio de Janeiro (FAPERJ), grant numbers E-26/101.403/2014; E-26/202.305/2017, and E-26/202.306/2017 as well as the Conselho Nacional de Desenvolvimento Científico e Tecnológico (CNPq) grant numbers 442102/2014-3, 441987/2014-1, and 150696/2017-5; the Coordenação de Aperfeiçoamento de Pessoal de Nível Superior (CAPES), grant number E-26/101.403/2014 (CAPES/FAPERJ E-45—PAPDRJ/2013), and the Embrapa Food Technology for providing the facilities for the development of the consumer studies.
Study setup
For the preparation of tilapia flour, a total of 9.0 ± 0.3 kg of tilapia MSM, packed in polyethylene bags, was purchased from a commercial fish farm in Rio de Janeiro, Brazil. The MSM was dried for 12 hours at 65 degrees-C in a commercial, forced-air convection oven in the bakery pilot plant, to obtain the tilapia flour.
Six bread formulations were prepared according to the protocol described by Stokić et al. with slight modifications. The wheat flour replacement by TF was 0, 5, 10, 20, 30 and 40 percent, representing final bread formulations with 0, 2.5, 5, 10, 15 or 20 percent TF, which were termed BTF0%, BTF2.5%, BTF5%, BTF10%, BTF15%, and BTF20%, respectively. All ingredients were purchased in a local bakery-products store. After preparation, breads were packed in high density polyethylene bags, and immediately analyzed for nutritional and sensory characterization.
For detailed information on bread production; proximate composition, energy content, and total dietary fiber; consumer study; sample preparation; experimental procedure; and statistical analyzes, please refer to the original publication.
Results and discussion
The substitution of wheat flour by TF increased the lipid, protein, and ash contents (P < 0.05), and decreased (P < 0.05) the levels of carbohydrate and total dietary fiber (Table 1). BTF15% and BTF20% had the highest (P < 0.05) moisture content and the lowest (P < 0.05) energy value. No differences (P > 0.05) were observed in moisture contents and energy values among other tilapia-bread formulations at 0, 2.5, 5 and 10 percent. These results are strongly related to the wheat and tilapia flour compositions. TF has a low carbohydrate level (< 1.5 percent) and high levels of protein (> 45 percent), lipid (> 25 percent), and ash (> 3 percent), while the wheat flour counterpart contains higher levels of carbohydrate (> 75 percent) and fiber (> 10 percent), and lower levels of protein (< 11 percent), lipid (≤ 1.5 percent), and ash (≤ 0.38 percent).
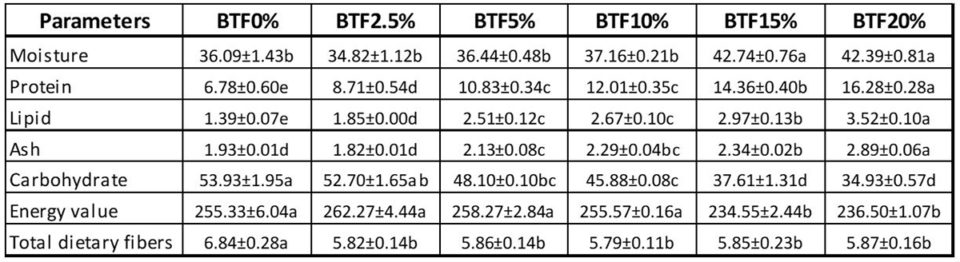
Although wheat flour (13.50 percent) has a higher moisture content than TF (7.84 percent), the results of this study reflect differences in protein conformation, amino acid composition and surface polarity/hydrophobicity (the physical property of a molecule to be ostensibly repelled from a mass of water) between wheat and fish, leading to different water-binding capacities. Our findings for energy value are attributable to changes in the lipid, protein and carbohydrate contents due to use of TF in substitution of wheat flour, together with their respective individual weights. Similar nutritional compositions of bread enriched with different protein sources were found by other researchers.
In terms of the results of the acceptance evaluation, BTF0%, BTF2.5% and BTF5% received the highest (P < 0.05) liking scores among samples, BTF10% and BTF15% received intermediate acceptance (P < 0.05), while BTF20% received the lowest (P < 0.05) overall liking score. No difference (P > 0.05) was observed among BTF0%, BTF2.5%, and BTF5% and between BTF10% and BTF15% for hedonic scores [most widely used scale for measuring food acceptability] related to overall liking. Similar to our results, other authors have also reported successful acceptance after addition of 5 percent fish protein concentrate in biscuits, shrimp protein hydrolysate at 5 to 7.5 percent in extruded products, and fish powder at 3 to 7 percent in snacks.
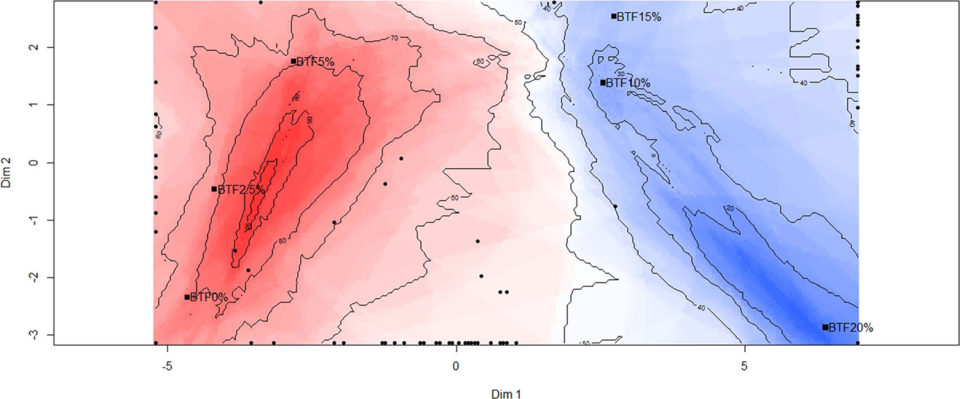
The internal preference mapping analysis revealed that the majority of the participants preferred the bread with 0 and 2.5 percent TF, followed by the formulation with 5 percent TF. Bread formulations with higher amounts of TF (10, 15, and 20 percent) were less preferred by participants, especially BTF20% (Fig. 1). The inclusion of high levels of fish sources in foodstuffs is problematic, due to the fishy flavor and odor generated mainly by free fatty acids and volatile sulfur compounds. Despite this, protein enrichment of commercial products may be advantageous, depending mainly on product processing, seafood type, and the proportion used. Similar consumer responses were reported by other authors for bread enriched varying inclusion levels of flour from various fish and from shrimp.
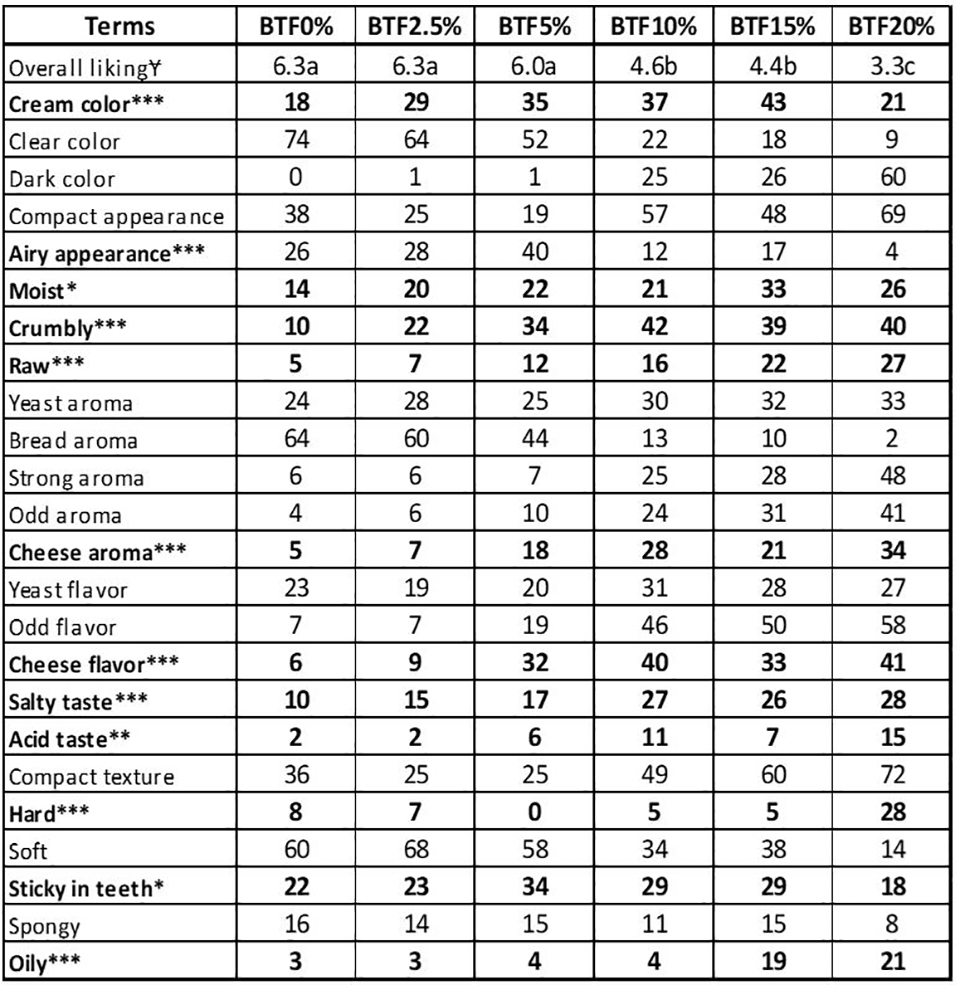
The tilapia flour in substitution of wheat flour changed the following 12 sensory attributes: cream color, moist, crumbly, salty taste, hard, raw, acid taste, sticky in the teeth, cheese flavor, oil, and cheese aroma (Table 2). The airy appearance was increased by small amounts of added tilapia flour (up to 5 percent) and decreased in formulations enriched with larger amounts (10, 15 and 20 percent).
The locations of the samples and terms can be seen in the first two dimensions in Fig. 2. The two dimensions explained 94.39 percent of the total variance (Dim 1: 83.50 percent and Dim 2: 10.89 percent) and separated the bread formulations into four groups (BTF0% and BTF2.5%; BTF5%; BTF10% and BTF15%; and BTF20%).
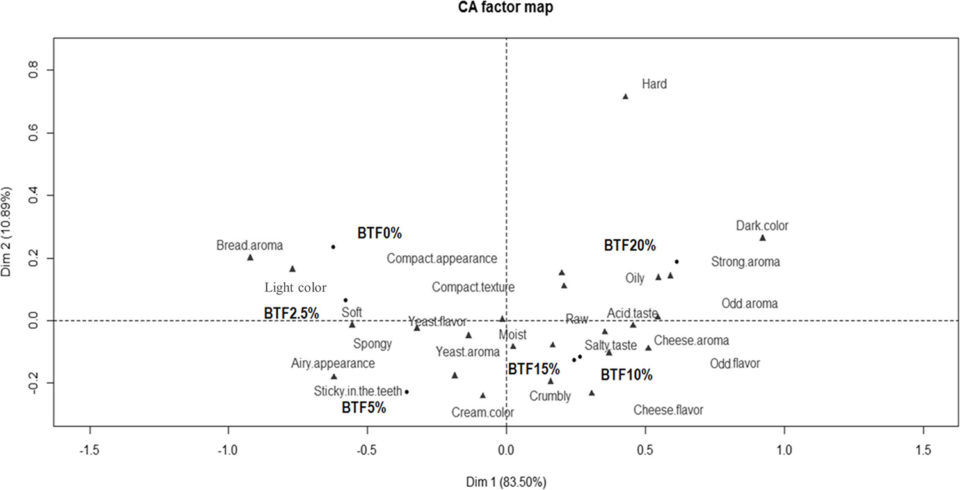
In our study, the perception of oiliness in bread with high levels of tilapia flour can be associated with the higher lipid content in tilapia flour compared to wheat flour, in accordance with our results for proximate composition. On the other hand, the consumers described bread containing more than 5 percent TF as compact in appearance and texture, raw, moist, crumbly, and hard, which may be related to a starch-protein interaction and a consequently reduced dough expansion. Likewise, aroma and flavor changes due to the TF added to bread – such as strong aroma, odd aroma, cheese aroma, salty taste, acid taste, cheese flavor, and odd flavor – can be attributed to several compounds from fish (e.g., free fatty acids and volatile sulfur compounds), which lend the fishy flavor and odor to products.
In addition, the color change in the enriched bread is due to color differences between the two flours, as TF is visually darker than wheat flour. Previous studies observed similar sensory changes in bakery products enriched with seafood sources. However, natural alternatives are currently available to enhance the quality of bakery products, such as texture enhancers (e.g., hydrocolloids) and flavoring agents (e.g., oleoresins and essential oils derived from spices).
Notably, the overall liking was positively driven by soft, airy appearance, spongy, bread aroma and light color, which were descriptive terms perceived for BTF0%, BTF2.5% and BTF5%. Overall, our findings suggest that wheat flour replacement by TF up to 10 percent was not enough to affect the sensory characteristics of the bread and did not compromise the overall liking.
Based on our findings, both levels of tilapia flour (12.17 and 6.86 percent) were enough to contribute to nutritional enrichment of bread. TF is easy to prepare, has good chemical stability at room temperature, and has a high nutritional value containing essential amino acids and fatty acids that are beneficial to human health. Also, fish flour is a low-cost raw material, and its use reduces environmental impact, representing a sustainable alternative for the commercial fishing industry.
Regarding consumer interest, the majority of the consumers (72 percent) stated that they were interested in eating bread with higher amounts of proteins and minerals. Today’s consumers require foods that are functional, convenient and healthy, which may explain the high interest in the bread with added TF. Reinforcing our findings, consumer demand is increasing for the fish matrix, more-sustainable foods, and ready-to-eat products, due to their high nutritional value, rapid preparation and extended stability during storage.
Therefore, based on our results, the substitution of wheat flour by TF (≤ 10 percent) resulted in a convenient, sustainable and healthy bread product with high nutritive value (more protein, ash, lipid, and reduced energy value) without perceptible sensory changes compared to traditional breads, thereby meeting the demand of the consumer market.
Perspectives
The replacement of wheat flour by TF improved the nutritional composition of the bread. Although replacement of wheat flour by TF at or above 20 percent have caused changes in sensory characteristics including appearance, aroma, flavor/taste, texture, and mouthfeel, our results show that lower replacement levels (5 percent and 10 percent) could be used without detrimental effects on overall liking.
In addition, our results indicate that the intention to consume and to purchase enriched bread can be maintained with levels < 12.17 percent and < 6.86 percent of TF, respectively.
Finally, the results suggest that bread fortified with TF at 5 percent can be a potential alternative for the food industry to satisfy the current nutritional and sustainability requirements of consumers.
References available from original publication.
Now that you've reached the end of the article ...
… please consider supporting GSA’s mission to advance responsible seafood practices through education, advocacy and third-party assurances. The Advocate aims to document the evolution of responsible seafood practices and share the expansive knowledge of our vast network of contributors.
By becoming a Global Seafood Alliance member, you’re ensuring that all of the pre-competitive work we do through member benefits, resources and events can continue. Individual membership costs just $50 a year.
Not a GSA member? Join us.
Authors
-

Department of Food Technology
University Federal Fluminense
Niterói, Rio de Janeiro, Brazil; and
Institute of Chemistry
University Federal of Rio de Janeiro
Rio de Janeiro, Brazil -
Department of Food Technology
University Federal Fluminense
Niterói, Rio de Janeiro, Brazil -
Department of Food Engineering
School of Agronomy, University Federal of Goiás
Goiânia, Brazil -
Embrapa Food Technology
Rio de Janeiro, Brazil -
Embrapa Food Technology
Rio de Janeiro, Brazil -
Department of Food Technology
University Federal Fluminense
Niterói, Rio de Janeiro, Brazil; and
Institute of Chemistry
University Federal of Rio de Janeiro
Rio de Janeiro, Brazil
Related Posts
Aquafeeds
Bridging the omega-3 gap with methane, microalgae
Innovation is leading to new ingredient options for renewable sources of omega-3 fatty acids. But Replicating long chain fatty acids is a tall order, Advocate contributor Lisa Duchene discovered.

Aquafeeds
Fly guys: Canada opens the door for insect-based feed companies
The sci-fi flick “The Fly” warned about mixing flies and technology, but high-tech black soldier fly farmers are seizing a real opportunity in aquaculture.

Aquafeeds
The pink powder that could revolutionize aquaculture
KnipBio, a Massachusetts-based biotechnology startup founded in 2013, is refining the manufacturing process for a promising aquaculture feed ingredient that may one day form the foundation of the food that farmed fish eat.
Aquafeeds
Animal byproducts can provide cholesterol for shrimp feed
Animal byproducts like blood meal, meat and bone meal and other rendered products are good sources of cholesterol for use in aquaculture feed.