


Water quality impacts on health and performance of fish and shrimp, Part 3: The nitrogenous compounds ammonia, nitrite and nitrate

Effective monitoring and management of ammonia, nitrite and nitrate are essential in intensive aquaculture systems, especially in low-water exchange ponds
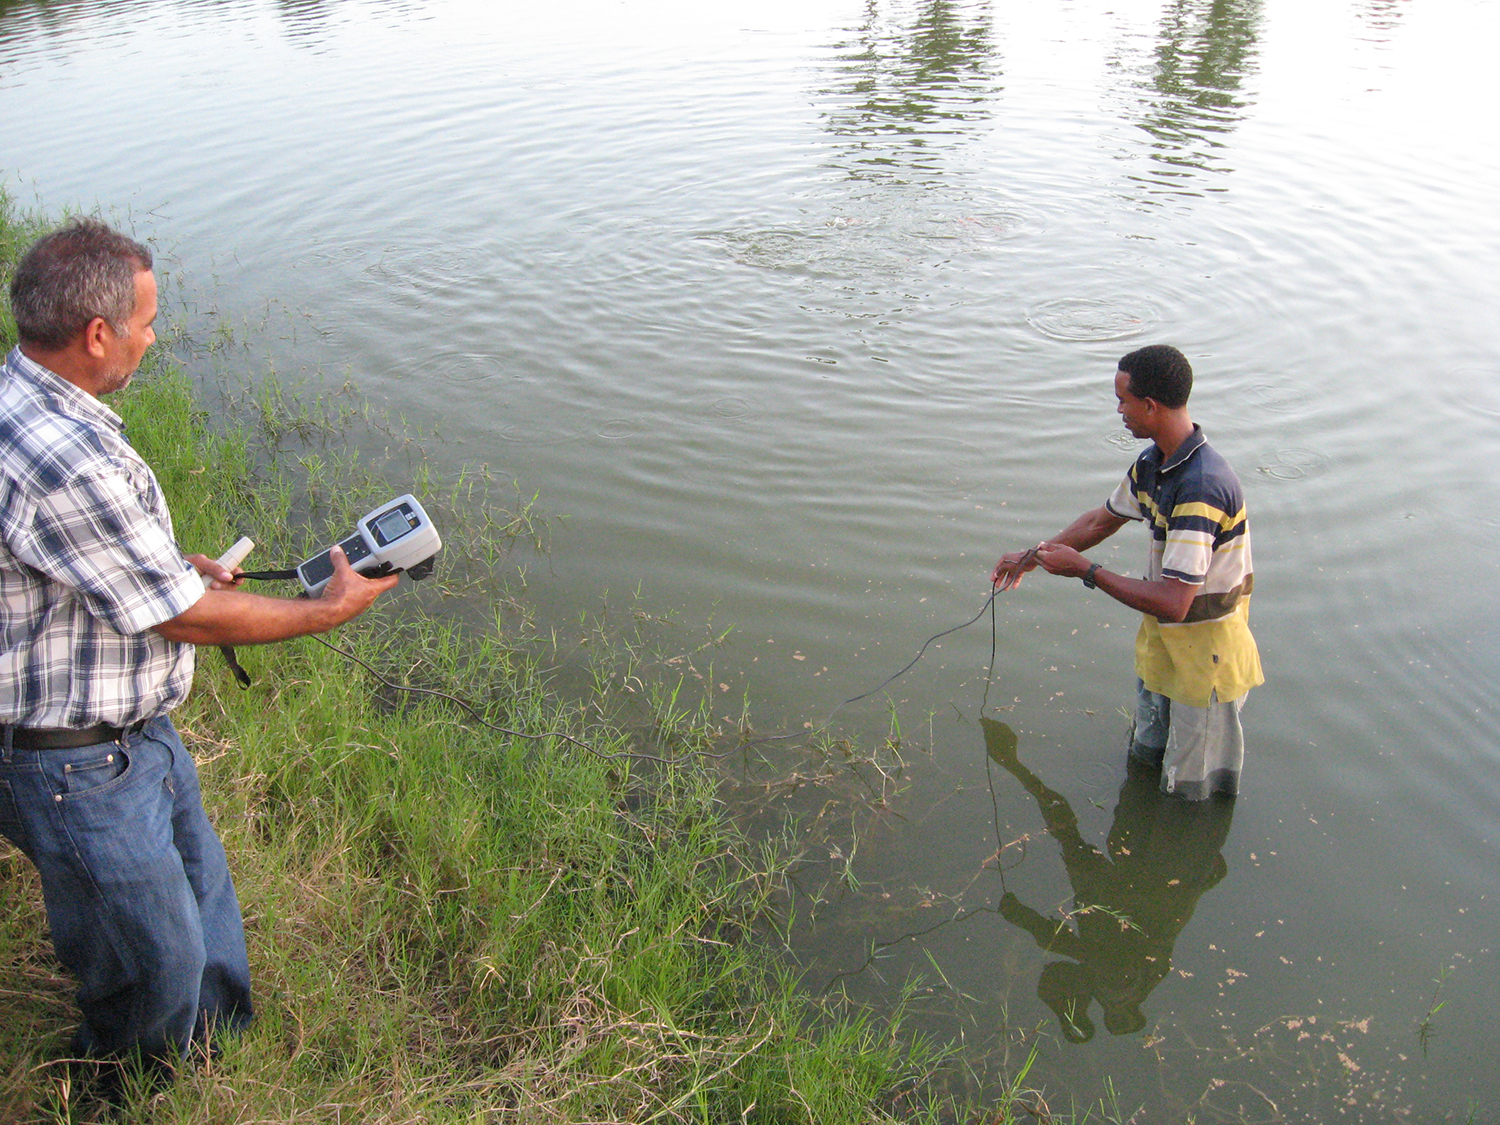
Ammonia (NH₃), nitrite (NO₂⁻), and nitrate (NO₃⁻) can accumulate and reach levels that impair the performance and health of aquatic animals and can even cause intoxication and death. Sub-lethal concentrations of ammonia and nitrite are common in intensive fish and shrimp production. The toxicity of these compounds depends on their concentrations, exposure time and interactions with environmental factors such as salinity, pH, dissolved oxygen, hardness and alkalinity. Understanding species-specific sensitivity, monitoring water quality and proper management practices are key to preventing problems associated with these nitrogenous compounds.
Editor’s notes: For references mentioned in the text without a link, contact the author directly. For the other parts of this series, see: Part 1 and Part 2.
Origin and recycling of ammonia, nitrite and nitrate
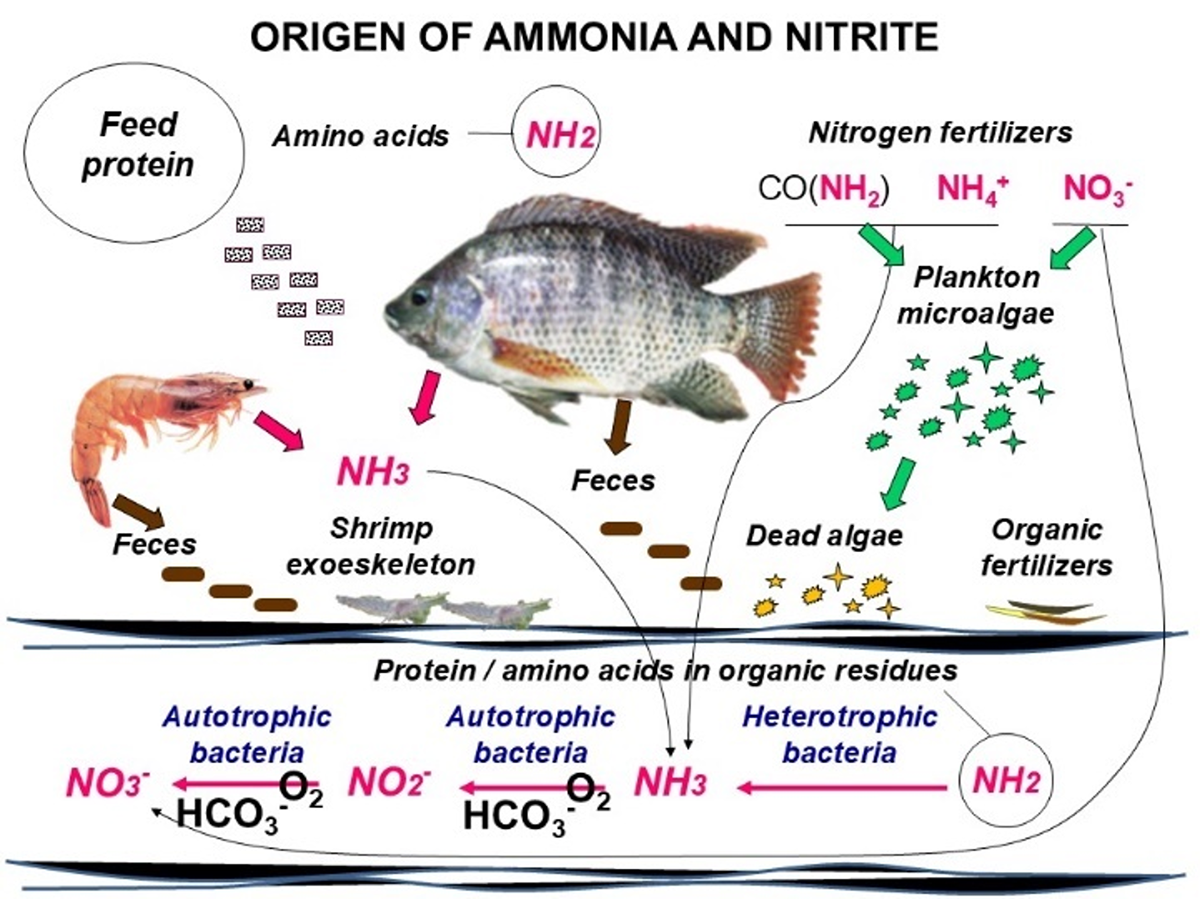
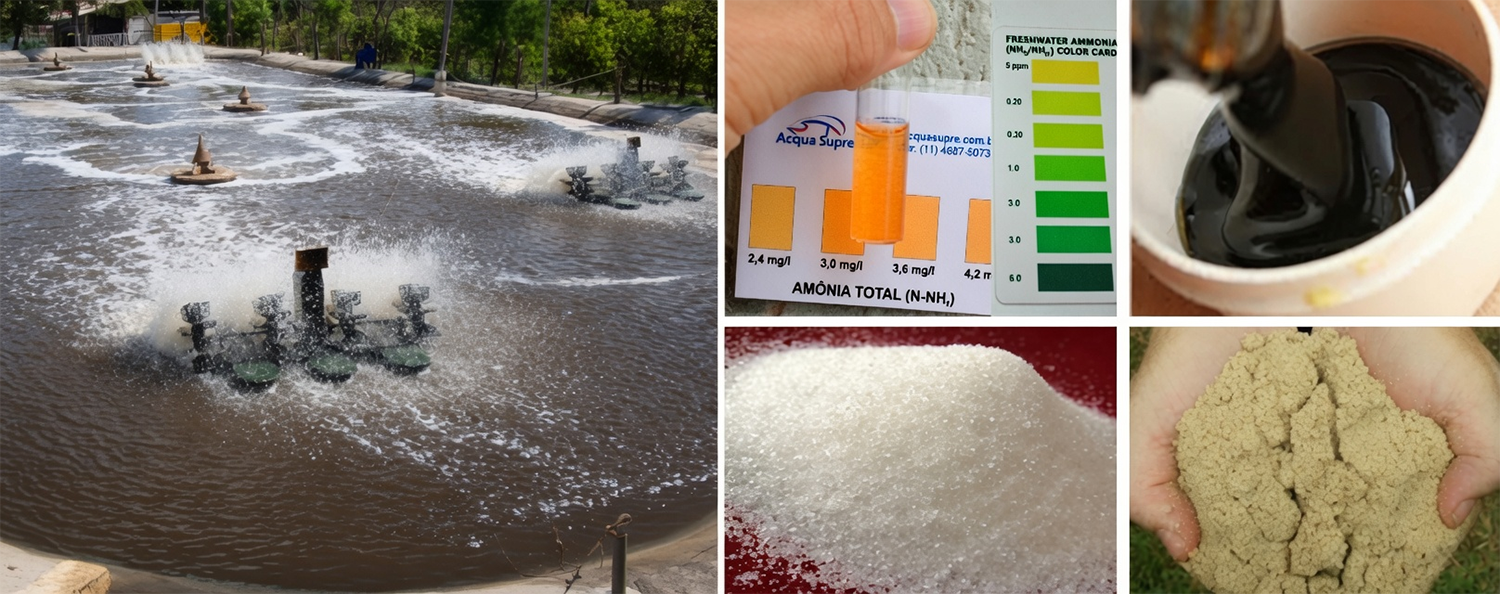
The main sources of ammonia in aquaculture ponds are: a) the fecal excretion and the metabolism of protein (amino acids, having this name for containing an amino group (NH2). Only 28 to 34 percent of feed protein is retained in fish and shrimp. Undigested protein and amino acids are excreted in feces. More than half of the absorbed amino acids are metabolized for energy, also generating ammonia, which must be quickly excreted from the blood or hemolymph, mainly through the gills; b) decomposition of protein/amino acids in organic wastes, such as decayed microalgae, uneaten feed, feces, shrimp exoskeleton, body mucus and organic fertilizers. Microbial decomposition occurs in the sediments of ponds and tanks; c) nitrogenous fertilizers containing ammonia, urea or nitrate (Fig. 1).
![Ad for [BSP]](https://www.globalseafood.org/wp-content/uploads/2025/07/BSP_B2B_2025_1050x125.jpg)
In green-water ponds, ammonia is quickly assimilated by phytoplankton. A minor fraction is oxidized to nitrite and nitrate by bacteria. In intensive fish and shrimp ponds at high feeding rates, ammonia production often surpasses phytoplankton and bacterial assimilation, requiring farmers attention. In recirculating aquaculture systems (RAS), ammonia mainly comes from metabolic excretion and decomposition of dissolved solids. Biofilters with nitrifying bacteria convert ammonia to nitrite and then nitrate. Although nitrate is less toxic, concentrations above 200–900 ppm can harm fish and shrimp. Therefore, biofilters must be properly designed to handle total ammonia or feed input. In biofloc systems (BFT), the bioflocs – aggregates of organic particles, and attached bacteria and other microorganisms – act similarly to RAS biofilters. Heterotrophic bacteria degrade organic waste and assimilate ammonia into microbial protein, while autotrophic bacteria oxidize ammonia to nitrite and nitrate.
Water pH regulates ammonia toxicity
Test kits measure total ammonia nitrogen (TAN) in water, the sum ammonium ion (NH₄⁺, less toxic) and ammonia gas (NH₃, highly toxic). The share of NH₃ (toxic form) on TAN increases with the increase in water pH (Table 1). Ammonia alters nerve impulses and muscle contraction in fish and shrimp. Nervous disorders, muscle, highly toxic). The share of NH₃ (toxic form) on TAN increases with the increase in water spasms, and erratic swimming are common signs of ammonia intoxication. Gills become irritated and the animals experience difficulty breathing even with adequate oxygen in the water.
Kubitza, Water Quality, Table 1
| 1Percent toxic ammonia (NH3) on TAN at 28 degrees-C | ||
|---|---|---|
| Water pH | Freshwater 0 ppt | Saltwater 36 ppt |
| 6.5 | 0.22 percent | 0.18 percent |
| 7 | 0.71 percent | 0.58 percent |
| 7.5 | 2.2 percent | 1.8 percent |
| 8 | 6.6 percent | 5.5 percent |
| 8.5 | 18.4 percent | 15.6 percent |
| 9 | 41.7 percent | 36.8 percent |
| 9.5 | 69.2 percent | 64.8 percent |
| 10 | 87. 7 percent | 85.4 percent |
Nitrite in water can exist as HNO₂ or NO₂⁻. At pH values above 5.5, HNO₂ is almost absent. In fish and shrimp culture, where water pH typically ranges from 6.0 to 10.0, nitrite toxicity results exclusively from the absorption of NO₂⁻ through the gills. Nitrite binds to hemoglobin and hemocyanin, preventing these blood proteins from transporting oxygen from the gills to other tissues.
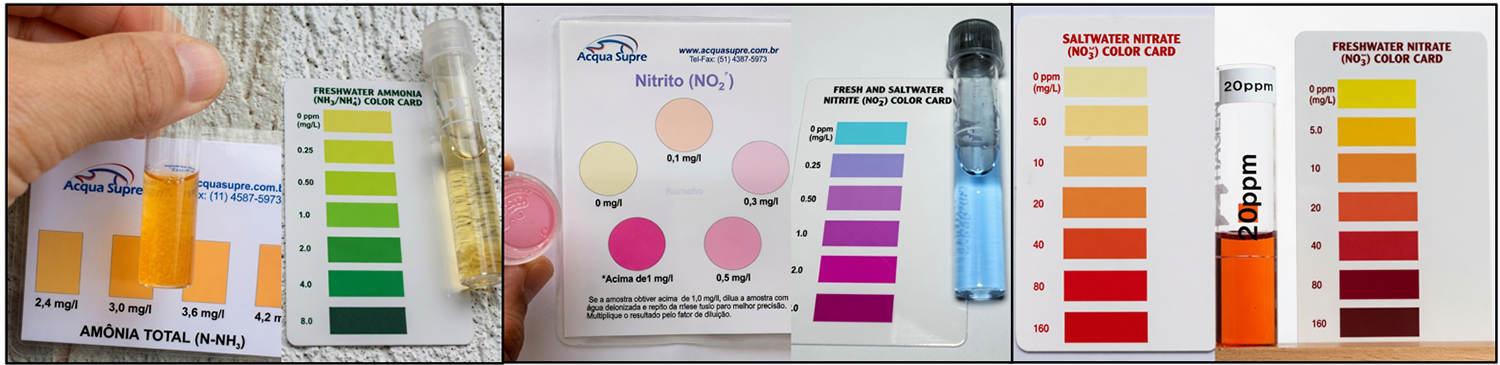
Commercial test kits for ammonia, nitrite and nitrate use colorimetric methods (Fig. 2) with accuracy suitable for aquaculture. When tested sample color matches or exceeds the highest value on the test color chart, the sample should be diluted with clean water (deionized or even rainwater) and retested until the tested sample color falls within the chart range. The final result must then be multiplied by the corresponding dilution factor.
Safe and toxic concentrations of ammonia, nitrite, and nitrate for fish and shrimp
Lethal concentrations of ammonia, nitrite, and nitrate that kill 50 percent of the animals after 96 hours of continuous exposure (referred to as LC50-96h) have been determined for several species of fish and shrimp (Table 2).
Kubitza, Water Quality, Table 2
| Species | mg/L N-NH3 | mg/L N-NO2- | mg/L N-NO3- |
|---|---|---|---|
| Nile tilapia | 1.4 - 2.6 (0.14) | 8 - 338 (0.8)(1) | ND (500) (4) |
| Channel catfish | 1.4 - 3.1 (0.14) | 7.1 (0.7) | 1,400 (140) |
| Common carp | 1.13 - 1.30 (0.11) | 20.0 (2.0) | 1,075 (107) |
| Rainbow trout | 0.08 - 0.9 (0.008) | 0.24 – 11 (0.024)(1) | ND (< 80)(4) |
| Pacific white shrimp | 0.6 - 2.8 (0.06) | 5.7 - 15 (0.57)(1) | ND (220) (4) |
| 76 - 321 (7.6)(3) | |||
| Black tiger shrimp | 0.96 - 1.08 (0.10) | 38 -171 (3.8) | 1,450-2,320 (145) |
(1) nitrite tolerance increases as chloride levels in the water rise. Lower tolerance occurs in waters with little chloride;
(2) salinities from 0.6 to 2 ppt. Nitrite tolerance increases with increasing water salinity;
(3) salinities from 15 to 35 ppt. Nitrite tolerance increases with increasing water salinity;
(4) ND = LC50-96h values not yet determined. The cautionary values inside brackets are suggested based on results from growth experiments with different nitrate levels.
Effect of ammonia on the performance and health of fish
For most warmwater farmed fishes, NH₃ of 0.1 to 0.2 mg/L (10 percent of the LC50-96h value) can be considered as a warning concentration. Above these limits there could be gill irritation and damage, respiratory impairment, and, consequently, reduced growth and immunity.
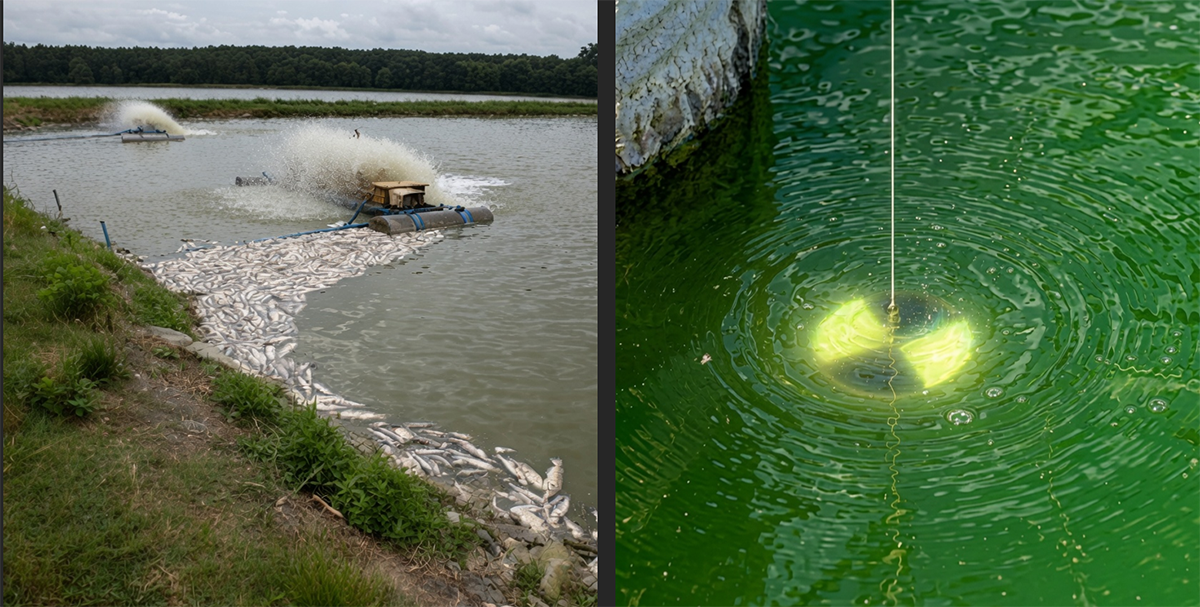
Toxic ammonia of 0.1 mg/L reduced weight gain of Nile tilapia by 28 percent (Table 3). Although tilapia can tolerate high ammonia concentrations, as seen in Table 2, toxic ammonia should not exceed 0.05 mg of NH3/L. At 28 degrees-C, the value of 0.05 mg NH₃/L corresponds to a total ammonia of 7 mg/L at pH 7.0, 0.76 mg/L at pH 8.0 or 0.12 mg NH₃/L at pH 9.0.
Kubitza, Water Quality, Table 3
| NH3 (mg/l) | Final weight (g) | Weight gain (g/fish) | Relative weight gain |
|---|---|---|---|
| 0.004 | 37.7 | 18.7 | 100% |
| 0.01 | 37.2 | 18.2 | 97% |
| 0.05 | 36.4 | 17.4 | 93% |
| 0.1 | 32.5 | 13.5 | 72% |
| 0.15 | 26.9 | 7.9 | 42% |
No increase in mortality was observed by Farmer et al. (2011) in juvenile channel catfish exposed to sublethal ammonia levels (0.43 mg N–NH₃/L) and challenged with the bacterium Flavobacterium columnare, as well as in juvenile Nile tilapia exposed to 0.37 mg N–NH₃/L and challenged with the bacterium Streptococcus agalactiae, as reported by Evans et al. (2006), compared to challenged fish that had not been previously exposed to ammonia. However, it is reasonable to believe that fish exposed to sublethal ammonia levels may be less tolerant to diseases, given the diversity of fish species and pathogens in aquaculture operations.
Effects of ammonia on the performance, health, and survival of marine shrimp
Marine shrimp are more sensitive to ammonia during younger life stages and in low-salinity waters. Ammonia LC50-24h was determined by Cobo et al. (2012) for Zoea 1 (0.6 mg NH3/L), Zoea 2 (1.5 mg/L), Zoea 3 (2.4 mg/L), Mysis 1 (2.8 mg/L), Mysis 2 (2.5 mg/L) Mysis 3 (2.6 mg/L), PL-1d (1.9 mg/L) and PL-22 mm (2.8 mg/L). Ammonia LC50-96h increased as salinity increased. For 22 mm Penaeus vannamei, Lin and Chen (2001) reported 1.2 mg NH3/L at salinity of 15 ppt, and about 1.6 mg/L at 25 e 35 ppt. For 22 mm Litopenaeus schimitti, Barbieri (2010) reported 0.7 mg NH3/L at 5 ppt, 0,9 at 20 ppt and 1.2 mg/L at 35 ppt.
Toxic ammonia concentrations starting from near 0.1 mg/L resulted in reduced growth of Penaeus chinensis (Table 4). The growth of shrimp after 10 days of continuous exposure to 0.5 and 0.7 mg/L toxic ammonia was only 47 percent of the growth observed in animals at the control group (zero ammonia). Therefore, for marine shrimp it is recommended to set a threshold limit of 0.1 mg NH3/L.
Kubitza, Water Quality, Table 4
| Total ammonia (TAN-mg/L) | Toxic ammonia (NH3 – mg/L) at pH 8.4 | 10-d growth in length (mm) | Relative growth (%) |
|---|---|---|---|
| Control | Nearly zero | 11.5 | 100 |
| 0.6 to 2 | 0.07 to 0.22 | 7 | 61 |
| 5.0 a 7 mg/l | 0.55 to 0.77 | 5.4 | 47 |
| 14.0 mg/l | 1.5 | 2.6 | 23 |
P. vannamei (9 grams weight) had a significant reduction in hemocyte count and in the activity of the enzymes PO (phenoloxidase) and SOD (superoxide dismutase) when exposed for 48 hours to sublethal toxic ammonia concentrations of 0.1 or 0.5 mg N–NH₃/L (Table 5). Hemocytes and the enzymes PO and SOD play an important role in the shrimp’s defense mechanisms and resistance to pathogens.
Kubitza, Water Quality, Table 5
| Hemolymph | Hepatopancreas | Survival | |||||
|---|---|---|---|---|---|---|---|
| (U/mg protein) | (U/mg protein) | (%) | |||||
| N-NH3 | THC | PO | SOD | PO | SOD | 5 ppt | 30 ppt |
| 0.001 mg/l | 78 | 0.68 | 1.45 | 17.8 | 7.1 | 100% | 100% |
| 0.1 mg/l | 43 | 0.46 | 0.95 | 10.4 | 4.7 | 100% | 100% |
| 0.5 mg/l | 32 | 0.44 | 0.7 | 7.2 | 4 | 86% | 95% |
P. vannamei kept in water with total ammonia concentrations from 5 to 22 mg/L (toxic ammonia from 0.28 to 1.14 mg N-NH3/L) were immune-suppressed and presented higher mortality (40 to 50 percent) after an experimental infection with Vibrio alginolyticus, compared to 20 to 23 percent mortality for shrimp kept in water with 0 to 0.06 mg N-NH3/L. Liu and Chen (2004) reported that shrimp kept at 22 mg/L total ammonia (1.14 mg N-NH3/L) and not injected with V. alginolyticus showed zero mortality.
In intensive shrimp pond aquaculture, the total ammonia concentration rarely exceeds 3 mg/L. However, in ponds with high feeding rates (above 150 to 200 kg of feed/ha/day) and low water renewal, total ammonia concentrations can reach 6 to 8 mg/L. At these concentrations, shrimp will certainly be exposed to toxic ammonia of at least 0.33 to 0.44 mg/L in saltwater with pH 8.0. If the pH increases to 9.0 due to photosynthesis, toxic ammonia concentrations could exceed 2.3 mg/L. Such high levels of NH3 not only harm growth but can also reduce shrimp resistance to pathogens and even cause death.
Effects of nitrite on the performance, health, and survival of fish
Nitrite entering the blood binds to hemoglobin and oxidizes iron (Fe²⁺ → Fe³⁺), forming methemoglobin. In shrimp, hemocyanin likely undergoes a similar oxidation of copper. Once bound to nitrite, hemoglobin and hemocyanin can no longer transport oxygen to tissues and organs. Nitrite toxicity in fish can be assessed by methemoglobin levels. According to Boyd (Boyd, C. E. 1990. Water Quality in Ponds for Aquaculture. Auburn, AL: Auburn University, Alabama Agricultural Experiment Station. 482 pp.), channel catfish exposed for 24 h to 1 mg N–NO₂⁻/L showed 21 percent methemoglobin, rising to 60 percent at 2.5 mg N–NO₂⁻/L. Respiratory stress may occur above 5 percent, clear toxicity at 20–30 percent, and mortality above 50 percent methemoglobin, especially under low oxygen. Methemoglobin also causes “chocolate blood,” visible in the gills or blood from a cut in the caudal peduncle. In freshwater, chronic exposure to 0.3–0.5 mg/L nitrite can reduce fish growth and disease resistance. Chloride ions reduce nitrite toxicity, so tolerance increases with salinity. Toxic levels for tilapia, other farmed fish, and marine shrimp are shown in Tables 6 and 7.
Nile tilapia is highly tolerant to nitrite. In 4-gram fish, LC50-96h increased from 81 to 338 mg/L N-NO₂⁻ as chloride rose from 6 to 375 mg/L (Table 6), because chloride competes with nitrite for gill receptors and reduces uptake. In intensive ponds with high feeding and low water exchange, adding sodium chloride (sea salt) can help prevent toxicity. Recommended Cl⁻:NO₂⁻ ratios are 6–10:1 (some suggest 20:1 for safety). Salt dosage can be estimated using this equation proposed by Boyd (1991): Salt (g/m³) = [(6–10) × (NO₂⁻ mg/L – Cl⁻ mg/L)] ÷ 0.6. For example, if nitrite may reach 5 mg NO₂⁻/L in freshwater, about 83 g salt/m³ is needed; a 1,500 m³ pond would require ~125 kg salt, raising salinity by only 0.08 ppt, enough to reduce nitrite risk.
Kubitza, Water Quality, Table 6
| LC50-96h (mg/L) | |||||||
|---|---|---|---|---|---|---|---|
| Species | Wt. g | NO2- | N-NO2- | Cl- | References | ||
| Nile tilapia | 4.4 | 270 | 81 | 6 | Atwood et al 2001 | ||
| 90.7 | 27 | 8 | ND | Atwood et al 2001 | |||
| 4.4 | 1,127 | 338 | 375 | Atwood et al 2001 | |||
| 1.8 | 94 | 28.2 | 35 | Yanbo et al 2006 | |||
| 1.8 | 149 | 44.7 | 70 | Yanbo et al 2006 | |||
| Channel catfish | 24 | 7.1 | ND | Palachek and Tomasso 1984 | |||
| Largemouth bass | 467 | 140.2 | ND | Palachek and Tomasso 1984 | |||
Effects of nitrite on the performance, health, and survival of shrimp
For the marine shrimp L. vannamei, LC50-96h values are < 12 mg N-NO₂⁻/L at 2 ppt salinity and higher than 75 mg N-NO₂⁻/L above 15 ppt salinity (Table 7). Using 10 percent of LC50-96h as a safe level, warning thresholds range from 0.6 mg N-NO₂⁻/L (≤ 1 ppt) to 32 mg N-NO₂⁻/L (35 ppt). Higher chloride concentrations reduce nitrite absorption, so problems are rare above 20 ppt, but common in low-salinity systems, especially in deeper ponds with anaerobic sediments and poor circulation, and in RAS or BFT systems at 2–5 ppt.
Kubitza, Water Quality, Table 7
| Salt (ppt) | Weight (g) | LC50-96h mg N-NO2-/L | Attention limit mg N-NO2-/L | References |
|---|---|---|---|---|
| 0.6 | 4.4 | 5.7 | 0.6 | Ramírez-Rochín et al 2017 |
| 1 | 4.4 | 7 | 0.7 | |
| 2 | 4.4 | 12.4 | 1.2 | |
| 10 | 0.7 | 8.4 | 0.8 | Sowers et al 2004 |
| 2 | 0.2 | 8.9 | 0.9 | Gross et al 2004 |
| 3 | 0.6 | 15.2 | 1.5 | Wang et al 2006 |
| 15 | 3.9 | 76.5 | 7.6 | Lin and Chen (2003) |
Furtado et al. (2016) reported that sublethal nitrite concentrations can cause severe reduction in growth and survival of marine shrimp. In water with 5 mg/L or higher N-NO₂⁻ P. vannamei had lower hemocyte counts and reduced phenoloxidase – PO (two key components of immune response) compared to shrimp exposed to 1 mg or less N-NO₂⁻/L, according to Tseng and Chen (2004). In the same study, shrimp injected with Vibrio alginolyticus and transferred to tanks with 5 mg/L or higher N-NO₂⁻ had higher cumulative mortality post-infection compared to shrimp transferred to water with up to 1 mg/L N-NO₂⁻.
Effects of nitrate on the performance, health, and survival of fish and shrimp
Nitrate (NO₃⁻) is far less toxic than ammonia or nitrite. For most fish and crustaceans, ≤25 mg N-NO₃⁻/L is acceptable, while >100 mg N-NO₃⁻/L requires attention. Nile tilapia is highly nitrate-tolerant, but juveniles exposed to 1,000 mg N-NO₃⁻/L showed 29 percent lower weight gain, 56 percent lower feed efficiency, and increased blood nitrite and methemoglobin compared with fish reared at ≤500 mg/L. Researchers concluded nitrate should remain below 500 mg N-NO₃⁻/L in intensive tilapia RAS. Safe and lethal levels for fish and shrimp are listed in Table 2. Rainbow trout reared at 80–100 mg N-NO₃⁻/L did not show reduced growth but displayed abnormal swimming behavior compared with fish kept at 30 mg/L.
Pacific white shrimp exposed to 400–900 mg N-NO₃⁻/L showed reduced growth and survival, antenna shortening, hepatopancreas lesions, and gill abnormalities (Table 8). Increasing salinity from 2 to 18 ppt reduced nitrate impacts at 440 mg/L. Similarly, 150–600 mg N-NO₃⁻/L in BFT systems caused gill and hepatopancreas damage and reduced growth, feed efficiency, and survival of P. vannamei (Table 9).
Kubitza, Water Quality, Table 8
| mg/l N-NO3- | Survival (percent) | Final wt. (g) | Antenna length (cm) |
|---|---|---|---|
| 35 | 87 | 9.3 | 8.5 |
| 220 | 87 | 8.7 | 7.2 |
| 435 | 64 | 7.5 | 5.1 |
| 910 | 15 | 5 | 2 |
Kubitza, Water Quality, Table 9
| mg/L N-NO3- | Survival (percent) | Final wt. (g) | FCR | Antenna length (cm) |
|---|---|---|---|---|
| 75 | 100 | 6.07 | 1.5 | 5.68 |
| 150 | 87 | 5.97 | 1.6 | 4.86 |
| 300 | 77 | 4.89 | 3 | 2.52 |
| 600 | 71 | 3.94 | 4.34 | 2.03 |
Management practices to prevent problems with nitrogenous compounds
Ammonia, nitrite, and nitrate must be closely monitored in intensive fish and shrimp systems. In intensive ponds with high feeding rates, ammonia and nitrite should be tested weekly. In recirculating aquaculture systems (RAS) and biofloc technology (BFT), they should be checked every other day until stable, then once or twice weekly. Nitrate should be measured weekly. In RAS, test before and after the biofilter or plant beds to evaluate nitrification efficiency.
General prevention practices include the following: use of high-quality, digestible feeds and avoid overfeeding; monitor and correct water alkalinity; ensure adequate aeration and water circulation; and increase chloride with salt, when possible, to reduce nitrite toxicity.
In intensive ponds: keep biomass and feeding within safe limits compatible to mechanical aeration and water-exchange capacity; control phytoplankton blooms (especially cyanobacteria) to avoid the occurrence of higher pH and oxygen deficit. Maintain night aeration and daytime water circulation using mechanical aerators. In freshwater ponds with low exchange, add salt to raise chloride; and limit the use of nitrogen fertilizers or manure.
In RAS: respect safe feeding rates; ensure efficient solid removal; design biofilters with enough surface area to oxidize all ammonia; maintain adequate oxygen, pH, and alkalinity for nitrifying bacteria; add chloride (salt or calcium chloride) to prevent nitrite toxicity; and keep nitrate below 100 mg NO₃⁻-N/L using water exchange, denitrification, or aquatic plants.
In BFT systems: add carbon sources (e.g., molasses, sugar, rice bran, wheat flour) as needed to stimulate initial biofloc formation and reduce TAN; allow microbial communities to mature before full feeding; keep flocs in suspension; monitor and correct alkalinity and pH; control excess solids with settling tanks; reuse mature water for stability; increase chloride to prevent nitrite toxicity; and maintain nitrate below 100–200mg NO₃⁻-N/L through exchange, denitrification, or plant uptake.
Perspectives
Effective monitoring and management of ammonia, nitrite, and nitrate are essential in intensive aquaculture systems – especially in low-exchange ponds and in RAS or BFT. Maintaining proper water quality prevents growth losses, reduced feed efficiency, disease outbreaks and mortality associated with elevated nitrogenous compounds.
Now that you've reached the end of the article ...
… please consider supporting GSA’s mission to advance responsible seafood practices through education, advocacy and third-party assurances. The Advocate aims to document the evolution of responsible seafood practices and share the expansive knowledge of our vast network of contributors.
By becoming a Global Seafood Alliance member, you’re ensuring that all of the pre-competitive work we do through member benefits, resources and events can continue. Individual membership costs just $50 a year.
Not a GSA member? Join us.
Author
-
Jundiaí, São Paulo, Brazil
Dr. Fernando Kubitza is a Brazilian aquaculture specialist, founder and director of Acqua Imagem Services in Aquaculture (www.acquaimagem.com.br), a 26-years old company leading on aquaculture projects, training and technical support in Brazil.
Related Posts
Responsibility
A comparison of resource use in shrimp farming, part 1: Land
Prof. Boyd discusses land use in shrimp farming in the five major exporting countries of farmed shrimp: Ecuador, India, Indonesia, Thailand and Vietnam.
Responsibility
A comparison of resource use in shrimp farming, part 2: Water
In part two of this series, the authors suggest steps to reduce the pollution potential of shrimp farming by paying special attention to uneaten feed.
Responsibility
A comparison of resource use in shrimp farming, part 3: Energy
In part three of this series, the authors say lower energy use in shrimp farming requires producers to focus on water exchange and aeration.
Health & Welfare
Proper water circulation in aquaculture ponds critical
Promoting water circulation during the day time is an effective strategy to enrich pond water with oxygen produced by photosynthesis, and can significantly reduce the costs of night time supplemental aeration.