Vegetable-based trout feed boasts lower waste loads
West Virginia University trial compares two ‘high energy’ diets
In order to reduce pollutant loads nationwide, the United States Environmental Protection Agency has developed new effluent management standards and criteria for private and public aquaculture operations. Further, legislation against stream degradation and total maximum daily load limits are considered emerging issues of concern to aquaculture operators.
Currently, typical waste management practices in aquaculture systems are focused on clarifying water for reuse or to meet effluent discharge standards. However, with the implementation of new stream regulations, coupled with the expansion of the industry, operators must place emphasis not only on solids removal through clarification, but also reducing solid waste generation and dissolved pollutant loading.
Feed is the main direct and indirect source of pollutants in aquaculture waters. For instance, the typical retention of nitrogen and phosphorus in fish is only about 30 percent if all the feed is consumed. The uneaten feed and metabolic byproducts (fish fecal matter) result in both dissolved and suspended waste products in the effluent and settled sludge.
Feed test
The authors recently conducted a study at West Virginia University’s experimental aquaculture raceway system in Monongalia County, West Virginia, USA, that focused on two commercial rainbow trout diets from waste management and productivity points of view. The “high-energy” diets differed mainly by the source of protein. Diet A was a traditional fishmeal diet, while diet B was a vegetable-based feed.
Diet A, a “standard formulation for trout production,” was comprised of fishmeal, wheat, feather meal, fish oil, and other ingredients. It was reported to have high protein digestibility to maximize feed conversion and limit waste production. Additionally, the manufacturer claimed the diet would produce average fat contents in fish flesh, while releasing low levels of nitrogen and phosphorus in the effluent water.
Diet B, recommended for trout in the parr-smolt stages, was comprised of grain byproducts, plant protein byproducts, vegetable oils, fish oil, and other ingredients. The manufacturer of diet B claimed the diet was high in vitamins and minerals to promote growth of the skeletal system, and amino acids to promote muscle growth and minimize fat deposits.
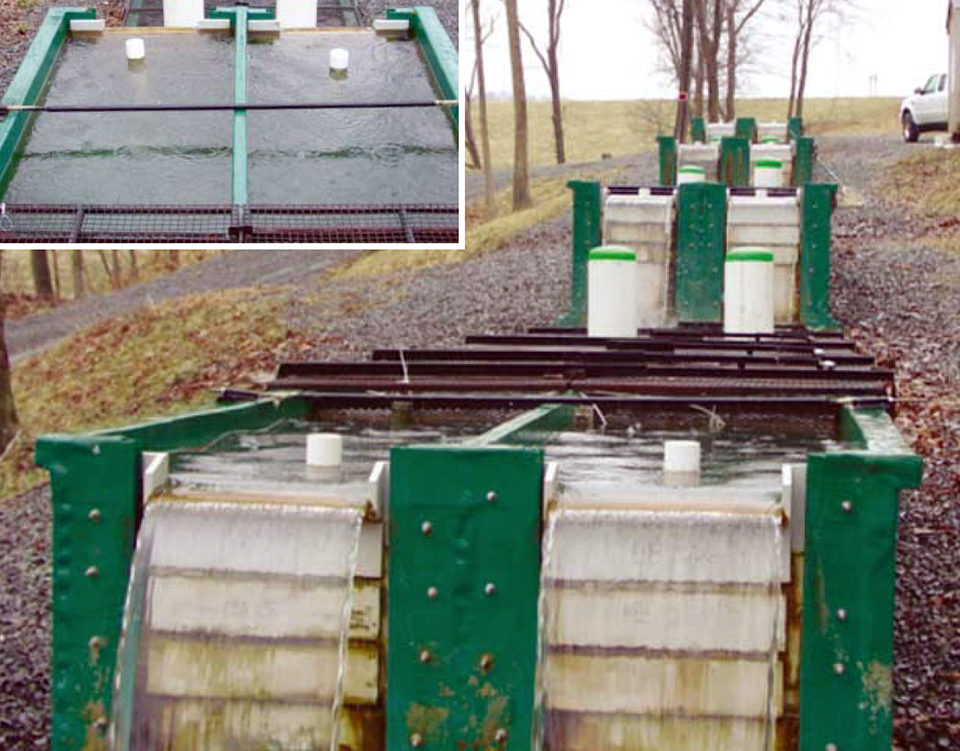
Experimental system
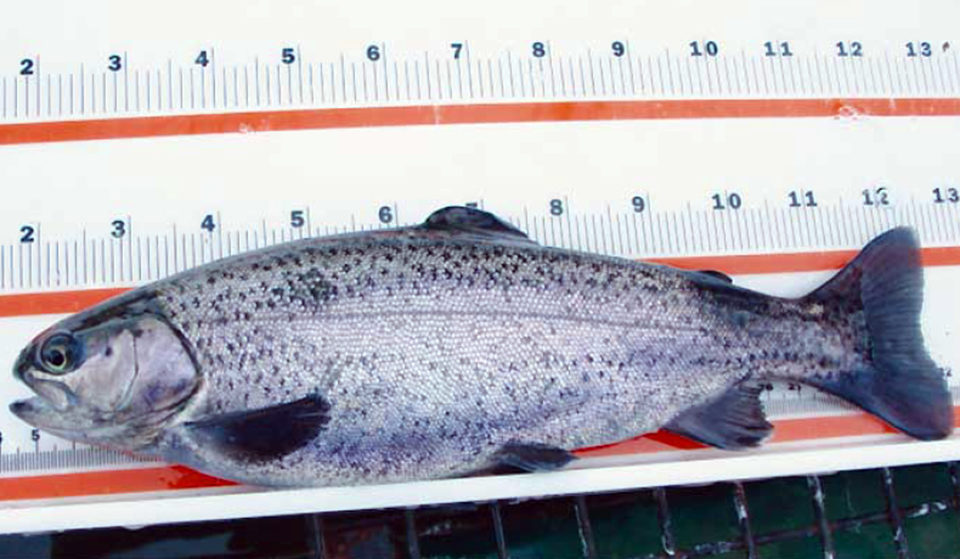
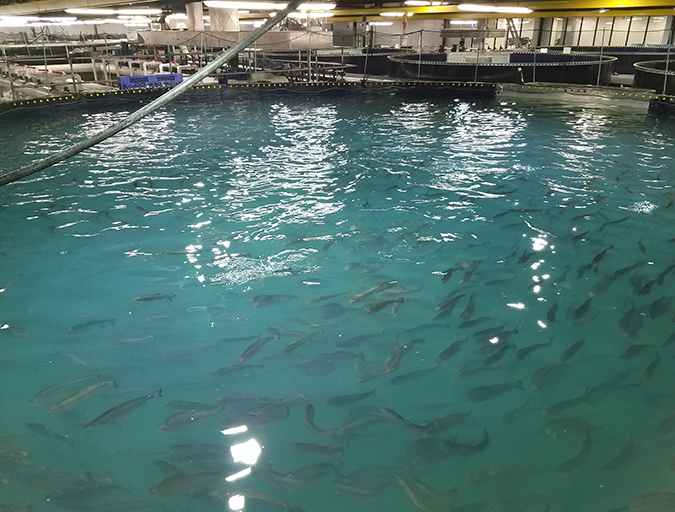
The experimental aquaculture system was comprised of two parallel flow-through raceway channels on four discrete levels, where each of the eight rearing segments was 7.3 meters long, 0.91 meters wide, and 1.07 meters deep. Waste was collected in 1.82-meter long quiescent zones at the end of each segment. One thousand fingerling rainbow trout averaging 0.09 kg in weight were stocked in each segment of the upper three levels in October 2003 and grown until June 2004, when the fish reached market size of about 454 grams, or one pound.
The fish were fed daily to satiation by hand and using demand feeders. Data on feed quantity, feeding response, water temperature, and mortalities was recorded. In addition, water quality and fish productivity data was collected on a monthly basis. Solid waste that accumulated in the quiescent zones was sampled and analyzed to characterize important parameters related to waste management.
Results
As the seasons changed, the quiescent zones were sampled five times during grow-out to represent different water temperatures and associated feeding regimens. Though many factors contribute to the productivity of fish in an aquaculture facility, the fish fed diet A had nominally better growth and feed conversion, and fewer mortalities than those that received diet B. There were, however, marked differences in the character of sludge produced from the different feeds.
For example, on average throughout the study, diet B produced a smaller quantity of solids and proportionately less pollutants (Table 1). Though the total quantity of each feed applied differed by 2 kilograms per day, on average, the pollutant load to the receiving stream for several types of organic waste was more than 50 percent greater for the segments treated with diet A than the segments fed diet B.
Tierney, Mean analysis of waste, Table 1
| Diet A | Diet B | |
|---|---|---|
| Feed mass (kg/day) | 15 | 13 |
| Total solids (g/day) | 398 | 261 |
| Total suspended solids (g/day) | 141 | 70 |
| Settleable solids (ml/day) | 2,788 | 1,904 |
| Five-day biochemical oxygen demand (g/day) | 79.4 | 39.7 |
| Total nitrogen (mg/day) | 244 | 103 |
| Total phosphorus (mg/day) | 2,035.5 | 842.4 |
With the impending implementation of stricter pollution regulations, such information can help managers make informed decisions regarding waste and effluent management. However, additional assessments are needed to further correlate production with waste characteristics before definitive recommendations on the waste production potential of a particular diet can be made.
(Editor’s Note: This article was originally published in the June 2005 print edition of the Global Aquaculture Advocate.)
Now that you've reached the end of the article ...
… please consider supporting GSA’s mission to advance responsible seafood practices through education, advocacy and third-party assurances. The Advocate aims to document the evolution of responsible seafood practices and share the expansive knowledge of our vast network of contributors.
By becoming a Global Seafood Alliance member, you’re ensuring that all of the pre-competitive work we do through member benefits, resources and events can continue. Individual membership costs just $50 a year.
Not a GSA member? Join us.
Authors
-

West Virginia University
Department of Civil and Environmental Engineering
P.O. Box 6103
Morgantown, West Virginia 26506-6103 USA -
West Virginia University
Department of Civil and Environmental Engineering
P.O. Box 6103
Morgantown, West Virginia 26506-6103 USA
Related Posts
Responsibility
A helping hand to lend: UK aquaculture seeks to broaden its horizons
Aquaculture is an essential contributor to the world food security challenge, and every stakeholder has a role to play in the sector’s evolution, delegates were told at the recent Aquaculture’s Global Outlook: Embracing Internationality seminar in Edinburgh, Scotland.
Health & Welfare
A holistic management approach to EMS
Early Mortality Syndrome has devastated farmed shrimp in Asia and Latin America. With better understanding of the pathogen and the development and improvement of novel strategies, shrimp farmers are now able to better manage the disease.
Intelligence
A land grab for salmon (and shrimp) in upstate New York
The operators of Hudson Valley Fish Farm see their inland locale as a pilot to prove that land-based fish farming, located in close proximity to major metropolitan markets, can be successful.
Aquafeeds
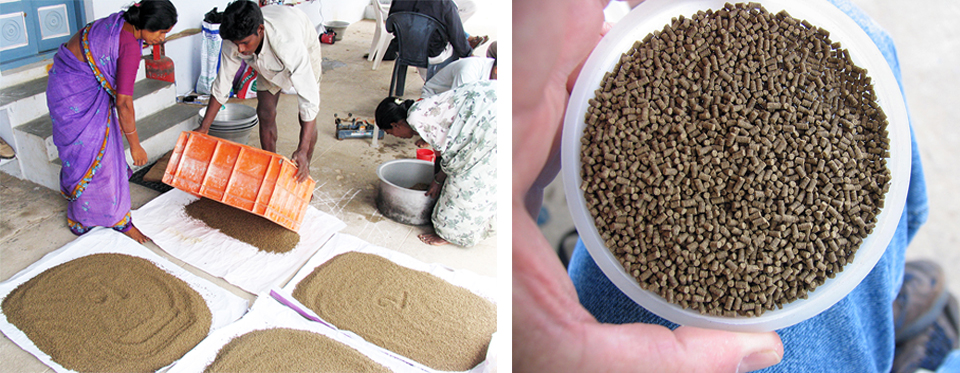
A look at India’s fish feed industry
India's fish-farming industry makes limited use of modern feeds, providing potential for the feed sector to grow. Commercial feeds are predominantly used for pangasius farming, followed by a rising popularity in carp culture.