Quality parameters in farmed Atlantic salmon
Studies evaluate pigment levels, lipid composition and flavor, color
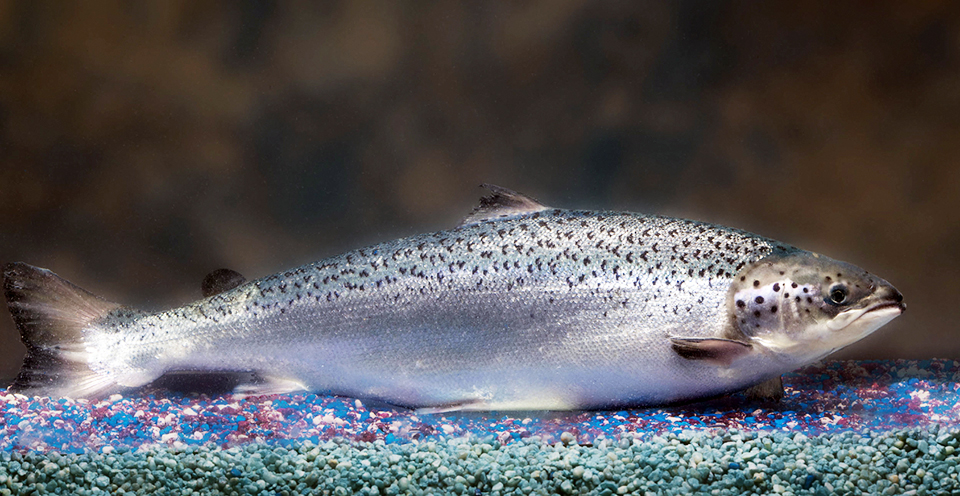
The quality and composition of wild salmon can be extremely variable depending on life stage, environmental factors, and dietary variations. By exploiting this variability, farm managers can produce salmon that rival or surpass their wild cousins in terms of consumer acceptability, flavor, texture, and nutritional value.
Changes during maturation
During the life cycle of salmon and other fish species, quality can change dramatically. As maturation approaches, fish producers have a substantially different product with a recognizably altered eating quality.
In a Norwegian study, 39-month-old salmon were sampled monthly from April to December to monitor quality changes. Maturing females were found to lose weight beginning in July, and maturing males also had weight reduction during maturation. External sexual characteristics appeared as early as May.
Changes in the skin color of the maturing fish occurred in July and August. From June to December, the fat content of the animals’ fillets decreased from about 12 to 5 percent, the protein content decreased from 22 to 19 percent, and the water content increased from about 66 to 74 percent.
The red pigmentation in fillets from maturing fish decreased progressively from a color score of 7 on an eight-point scale in August to a score of 2 by October, while immature fish stayed at 7. From August to December, the odor of the fish deteriorated, the flavor changed from “very good” to “slight taste,” and the texture went from “filamentous” to “soft.” During the same time period, the immature fish demonstrated no deterioration in sensory changes.
Composition
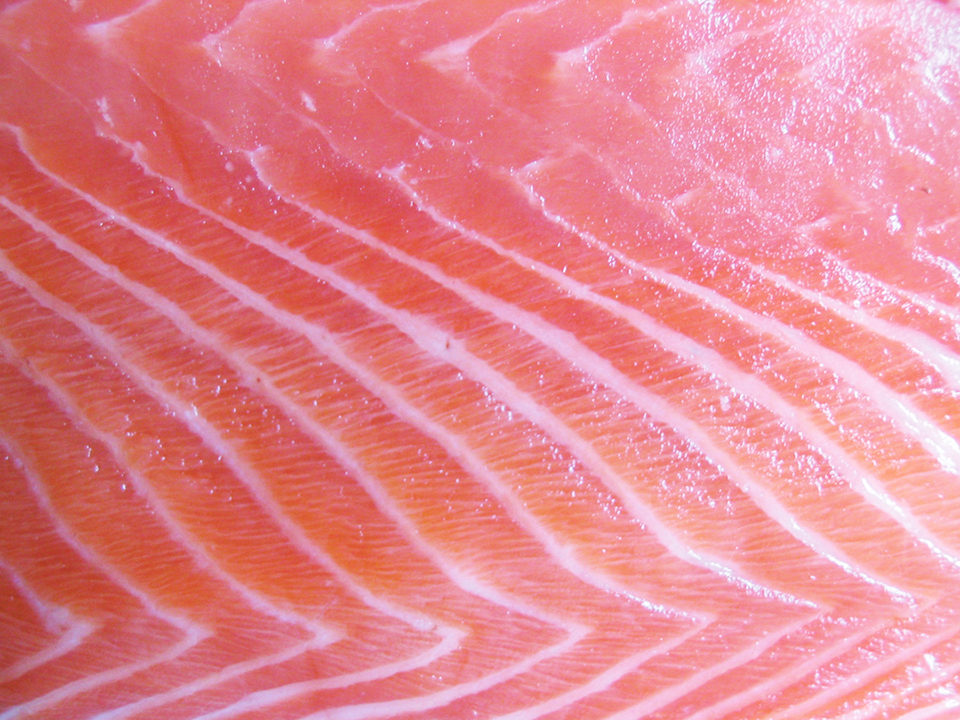
In Scotland, evaluations of wild and farmed fish obtained from commercial sources over a two-year period showed higher total carotenoid pigment concentrations in farmed salmon (8.43 milligrams per kilogram wet flesh) than wild fish (6.44 milligrams per kilogram flesh). However, the average flesh color was similar for all the fish.
At 12.5 percent, the flesh lipid content was 84 percent higher in farmed fish. Vitamin E concentrations were similar in wild and farmed salmon. A shear test and texture analysis found significantly firmer texture in fillets from the wild fish.
In a study in Quebec, Canada, fatty acid composition was studied in harvested wild and farmed Atlantic salmon. Results showed that the lipid contents of the farmed and wild salmon were similar.
The difference in the results from these two studies could be attributed to environmental differences, stock strain variations, or a difference in feed composition. In the Canadian study, total omega-6 highly unsaturated fatty acids (HUFAs), omega-6 polyunsaturated fatty acids (PUFAs), and linoleic acid in the farmed salmon were two, four, and six times higher, respectively, than in wild salmon.
Total omega-3 PUFAs, alpha-linolenic acid, and eicosapentaenoic acid were also significantly higher in farmed salmon than in wild salmon, whereas concentrations of docosahexaenoic acid and omega-3 HUFAs were similar. The ratio of omega-3 to omega-6 PUFAs was 11.0 in wild salmon, compared with 3.6 in farmed salmon. PUFAs were the major fatty acids found in farmed salmon.
Saturated fatty acids were 35 percent higher in farmed salmon than in wild. In contrast, monounsaturated fatty acids were 60 percent higher in the wild than farmed salmon.
Flavor testing
In Ireland, sensory profiling techniques were used to investigate the odor and flavor of Atlantic salmon from six sources to determine whether there was any scientific basis for reports of off-flavors in wild and farmed salmon. There was no consistent difference in odor or flavor between sea-caught wild salmon and farmed salmon.
However, river-caught wild salmon showed an enhanced “earthy” flavor and odor. A gas chromatograph odor assessment indicated that geosmin and 2-methy-lisoborneol contributed to these attributes, but their presence could not be detected in sufficient concentrations to verify the association. However, these are the same compounds responsible for similar off-odor/off-flavor in farmed catfish.
Lipids, fatty acids
Samples of farmed market-size (2.5- to 5-kg) Atlantic salmon obtained weekly over two years from five Scottish farms were analyzed for total lipid content, lipid class composition, fatty acid composition, vitamin E content, and carotenoid pigment content.
For almost 500 fish, the average lipid composition was 10.1 ± 2.9 percent. The salmon muscle was high in the 22:6 omega-3 and 20:5 omega-3 highly unsaturated fatty acids, with average values of 11.3 percent and 5.4 percent of the total fatty acids, respectively. The vitamin E content of the flesh was approximately 30 milligrams per kilogram, but was significantly higher in fish fed the lowest dietary lipid level.
Changes in carotenoid pigmentation up to 120 hours after harvest suggested that fish fed astaxanthin alone showed a loss of pigmentation over time that did not occur in fish fed either canthaxanthin alone or in combination with astaxanthin. The lipid contents were highest in the region immediately in front of the dorsal fin and lowest in the tail region.
Total muscle lipid levels were positively correlated with dietary lipid. Carotenoid pigment levels were equal across the body and independent of dietary lipid.
Astaxanthin pigmentation
Salmon fillet color is an important quality factor when consumers make their fish selections. Results from a study in which diets supplemented with astaxanthin, astaxanthin dipalmitate, and canthaxanthin were fed to salmon for 52 weeks showed that astaxanthin was more effectively utilized than canthaxanthin, which was more effectively utilized than astaxanthin dipalmitate.
In a later study, fish were fed astaxanthin only, canthaxanthin only, and a mixture of astaxanthin and canthaxanthin. As the proportion of dietary canthaxanthin increased, flesh pigment levels also showed an increase. The pigment content in the muscle of fish fed canthaxanthin only was 14 percent higher than that of the astaxanthin-only fish, while the pigment content in the fish fed both compounds fell between the two. The reason for the differential pigmentation was primarily due to the digestibility of the carotenoids, which can vary based on their source.
In a different study, doses of astaxanthin were injected into the abdominal cavity of salmon. The muscle concentration in the fish reached 30 milligrams per kilogram. Plasma astaxanthin concentration was a good indicator of astaxanthin bioavailability in the muscle.
Since very high astaxanthin concentrations could be reached in smaller fish in just four weeks by intraperitoneal injection, the procedure could work as an alternative to oral administration. However, the higher concentrations of canthaxanthin administered correlated with a greater reduction in the rate of weight gain. Slower release of the pigment could minimize this problem.
Identification of organic salmon
Using isotope ratio mass spectrometry (IRMS), the ratios of stable carbon and nitrogen isotopes were investigated in raw salmon fillets to develop an analytical method to differentiate organically farmed, wild, and conventionally farmed (CF) Atlantic salmon.
IRMS was able to distinguish organic from wild salmon with nitrogen isotope values higher in organic fish – but not from conventionally farmed salmon. A gas chromatography analysis of fatty acids in the three types of samples differentiated wild from CF fish based on stearic acid levels, and CF and organic animals based on either linoleic acid or alpha-linolenic acid levels, but no clear distinction was possible between the organic and CF salmon.
A computer analysis yielded several combinations of input data that correctly assigned 100 samples from Ireland and Norway to their appropriate classes. While this assignment could have been made on the basis of the fatty acid analysis alone, the combination of gas chromatography and IRMS analysis provided greater accuracy.
(Editor’s Note: This article was originally published in the September/October 2007 print edition of the Global Aquaculture Advocate.)
Now that you've reached the end of the article ...
… please consider supporting GSA’s mission to advance responsible seafood practices through education, advocacy and third-party assurances. The Advocate aims to document the evolution of responsible seafood practices and share the expansive knowledge of our vast network of contributors.
By becoming a Global Seafood Alliance member, you’re ensuring that all of the pre-competitive work we do through member benefits, resources and events can continue. Individual membership costs just $50 a year.
Not a GSA member? Join us.
Author
-

Food Science and Technology Department
Virginia Tech/Virginia Sea Grant (0418)
Blacksburg, Virginia 24061 USA
Related Posts
Intelligence
A brief look at genetically modified salmon
If approved by FDA, fast-growing genetically modified salmon will provide a safe and nutritious product similar to other farmed Atlantic salmon.
Intelligence
A land grab for salmon (and shrimp) in upstate New York
The operators of Hudson Valley Fish Farm see their inland locale as a pilot to prove that land-based fish farming, located in close proximity to major metropolitan markets, can be successful.

Aquafeeds
Alternative feed ingredients support continued aquaculture expansion
Identifying sources for essential macro- and micronutrients is important, as well as understanding how best to manufacture feed to required physical specifications when using these new raw materials.
Health & Welfare
Animal health giants have sea lice in their crosshairs
Alltech and Benchmark have been working on the next generation of sea lice solutions and believe they have new products that can help salmon farmers win.