Proximate analysis of fatty acid composition in tilapia
PUFA composition a key factor nutritional recommendations
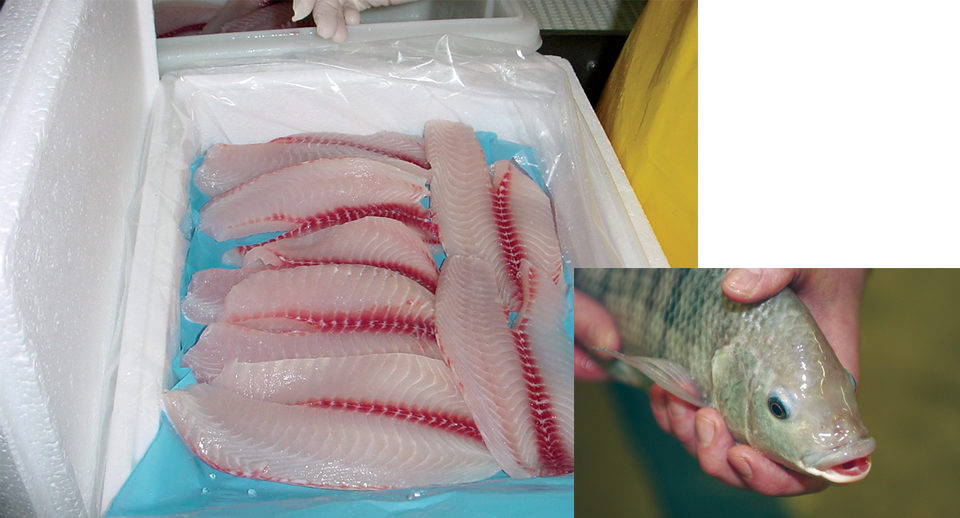
Tilapia are now regarded as the “aquatic chickens” of warm-water aquaculture. The fish are delicious to eat, with no fine intramuscular bones and little carcass waste; easy to breed; cheap to feed; and tolerant of wide temperature, salinity, and water quality ranges. Also, the fish are comparatively free from parasites and diseases. Many tilapia are sold whole, but some are sold as fillets, breaded fish sticks, and other further processed products.
Flesh characteristics
Tilapia has white flesh of fine texture with a slightly fatty flavor considered by gourmets to be similar to sole. Palatability, however, is very dependent on diet and species type. Wild-caught fish can acquire a bitter off-taste due to feeding on blue-green algae, while intensively reared farm fish grown in ponds and recirculating aquaculture systems have a more refined flavor characteristic of the ingredients of the pelleted feed.
The edible fraction of tilapia is rather low, with a headed, gutted, and scaled dress-out weight of 50 to 60 percent and a fillet fraction of 30 to 40 percent. Table 1 shows the proximate composition, calorie content, and wet-basis cholesterol content of tilapia fillets.
Flick, Mean proximate composition, calorie content, and cholesterol content, Table 1
| Item | Value |
|---|---|
| Calories (kcal/100 g) | 139.8 ± 5.1 |
| Protein (g/100 g) | 20.3 ± 5.3 |
| Fat (g/100 g) | 5.7 ± 34.8 |
| Ash (g/100 g) | 2.3 ± 11.3 |
| Moisture (g/100 g) | 75.3 ± 5.4 |
| Cholesterol (mg/100 g) | 31.3 ± 6.1 |
Monounsaturates comprise an average of 54.6 g/100 g, while n-3 highly unsaturated fatty acids comprise an average of 2.2 g/100 g
of total fatty acids.
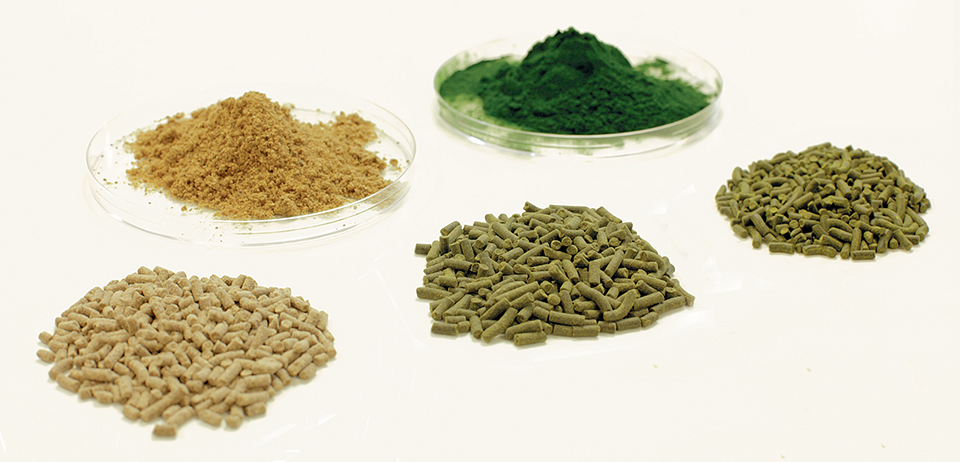
Diet, fatty acid composition
The reported variations in yield and chemical composition of tilapia are related to many factors, including the performance of processing machines or employees, feed composition and feeding rate, environmental conditions, section analyzed, size, sex, physiological status, and species.
A recent study showed the effects of diets on the fatty acid composition of tilapia muscle (Table 2). Varying the feed composition resulted in 100 to 300 percent differences in the polyunsaturated fatty acid (PUFA) content. PUFA composition is one of the most important factors in fish being recommended as a major dietary muscle food.
Flick, Fatty acid composition of muscle from tilapia, Table 2
| Feed 1 | Feed 2 | Feed 3 | Feed 4 | |
|---|---|---|---|---|
| Total PUFAs | 43.6% | 34.5% | 41.0% | 32.7% |
| n-6 PUFA | 15.8% | 16.9% | 30.6% | 20.1% |
| n-3 PUFA | 27.8% | 17.7% | 10.2% | 18.7% |
Studies have shown that tilapia, as well as most fresh-water fish, have low contents of α-linolenic (LNA, 18:3 omega-3), eicosapentaenoic (EPA, 20:5 omega-3) and docosaheaenoic (DHA, 20:5 omega-6) fatty acids, when compared to those from the sea or natural habitats. In one study, tilapia were fed flax-seed oil – one of the world’s most important vegetable sources of LNA, a precursor of the long-chain PUFA omega-3 fatty acids – for five months at increasing levels of 0, 1.25, 2.50, 3.75 and 5.00 percent. The effects of these diets on tilapia fillet composition are shown in Table 3.
Flick, Composition of fillets from tilapia fed diets with varied flaxseed oil content, Table 3
| Composition | 0 Flaxseed Oil | 1.25% Flaxseed Oil | 2.50% Flaxseed Oil | 3.75% Flaxseed Oil | 5.00% Flaxseed Oil |
|---|---|---|---|---|---|
| Total lipids (g/100 g) | 1.1 ± 0.2a | 1.1 ± 0.2a | 1.2 ± 0.3a | 1.2 ± 0.2a | 1.1 ± 0.2a |
| Moisture (g/100) | 77.4 ± 0.7a | 76.8 ± 0.4a | 77.2 ± 0.7a | 77.3 ± 1.2a | 76.9 ± 0.4a |
| LNA (mg/g) | 6.5 ± 1.8a | 18.8 ± 3.0b | 34.2 ± 3.3c | 55.3 ± 7.3d | 59.3 ± 7.5e |
| EPA (mg/g) | 0.1 ± 0.0a | 0.8 ± 0.1b | 1.4 ± 0.1c | 2.0 ± 0.2d | 2.5 ± 0.4e |
| DHA (mg/g) | 9.9 ± 2.6a | 16.8 ± 2.2b | 22.7 ± 2.7c | 25.9 ± 2.6d | 26.1 ± 2.0e |
There was no significant difference in total lipid and moisture contents among the treatments. However, increasing the flaxseed oil in the diets resulted in increasingly significant concentrations of LNA, EPA, and DHA. While the contents of LNA and DHA stabilized with increasing concentrations of LNA in the feed, above the 3.75 percent flaxseed oil level, the EPA concentration still increased. Therefore, increasing the amount of LNA in feed can markedly increase the amounts of EPA in tilapia fillets relative to DHA.
This increase in EPA and DHA is desirable, since it is well established that increasing the amount of long-chain polyunsaturated fatty acids in the diets of humans reduces the risks of heart disease and rheumatoid arthritis. Consumption of the fatty acids and fish oils has also been found to reduce the biochemical factors associated with cancer, psoriasis, and human fertility.
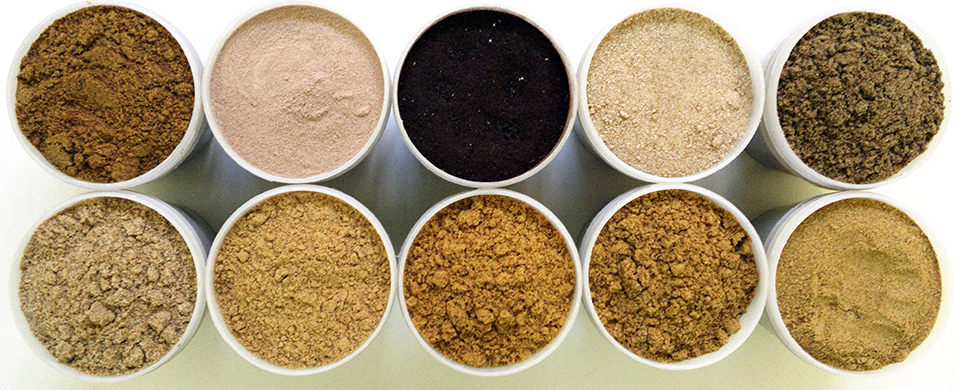
Replacing fishmeal with protein sources such as sunflower cake and corn oil also significantly affects whole body fatty acids. A variation in one study showed that a fishmeal diet produced a whole body fatty acid content of 41 percent, while a partial replacement of fishmeal ranged from undetectable to a high of 19 percent.
Optimum enrichment
Continued research is needed to identify strategies for enriching fish lipids with omega-3 unsaturated fatty acids before the fish are marketed. This is particularly important in regions where there is limited intake of these fattty acids from other food sources.
(Editor’s Note: This article was originally published in the November/December 2006 print edition of the Global Aquaculture Advocate.)
Now that you've reached the end of the article ...
… please consider supporting GSA’s mission to advance responsible seafood practices through education, advocacy and third-party assurances. The Advocate aims to document the evolution of responsible seafood practices and share the expansive knowledge of our vast network of contributors.
By becoming a Global Seafood Alliance member, you’re ensuring that all of the pre-competitive work we do through member benefits, resources and events can continue. Individual membership costs just $50 a year.
Not a GSA member? Join us.
Author
-

Food Science and Technology Department
Virginia Tech / Virginia Sea Grant (0418)
Blacksburg, Virginia 24061 USA
Related Posts

Health & Welfare
Advances in fish hatchery management
Advances in fish hatchery management – particularly in the areas of brood management and induced spawning – have helped establish aquaculture for multiple species.
Aquafeeds
Algae alternative: Chlorella studied as protein source in tilapia feeds
Chlorella and other species have potential as protein sources in aquafeeds. In trials with tilapia fry raised in a recirculating system, the fish received a fishmeal-based control diet or feeds with portions of the fishmeal replaced by Chlorella.
Aquafeeds
Animal protein meals reduce feed costs but don’t improve shrimp performance
The authors conducted a study to determine how replacement of salmon meal with various animal protein meals in feed affected the growth performance of white shrimp.

Aquafeeds
Aquaculture feed composition helps define potential for water pollution
A study found that feed for salmon and trout had higher organic carbon concentrations than did catfish, shrimp and tilapia feeds. Nitrogen and phosphorus concentrations were similar among salmon, trout and shrimp feeds, and higher than those in catfish and tilapia feeds.