Market, trade flows of frozen tilapia in EU
A limited market in Europe for the affordable whitefish
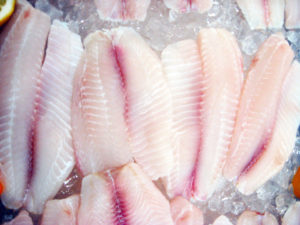
Despite being one of the most popular farmed freshwater fish around the world, tilapia is an almost unknown product in the displays of European shops. Within the European market of frozen fish fillets, tilapia play a minor role, with average yearly import quantities below 20,000 metric tons (MT). These amounts represented less than 0.003 percent of a market of 5.5 million metric tons (MT) of fish fillets in 2013, and only 11.4 percent of an aggregate of other tropical farmed species that include pangasius and Nile perch. The latter are much better known by European consumers.
Tilapia supply in EU
With very limited contributions from other continents, tilapia fillets in the European Union are mainly imported from Asia (Table 1). Tilapia imports from Asia have remained fairly stable, with a minor increase of about 400 MT between 2010 and 2013. While not a majorly significant increase, the quantities in 2013 represented an important recovery from a fall to less than 16,0000 MT in 2012.
Polanco, Regional sources for frozen tilapia, Table 1
| Year | Import Volume (mt) Africa | Import Volume (mt) Latin America | Import Volume (mt) Asia |
|---|---|---|---|
| 2010 | 1.4 | 93.7 | 18,886.4 |
| 2011 | 64.7 | 81.0 | 18,776.4 |
| 2012 | 78.0 | 93.3 | 15,750.9 |
| 2013 | 0 | 31.0 | 19,290.7 |
Within Asia, China is the most important exporter, providing more than 80 percent of the total imported quantities of tilapia (Table 2). Indonesia is the second-largest exporter to the EU, with annual amounts under 2,000 MT. The quantities from these two countries remained relatively stable since 2010, except for a decrease in 2012. Vietnam is a fast-growing newcomer whose exports of frozen tilapia fillets to the EU rose from 163 MT in 2010 to almost 1,000 MT in 2013 – a huge increase.
Polanco, Main Asian sources for frozen tilapia, Table 2
| Year | Import Volume (mt) China | Import Volume (mt) Vietnam | Import Volume (mt) Indonesia | Import Volume (mt) Thailand |
|---|---|---|---|---|
| 2010 | 16,738.3 | 163.2 | 1,522.3 | 421.9 |
| 2011 | 16,308.9 | 425.3 | 1,700.0 | 315.0 |
| 2012 | 13,964.2 | 134.7 | 1,340.4 | 175.0 |
| 2013 | 16,014.1 | 980.0 | 1,901.1 | 214.9 |
On average, Asian tilapia is cheaper than other imports from Africa or Latin America (Table 3). China is not only the leader in quantity, but also in price. The average import price was 2.53 euro/kg (U.S. $3.22/kg) for frozen fillets, including transport costs and insurances. This price is about half of the recorded prices for Latin American imports – and even cheaper than for other Asian exporters.
Polanco, Transportation and insurance costs for frozen tilapia , Table 3
| Year | Price (euro/kg) (U.S. $/kg) China | Price (euro/kg) (U.S. $/kg) Vietnam | Price (euro/kg) (U.S. $/kg) Indonesia | Price (euro/kg) (U.S. $/kg) Thailand |
|---|---|---|---|---|
| 2010 | 2.42 ($3.08) | 2.35 ($2.99) | 3.85 ($4.90) | 3.08 ($3.92) |
| 2011 | 2.69 ($3.43) | 2.84 ($3.62) | 4.18 ($5.32) | 4.99 ($6.35) |
| 2012 | 2.58 ($3.29) | 3.03 ($3.86) | 4.66 ($5.93) | 6.65 ($8.47) |
| 2013 | 2.53 ($3.22) | 2.86 ($3.64) | 4.65 ($5.92) | 4.91 ($6.25) |
Vietnamese prices are closer to the Chinese levels than those of Indonesia and Thailand. It is assumed that the differences in price also refer to differences in quality. In such a case, Thailand would be the quality leader, along with Indonesia. Vietnam may be attempting to directly compete with China for the price leadership.
Importers, intra-E.U. trade
With more than 5,000 MT of tilapia fillets imported in 2013, Poland and Spain were the main importers of frozen tilapia fillets in the EU (Table 4). The countries also reported the lowest import prices of the top five importers and the total EU. Germany, with 2,000 MT of imports, and the Netherlands and Belgium, between 1,500 and 2,000 MT, completed the top five markets for tilapia fillets. They accounted for 81 percent of the total EU imports.
Polanco, Top tilapia-importing countries, Table 4
| Country | Volume (mt) | Price (euro/kg) (U.S. $/kg) | Market Share (%) |
|---|---|---|---|
| Poland | 5,400 | 2.26 ($2.88) | 28.06 |
| Spain | 5,222 | 2.47 ($3.15) | 27.14 |
| Germany | 2,016 | 3.29 ($4.19) | 10.48 |
| Netherlands | 1,778 | 3.49 ($4.44) | 9.24 |
| Belgium | 1,354 | 3.59 ($4.57) | 7.04 |
The destination of the imported tilapia varies across countries (Table 5). The majority is consumed in local markets in Spain, Poland and Germany, whether as a final product or incorporated into processed fish meals. The Netherlands and Belgium have a clear focus on re-exporting this commodity to other EU countries.
Polanco, Intra-European Union trade in frozen tilapia fillets, Table 5
| Country | Tilapia Exports (mt) | Price (euro/kg) (U.S. $/kg) | Internal Consumption (mt) | Gross Profit (%) | Export Value (1,000 euro) (1,000 U.S. $) |
|---|---|---|---|---|---|
| Netherlands | 1,246.1 | 3.94 ($4.99) | 532.4 | 13.01 | 5,551 ($7,039) |
| Belgium | 1,165.9 | 5.35 ($6.77) | 189.0 | 48.92 | 9,291 ($11,782) |
| Poland | 697.6 | 2.96 ($3.75) | 4,702.2 | 30.84 | 2,698 ($3,421) |
| Germany | 462.8 | 3.88 ($4.91) | 1,553.1 | 17.85 | 2,114 ($2,681) |
| Spain | 72.7 | 2.69 ($3.41) | 5,149.4 | 9.18 | 214 ($271) |
Tilapia trade within the EU is an interesting business that results in very interesting margins, depending on the final destination country. Belgium and Poland report the highest gross margins for these trade operations, which assume they are exporting to higher-income markets like Germany and Scandinavia, or incorporating added value by means of packaging and branding.
(Editor’s Note: This article was originally published in the November/December 2014 print edition of the Global Aquaculture Advocate.)
Authors
-

Departamento de Administración de Empresas
Facultad de Ciencias Económicas y Empresariales
Universidad de Cantabria
39005 Santander, Cantabria, Spain -

Universidad de Cantabria
39005 Santander, Cantabria, Spain -
Universidad de Cantabria
39005 Santander, Cantabria, Spain
Related Posts
Intelligence
Adding value to tilapia to tap into U.S. market
New markets for tilapia and expansion of existing ones can be created by planning and implementing properly designed geographic strategies to meet discriminating consumer preferences. Low labor costs in most producing countries promotes value-adding by the production of fresh fillets.

Intelligence
A motive, and a market, for farmed fish in Mexico
Boasting ample areas for aquaculture and a robust domestic demand for seafood – not to mention its close proximity to the U.S. market – a land of opportunity lies in Mexico. Fish farming is primed to meet its potential south of the border.
Responsibility
Addressing safety in Latin America’s tilapia supply chain
Over the last decade, the experience gained by many tilapia farmers combined with proficient programs implemented by local governments have significantly improved tilapia production in various Latin American countries like Colombia, Mexico, Ecuador and other important tilapia producers in the region.
Responsibility
Abordando la inocuidad en la cadena de suministro de tilapia de América Latina
En la última década, la experiencia adquirida por muchos productores de tilapia combinada con programas eficaces implementados por los gobiernos locales ha mejorado significativamente la producción de tilapia en varios países de América Latina como Colombia, México, Ecuador y otros importantes productores de tilapia de la región.