DNA microarrays: New face of aquaculture genetics?
Technology can now visualize the genes that are differentially expressed in high- and low-performing animals
Nearly all genetic improvement of plants and animals historically relied on selection of the phenotype, the appearances of organisms that result from the interactions of their genetics and the environment. Precise information on the actual genes responsible for growth, disease resistance, flesh quality, and other attributes was unavailable. During the last 10 years, however, considerable effort was invested to open this “black box” and discover the genes.
Marker-assisted selection
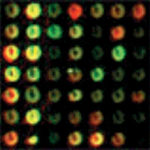
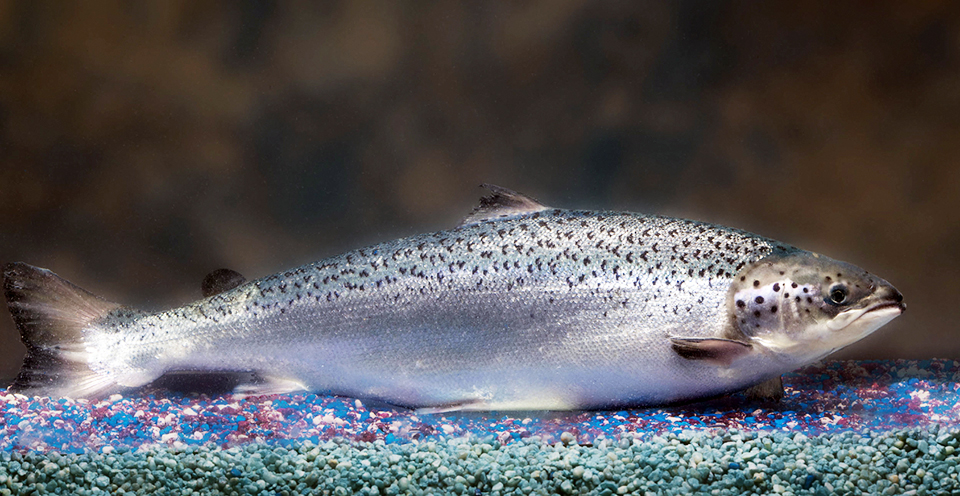
in both slow- and fast-growing animals bind equally to red and green dye, and appear yellow. Photo courtesy of AgGenomics.
Marker-assisted selection is one method of gene study. The first-generation marker technology could detect chromosome regions containing commercially important genes termed quantitative trait loci, or QTL. This was achieved using progeny analyses and DNA markers over the chromosomes. These DNA markers do not detect the actual genes or the transcript level of the gene product.
The applied outcomes of marker-assisted selection for animal selection are limited and may have been hampered by the nature of the technology itself. It is costly to determine even a few QTLs. As linkage groups rather than the actual genes are detected, genetic recombination can dissociate the marker with the QTL, so results from one family or breed may not be predictive for others.
High-density genetic maps of numerous markers are needed to detect QTLs, but are absent for most aquaculture species. The method also has relatively low throughput. The difficulties are compounded when genes on different chromosomes interact and generate complex traits.
Functional genomics
A new generation of technology, functional genomics, has recently emerged to offer direct knowledge through DNA microarrays of the actual genes and transcript levels involved in a trait. In functional genomics, the levels of thousands of genes can be expressed simultaneously, allowing identification of the tens or hundreds of genes involved in varied traits.
DNA microarrays
DNA microarray analyses do not require existing genetic markers or genetic maps. The technology can now visualize the genes that are differentially expressed in high- and low-performing animals or plants, and compare these expression patterns over a range of different environments and conditions.
This direct information of the genes and genome can be used to more efficiently and rapidly improve strains. The ability to commercialize the information itself is assisting in the establishment of overall business models to invest in the genetic improvement of aquaculture species.
Applications in human science
The clearest evidence to date for the application of functional genomics employing microarray technology comes from human medical science. Microarrays are used to identify susceptibility or resistance to diseases such as cancer, diabetes, and asthma. They can even accurately predict outcomes from cancer and chemotherapies for patients.
Most of the above medical traits are complex. The micro-arrays provide simultaneous information on tens or even hundreds of genes associated with a given trait, and can also determine the interactions and covariance among genes. Through interrelationships with known genes, we can gain insight into the biological role of unknown genes as well as identify groups of functionally related genes.
Microarray technology
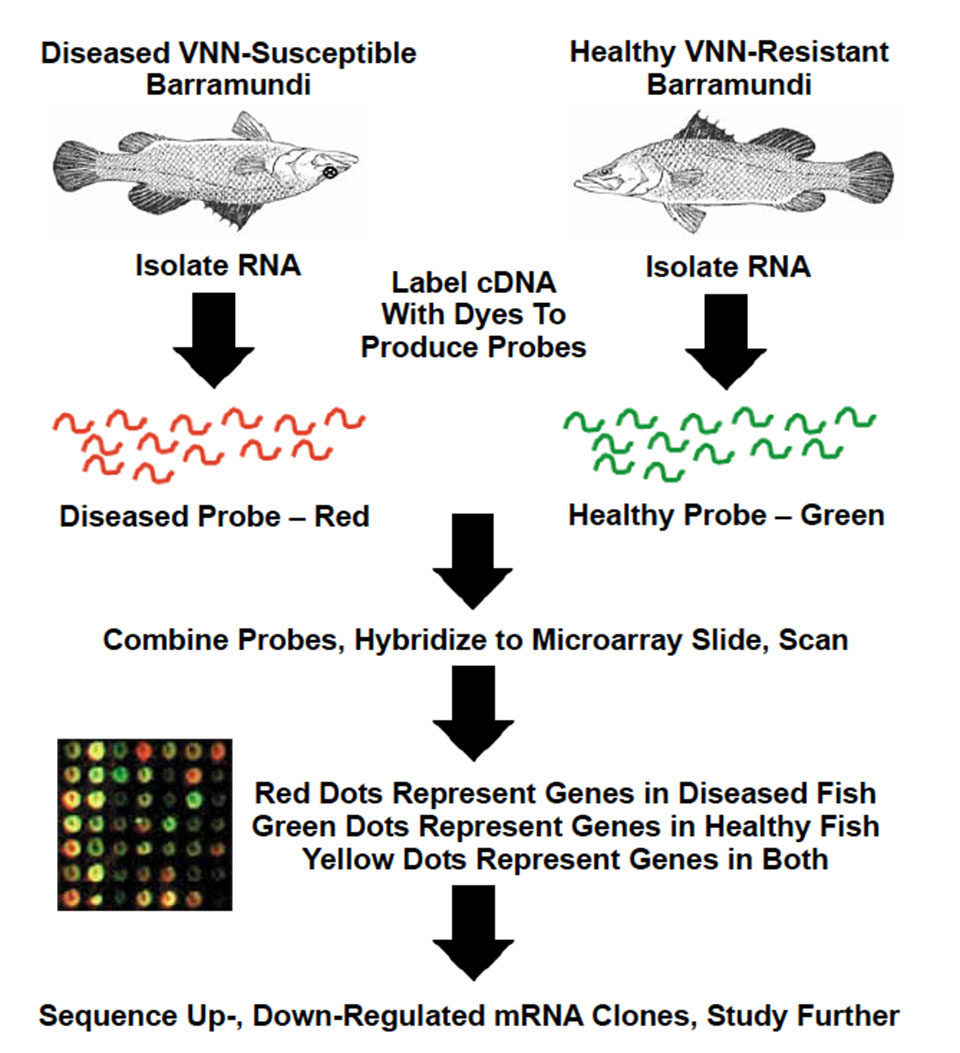
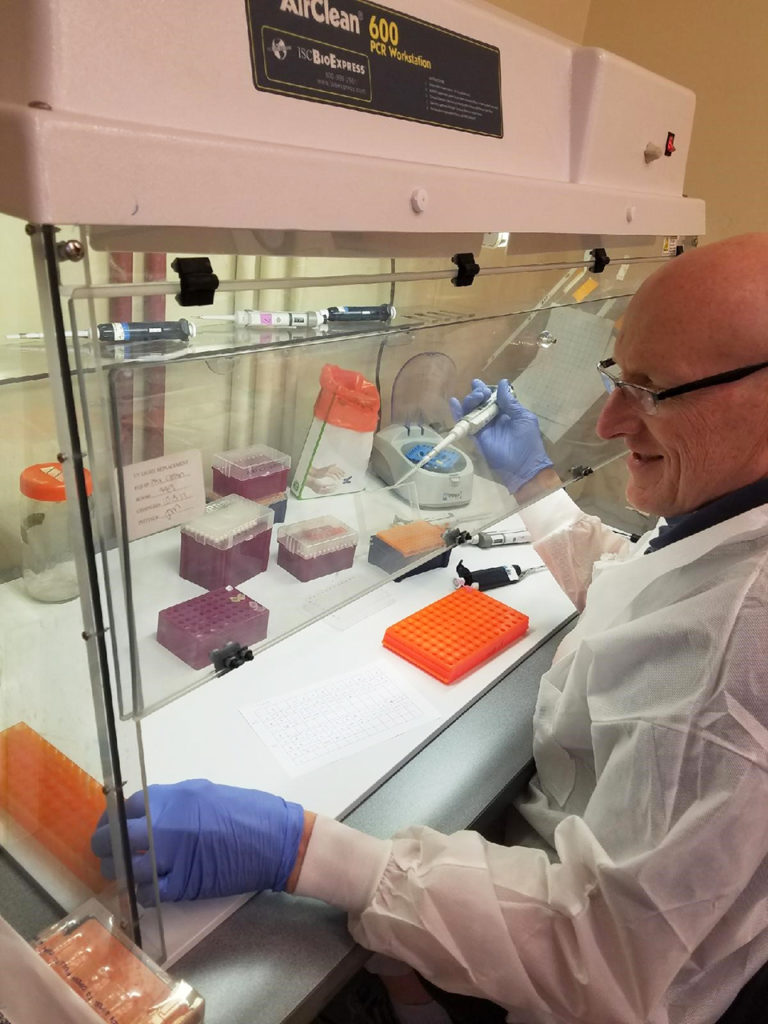
DNA microarray technology involves the individual spotting or printing by a robot of up to 10,000 DNA sequences onto a microscope glass slide. This presents 20-30 gene products per millimeter2. These DNA sequences are the products of gene expression, the RNA, which is converted into cDNA before printing.
Great care is taken in the choice of source animals’ tissues and stage of development so the slide contains most of the expressed genes of commercial interest. To identify which of the genes on the glass slide are involved in a commercial trait, say growth, RNA from a slow-growing animal and fast-growing animal is selected and converted into cDNA. The two RNA samples are each labeled with a distinct florescent dye, usually red or green.
The samples, or “probes,” are pooled together in equal proportions and reacted (hybridized) with the DNA microarray slides. All genes expressed in a similar fashion in both the slow- and fast-growing animals bind equally to both the red and green dye, and appear yellow. Genes expressed only in the slow-growing animal appear red, while those that are expressed in the fast-growing animal appear green. The green dots can then be traced back to stock plates. Their DNA is sequenced and identified for further work.
Costs depend on the number of sequences printed on each slide (usually 5,000-10,000) and the number of identical slides printed (usually 100 at a time). They range from U.S. $25,000 to over $100,000 for a set of 100 slides.
Powerful technology
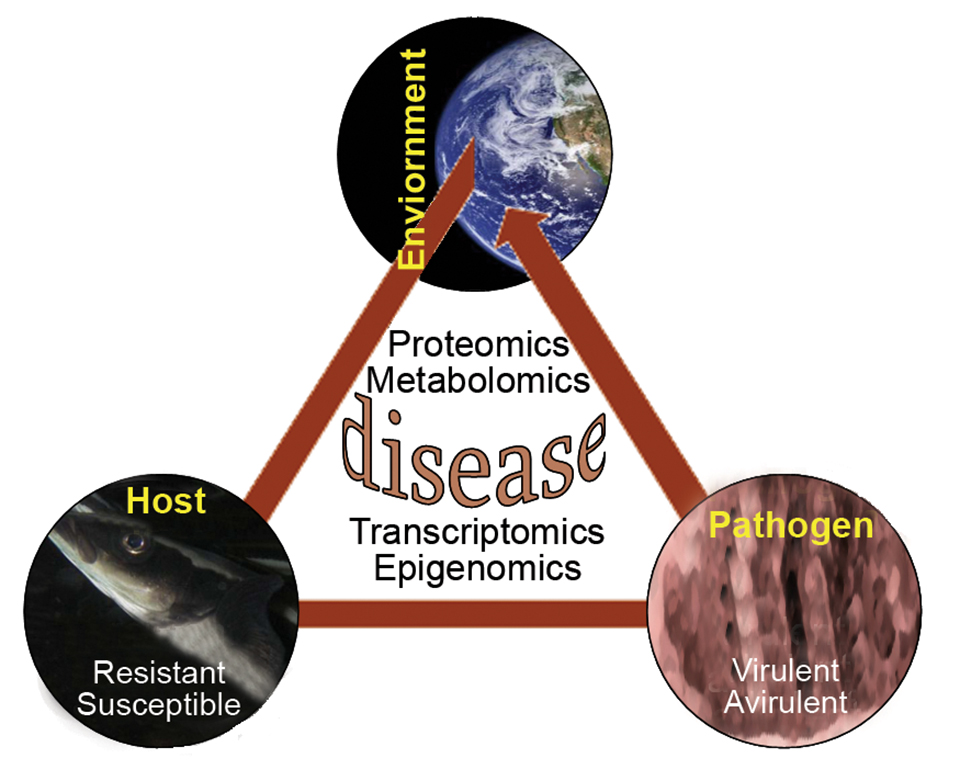
This powerful approach enables the identification of precise molecular differences among individuals and families that also vary for commercial traits. It identifies the roles of novel genes that were unknown or not identified previously and opens the way to look at large-scale gene interactions and responses. The approach allows us to examine simultaneously the expression patterns of a suite of genes at different situations.
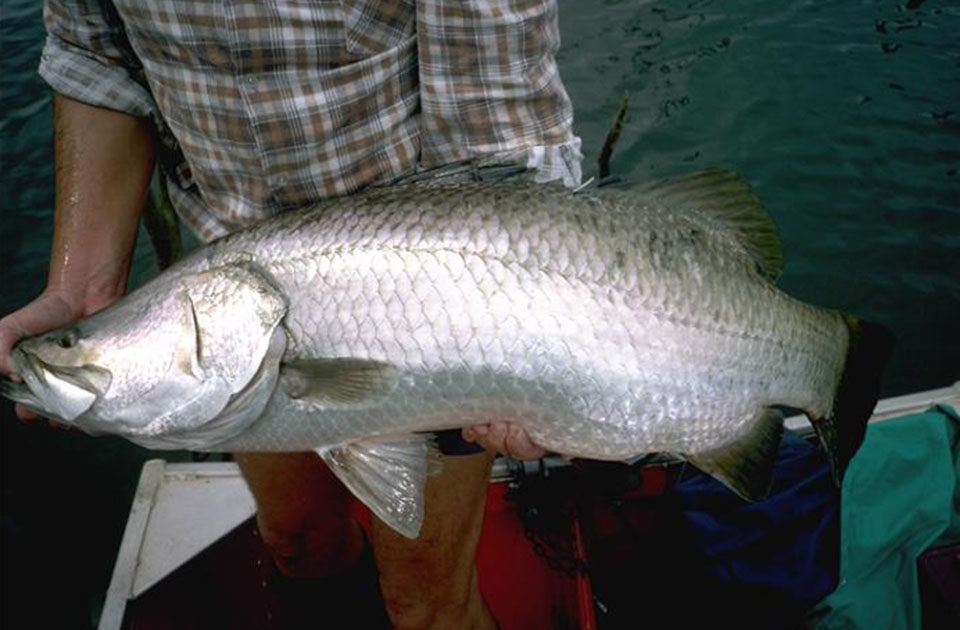
The first data from microarray experiments on aquaculture species in the United States reported on genes that are differentially expressed in channel catfish in response to cold acclimation. In Australia, researchers at Bribie Island Aquaculture Research Centre in Queesnland are using DNA microarrays to discover the genes that regulate molting in crustaceans and the genes that control resistance to viral infection in barramundi.
Integration with classic selection
Traditional selection measures phenotypes to infer geno-types. Some propose that DNA microarray data is simply a further measure of phenotypes with heritabilities and genetic correlations.
This method can augment traditional selection experiments that measure a few traits (e.g., growth or carcass quality) with thousands of new traits. Critics of this approach point to the high cost and concerns of accelerated inbreeding, statistical challenges, and comparative efficiencies.
Conclusion
Seeing microarrays as just an extension of traditional selection approaches with an increase in information may seriously undervalue the genomics revolution. Perhaps we should see microarray information less as indirect phenotypic measures of the genotype and more as closer measures of the genotype.
Their additional value in developing genetic models, dissecting complex traits, understanding the metabolic pathways for commercial traits, and detecting new mutations should also be considered. The question then becomes how can we design new selection strategies to use genomic information, rather than just adapt this information into traditional selection programs.
(Editor’s Note: This article was originally published in the February 2004 print edition of the Global Aquaculture Advocate.)
Now that you've reached the end of the article ...
… please consider supporting GSA’s mission to advance responsible seafood practices through education, advocacy and third-party assurances. The Advocate aims to document the evolution of responsible seafood practices and share the expansive knowledge of our vast network of contributors.
By becoming a Global Seafood Alliance member, you’re ensuring that all of the pre-competitive work we do through member benefits, resources and events can continue. Individual membership costs just $50 a year.
Not a GSA member? Join us.
Authors
-

Agency for Food and Fibre Sciences, Fisheries and Aquaculture
Department of Primary Industries
Bribie Island Aquaculture Research Centre
144 North Street, Woorim
P.O. Box 2066
Bribie Island, Queensland 4507 Australia -
Agency for Food and Fibre Sciences, Fisheries and Aquaculture
Department of Primary Industries
Bribie Island Aquaculture Research Centre
144 North Street, Woorim
P. O. Box 2066
Bribie Island, Queensland 4507 Australia -
Agency for Food and Fibre Sciences, Fisheries and Aquaculture
Department of Primary Industries
Bribie Island Aquaculture Research Centre
144 North Street, Woorim
P. O. Box 2066
Bribie Island, Queensland 4507 Australia -
Agency for Food and Fibre Sciences, Fisheries and Aquaculture
Department of Primary Industries
Bribie Island Aquaculture Research Centre
144 North Street, Woorim
P. O. Box 2066
Bribie Island, Queensland 4507 Australia
Related Posts
Health & Welfare
Nutrition and genes research at Virginia Tech
Transcriptomics studies highlight impacts of different treatments on specific genes that can be targeted via nutritional intervention to increase farmed animal performance or welfare.
Intelligence
A brief look at genetically modified salmon
If approved by FDA, fast-growing genetically modified salmon will provide a safe and nutritious product similar to other farmed Atlantic salmon.
Health & Welfare
A comprehensive look at the Proficiency Test for farmed shrimp
The University of Arizona Aquaculture Pathology Laboratory has carried out the Proficiency Test (PT) since 2005, with 300-plus diagnostic laboratories participating while improving their capabilities in the diagnosis of several shrimp pathogens.
Health & Welfare
A study of Zoea-2 Syndrome in hatcheries in India, part 1
Indian shrimp hatcheries have experienced larval mortality in the zoea-2 stage, with molt deterioration and resulting in heavy mortality. Authors investigated the problem holistically.