Balancing protein and energy in Nile tilapia feeds
Protein deposition may be limited by factors other than protein and energy intake, including genetic potential
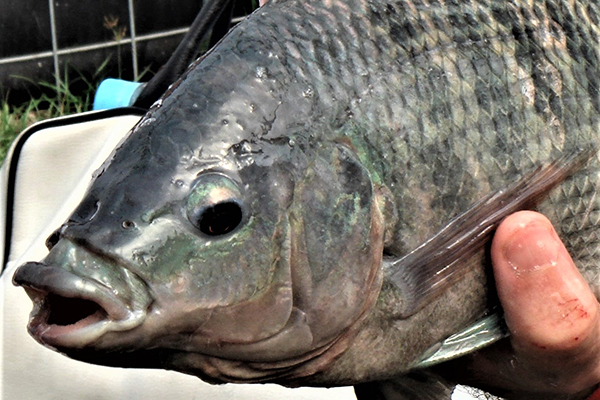
The Nile tilapia (Oreochromis niloticus) is one of the main fish species farmed worldwide. Its production has increased rapidly over the past 40 years, accelerated by the intensification of farming practices. Intensification of tilapia production intends to increase productivity by optimizing resource-use efficiency (e.g., water, feed, labor).
Like for other animal species, the intensification of Nile tilapia farming has been supported by increasing use of formulated feeds.
Formulated feeds increase fish farms’ productivity, because they allow a regular and abundant nutrients supply that is higher than most ecosystems could provide. Yet, formulated feed is costly and usually accounts for more than half of the total operating costs in intensive tilapia farming systems. Thus, overall farm productivity is largely determined by feed efficiency.
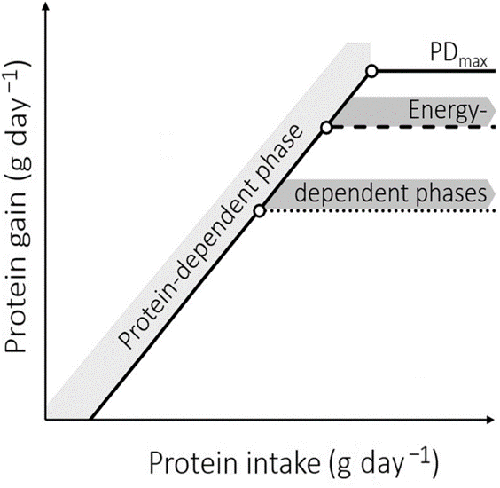
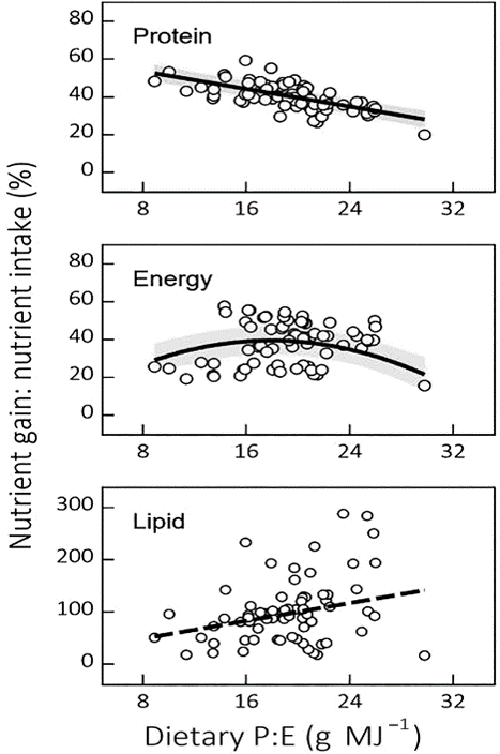
With the increasing use of formulated fish feeds, nutritionists have sought to determine optimal dietary P:E for the growth of most commercially important aquaculture species, including Nile tilapia (Fig. 1).
![Ad for [membership]](https://www.globalseafood.org/wp-content/uploads/2025/07/membership_web2025_1050x125.gif)
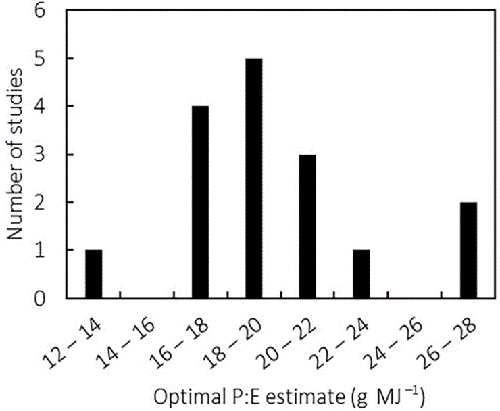
To our knowledge, the existence of distinct protein- and energy-dependent growth phases has not yet been tested in fish. However, optimal dietary P:E estimates have been published for many farmed fish species. These were determined by means of feed trials or via factorial modeling. In Nile tilapia, published estimates of the optimal dietary P:E derived from growth experiments vary from 13.3 for 40- to 200-gram fish to 26.3 for 0.01- to 0.3-gram juveniles (Fig. 2). Differences in published estimates may be attributed to many factors.
This article – adapted and summarized from the original publication (Konnert, G.D.P. et al. 2022. Balancing protein and energy in Nile tilapia feeds: A meta-analysis. Rev. Aquac. 2022; 1–22) – reports on the results of a comprehensive literature review to determine if there is a physiological basis for an optimal P:E for Nile tilapia feeds, using two meta-analytical approaches.
First, the effect of dietary P:E on Nile tilapia growth were examined, with a focus on nutrient partitioning. Then, the separate effects of protein and energy intake on protein and lipid gain in Nile tilapia were examined, along with a discussion on the biological significance of the results and implications for practical tilapia feed formulation. For detailed information, refer to the original publication.
The optimal dietary P:E is context dependent
We investigated if nutrient partitioning and growth can be optimized via adjustments in the P:E of Nile tilapia feeds. Our analyses showed that changes in dietary P:E have linear effects on nutrient partitioning in Nile tilapia and that protein gain is often simultaneously limited by both protein and energy intake.
From a fish farming perspective, the concept of an optimal dietary P:E implies that one or several production variable(s) have an optimal value at a constant dietary P:E, above or below which no further improvement can be achieved. This should result in a non-linear relationship between dietary P:E and the variable(s) of interest. However, regression analyses are not always applied to estimate the optimal dietary P:E of farmed fish species, and in a re-analysis of some published data we show that there are no significant relationships between dietary P:E and body mass gain.
Our meta-analysis indicated that the most prominent effects of changes in dietary P:E were on protein partitioning. These effects were linear, and as such, did not reach plateau (i.e., optimal) values. Protein retention efficiency and fillet yield respond in opposite ways to changes in dietary P:E and balancing dietary P:E for Nile tilapia feeds primarily involves a trade-off between protein retention efficiency and fillet gain.
Balancing dietary P:E is also likely to depend on its effect on lipid gain. Higher lipid deposition, induced by feeding low-dietary P:E, mainly occurs along the fish viscera. The increase in visceral lipid gain in fish fed low-dietary P:E reported in the literature explains the reduction in fillet yield with decreasing dietary P:E. Reducing dietary P:E can cause an increase in hepatic lipid content, and this abnormal lipid accumulation is commonly seen in farmed fish and may in some cases represent a pathological condition. Balancing dietary P:E involves some trade-offs between dietary protein utilization efficiency, fillet yield and possibly fish health.
The practical implication of these findings is that the optimal dietary P:E is always context-dependent. On the one hand, low-dietary P:E may be advantageous in situations in which high-protein retention efficiency is required (e.g., scarcity of affordable protein-rich ingredients, or compliance with restrictions on nitrogen emissions). On the other hand, farming systems in which fillet yield is remunerated may benefit from feeding higher dietary P:E. Thus, adjusting dietary P:E towards an optimum requires context-specific cost-benefit analyses that go beyond the changes in nutrient partitioning induced.
Interplay with other dietary factors
Besides the most evident effects of changes in dietary P:E on protein partitioning, our meta-analysis also showed effects on other response variables, although with a lower predictive value. These findings illustrate the limits of dietary P:E as a predictor of fish growth performance and diet utilization. For example, our results suggest that dietary P:E is not a good predictor of dietary lipid partitioning towards lipid gain.
Therefore, the extent to which ingested lipids, carbohydrates and proteins are directed towards energy production or lipid gain depends on their relative proportions, and especially on the composition of non-protein energy (i.e., lipid-to-carbohydrate ratio), a distinction which is not made when evaluating a feed on the sole basis of its dietary P:E.
The magnitude of the effects of changes in dietary P:E on nutrient partitioning is likely to depend on another factor: the dietary amino acid profile. Fish do not have a requirement for protein, but rather for amino acids, of which the profile determines protein utilization. The closer the dietary amino acid profile is to the ideal, the more likely it is that changes in dietary P:E will affect nutrient partitioning and especially protein retention efficiency.
Protein deposition in Nile tilapia: energy dependence
In its first approach, our meta-analysis indicated that changes in dietary P:E affect protein partitioning in a linear way. The linear increase in protein retention efficiency, with decreasing dietary P:E, illustrates the protein-sparing effect of rising dietary lipid and/or carbohydrate content (i.e., non-protein energy). This phenomenon has already been reported for Nile and hybrid tilapias, and other fish species.
The data we analyzed suggest that there is no limit to the increase in protein retention efficiency when reducing dietary P:E from 30 to 9 grams per MJ in Nile tilapia feeds. This relationship was shown to be independent of feeding level in two subsequent studies in which the protein retention efficiency of Nile tilapia increased linearly with decreasing dietary P:E (16–25 grams per MJ) under both restricted and apparent satiation feeding conditions.
Altogether, these results suggest that energy availability is always a limiting factor in protein deposition in Nile tilapia. In our meta-analysis, protein gain increased linearly over most of the range of gross energy intake. However, the increase in gross energy intake cannot be distinguished from a concomitant increase in protein intake, in the present meta-analysis. It is therefore not possible to distinguish between the effects of protein or energy intake on protein gain, as shown in Fig. 1.
Protein deposition in Nile tilapia: maximal capacity
The second approach of our meta-analysis revealed a two-phase response of protein gain to increasing protein intake. This finding suggests that protein deposition is dependent on protein intake, until the latter reaches 8.4 grams per kg per day. Similar non-linear responses of protein gain to increasing protein intake were reported for other tilapia species and hybrids, but the separate effects of energy and protein availability on protein gain cannot be distinguished, neither in previous tilapia studies, nor in our present meta-analysis.
Dissolved oxygen availability and water temperature influence fish bioenergetics and are, thus, potent modulators of feed intake and growth in Nile tilapia. Reported dissolved oxygen concentrations for the eight cases where protein gain leveled off in the absence of a protein and energy limitation, ranged from 6.0 to 7.2 mg per liter. These levels are in line with recent recommendations and it is therefore unlikely that protein deposition was limited by oxygen availability in these cases. The same applies to the water temperature ranges applied to these eight cases (27.5 to 28 degrees-C), which were close to the 28 to 30 degrees-C recommended for Nile tilapia. The same oxygen and temperature ranges also applied to the 20 observations where protein gain leveled off at high crude protein intake. Thus, at the highest end of the daily protein and energy intake ranges, protein gain was neither limited by protein (20 cases), energy intake (eight cases), dissolved oxygen availability or water temperature. Instead, the plateau observed in daily protein gain may reflect the presence of a genetically determined maximal potential for protein gain.
Regarding implications for future research, there does not seem to be a single optimal balance between dietary protein and energy in Nile tilapia. This is regardless of whether protein and energy are expressed relative to each other (dietary P:E) or evaluated separately (absolute intakes). The high dietary protein requirements of most fish species have often been explained by a lack of endogenous regulation of amino acid catabolism. The fact that fish excrete excess nitrogen, the waste product of amino acid catabolism, in the form of ammonia (i.e., at lower energetic costs) means that amino acids are more efficient energy substrates to fish than they are to mammals. Under this hypothesis, the preferential use of a large proportion of ingested amino acids as an energy substrate likely leads to low protein retention efficiency in fish, regardless of energy intake levels. This is possibly even truer for carnivorous fish species, for whom protein makes up an even larger part of the natural diet than for Nile tilapia.
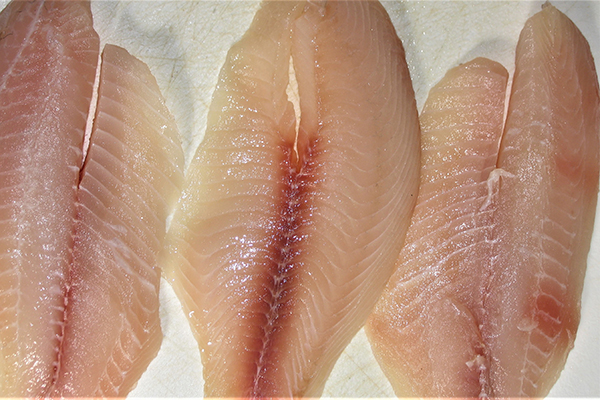
Gross protein retention efficiency ranged from 20 percent to 60 percent in our data set (Fig. 3), while simple linear and linear–plateau regression showed marginal protein retention efficiency of 35 percent and 52 percent, respectively. Here, fecal protein losses were not accounted for, and therefore these estimates probably underestimated both net and marginal protein utilization efficiencies. Thus, the apparent absence of distinct protein- and energy-dependent phases in protein deposition cannot be solely explained by the extent to which amino acids are diverted from body protein synthesis. This absence indicates that protein gain may be simultaneously limited by protein and energy availability in Nile tilapia, a hypothesis which, to our knowledge, has not been tested yet.
Finally, most data used in our meta-analysis were obtained from fish weighing less than 200 grams. Nutrient balance data for large Nile tilapia are still not available for testing areas like the absence of distinct protein- and energy-dependent growth phases across body size classes. Obtaining such data would increase the relevance of this kind of meta-analytical work since most of the feed consumed on tilapia farms is given to fish heavier than those used in laboratory studies until now.
Perspectives
Our meta-analysis demonstrated that there is no physiological optimal P:E for Nile tilapia feeds. Changes in dietary P:E primarily affect nutrient partitioning, especially that of protein. These effects are linear and, as such, do not indicate an optimum. Through its effects on protein partitioning, dietary P:E also influences fillet yield and to some extent lipid gain. The benefits of some of these effects being contradictory, determining an optimal dietary P:E is always context-dependent.
Fitting models to protein and lipid gain data did not provide strong evidence of distinct protein- and energy-dependent phases in protein deposition. This finding also contradicts the existence of a single optimal dietary P:E, above and below which growth would be limited by energy and protein availability, respectively. Our findings also indicate that protein deposition may be limited by factors other than protein and energy intake, such as a maximal genetic potential for daily protein gain.
Now that you've reached the end of the article ...
… please consider supporting GSA’s mission to advance responsible seafood practices through education, advocacy and third-party assurances. The Advocate aims to document the evolution of responsible seafood practices and share the expansive knowledge of our vast network of contributors.
By becoming a Global Seafood Alliance member, you’re ensuring that all of the pre-competitive work we do through member benefits, resources and events can continue. Individual membership costs just $50 a year.
Not a GSA member? Join us.
Authors
-

Ph.D. candidate
Aquaculture and Fisheries Group, Wageningen University and Research, Wageningen, The Netherlands -
Animal Nutrition Group, Wageningen University and Research, Wageningen, The Netherlands
-
Experimental Zoology Group, Wageningen University and Research, Wageningen, The Netherlands
-
Corresponding author
Aquaculture and Fisheries Group, Wageningen University and Research, Wageningen, The Netherlands
Related Posts
Aquafeeds
A look at phospholipids in aquafeeds
Phospholipids are the major constituents of cell membranes and are vital to the normal function of every cell and organ. The inclusion of phospholipids in aquafeeds ensures increased growth, better survival and stress resistance, and prevention of skeletal deformities of larval and juvenile stages of fish and shellfish species.
Aquafeeds
Considerations for alternative ingredients in aquafeeds
A key to expanding aquaculture is finding alternative sources of proteins and oils. Supplementing or replacing fish oil in aquaculture feeds with alternative lipid sources – oils seeds, microalgae, insects and others – appears possible as long as essential fatty acid (EFA) requirements are satisfied.
Aquafeeds
Evaluating hydrolysates as functional ingredients in Pacific white shrimp feeds
An evaluation of hydrolysates shows that cost-benefit, availability, quality and efficiency must be considered for feeding Pacific white shrimp.
Aquafeeds
Feeds affect lipid body composition, quality
The substitution of plant proteins and oils for fishmeal and fish oil can result in minimal changes to proximate compositions in various fish. However, the muscle fatty acid composition usually reflects that of the diet.