


Catch & Culture Review: How Atlantic bluefin tuna catch rates and sizes vary over space and time

Findings support regionally and seasonally targeted management and conservation, while showing the value of scientific catch-and-release fishing

Effective management of fisheries depends on reliable data describing how fish species are distributed across space and over time. Atlantic bluefin tuna (Thunnus thynnus), one of the world’s largest and most valuable commercial species, is managed internationally, yet regional information is still needed to support evidence-based decisions. Recreational catch-and-release fisheries provide a cost-effective way to study these populations while also delivering socio-economic benefits to coastal communities.
A study by Grace E. McNicholas and colleagues at Trinity College Dublin, the Marine Institute and Inland Fisheries Ireland (Ireland) reports results from an angler-based scientific catch-and-release program for Atlantic bluefin tuna operating off Ireland during the summer and autumn months since 2019.
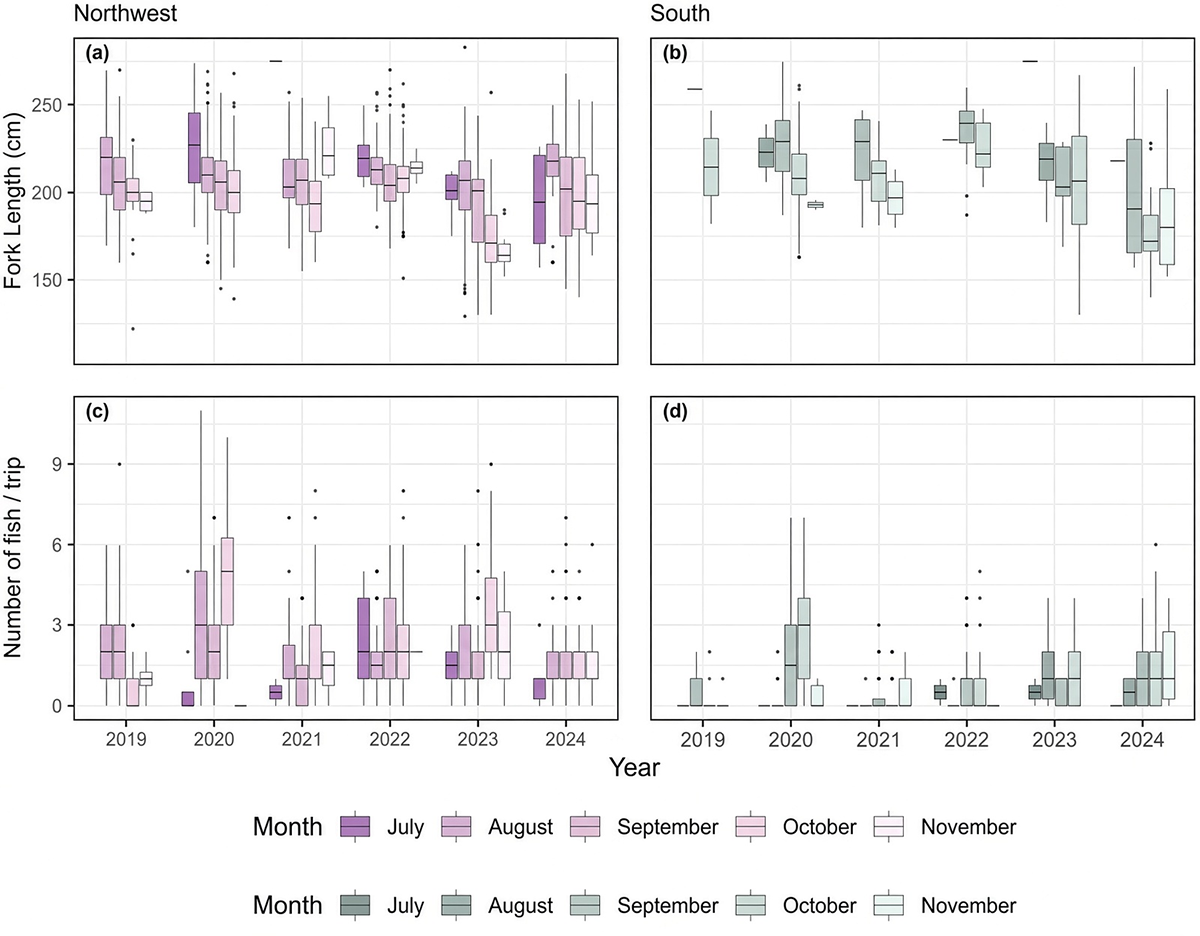
Results show that catches varied substantially from year to year in both number and size of fish along the Irish coast. The Northwest proved the most productive area, with catch rates per trip nearly twice those recorded in the South. Fish arrived slightly later in the South, where they were, on average, larger than those caught in the Northwest.
Catch rates were highest at intermediate surface temperatures of 12.5–15 degrees-C. Larger individuals were taken early in the season in warmer water, with average size declining as the season progressed into cooler autumn conditions.

Given the highly migratory nature of the species, these regional and seasonal patterns in relative abundance and size structure offer insight into the dynamics of the population in Irish waters. The observed temperature relationship also suggests that climate change could shift future distributions, with potential consequences for the long-term sustainability of the recreational fishery and the coastal communities that depend on it.
Relevance of research findings to the industry
For the recreational sector the results appear to be immediately practical. Donegal Bay has emerged as the clear hotspot, and charter operators already concentrate effort there. The temperature and seasonal signals provide boat captains with a better estimate of when and where effort is most likely to pay off, which matters when weather windows are short and clients are paying.
Because the fishery is strictly catch-and-release and data are fed into the International Commission for the Conservation of Atlantic Tunas (ICCAT; a tuna regional fishery management organization, responsible for the management and conservation of tuna and tuna-like species in the Atlantic Ocean and adjacent seas) assessments, the program also strengthens the case for continued or expanded recreational access as the stock recovers.
Coastal communities that host the authorized boats stand to gain from the tourism and local spending the fishery generates. At the same time, the marked regional differences show that a single national approach would miss important local variation. Managers and operators can use the patterns to time seasons, allocate limited authorizations, or target monitoring more efficiently.
The fact that larger fish appear early and in warmer water also identifies a potential vulnerability: if warming shifts the timing or location of peak abundance, the current July–November window and the existing ports of operation may become less effective.
Perspectives
This study is the first detailed look at spatial structure in Irish bluefin tuna catches and it shows that even within a relatively small stretch of coastline the fish are not distributed evenly. Temperature clearly matters, yet the Northwest–South difference in catch rate persists even when temperatures are similar, pointing to other factors such as prey fields, bottom type or the coastal current that may help fish move between areas. Whether the size differences reflect different age classes, stock origins or simply different feeding strategies is still open; the study data do not include ages or diets.
In the coming years, the projected temperature relationships appear to raise the possibility that climate-driven warming could alter when and where fish appear. If the preferred intermediate temperatures become rarer or shift later in the year, both catch rates and the size composition of the fishery could change. That would affect not only the scientific value of the program but also the livelihoods tied to it.
Continued tagging, better integration with prey surveys, and comparison with habitat models will help test whether these coastal patterns are stable or already in flux. For the time being, the fishery in this study remains one of the most useful, low-impact ways to keep gathering the regional data that international management still needs for the Atlantic bluefin tuna.
Moving toward ecosystem-based fisheries management despite economic limits
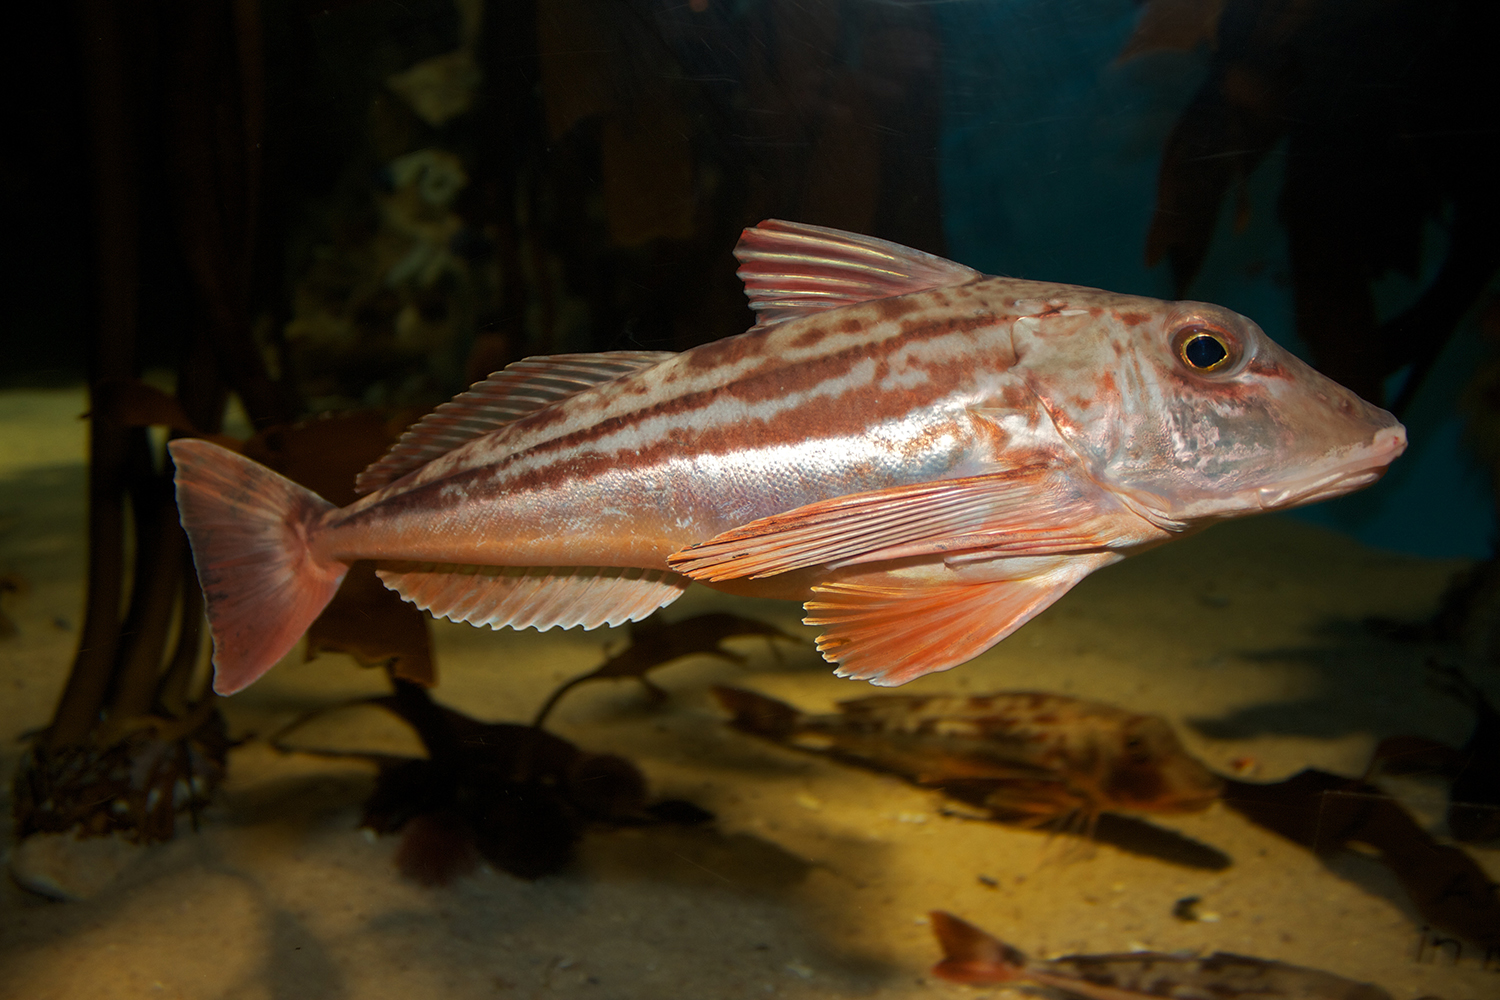
Achieving ecosystem-based fisheries management (EBFM), which aims to maximize catches while preserving the structure and functioning of ecosystems, is growing more difficult amid budget cuts and the restructuring of research and management institutions. Greater attention could therefore be given to the ecosystem approach to fisheries management (EAFM), which concentrates on individual fisheries as a practical foundation for broader EBFM.
In a study Arnaud Grüss and colleagues – at The New Zealand Institute for Earth Science Ltd., and Fisheries New Zealand Dunedin (New Zealand); the Commonwealth Scientific and Industrial Research Organisation, the University of Tasmania, the Australian Bureau of Agricultural and Resource Economics, and the Institute for Marine and Antarctic Studies (Australia); the Centre for Environment, Fisheries and Aquaculture Science (UK); and the University of California, and Hydra Scientific LLC (USA) – the authors describe an approach developed to identify useful tools for advancing the ecosystem approach to fisheries management (EAFM; incrementally adding ecosystem considerations into the existing management of a specific fishery, thereby accounting for variability in some of the ecosystem underlying that fishery) in New Zealand, and demonstrated it using the west coast South Island (WCSI) mixed bottom trawl fishery.
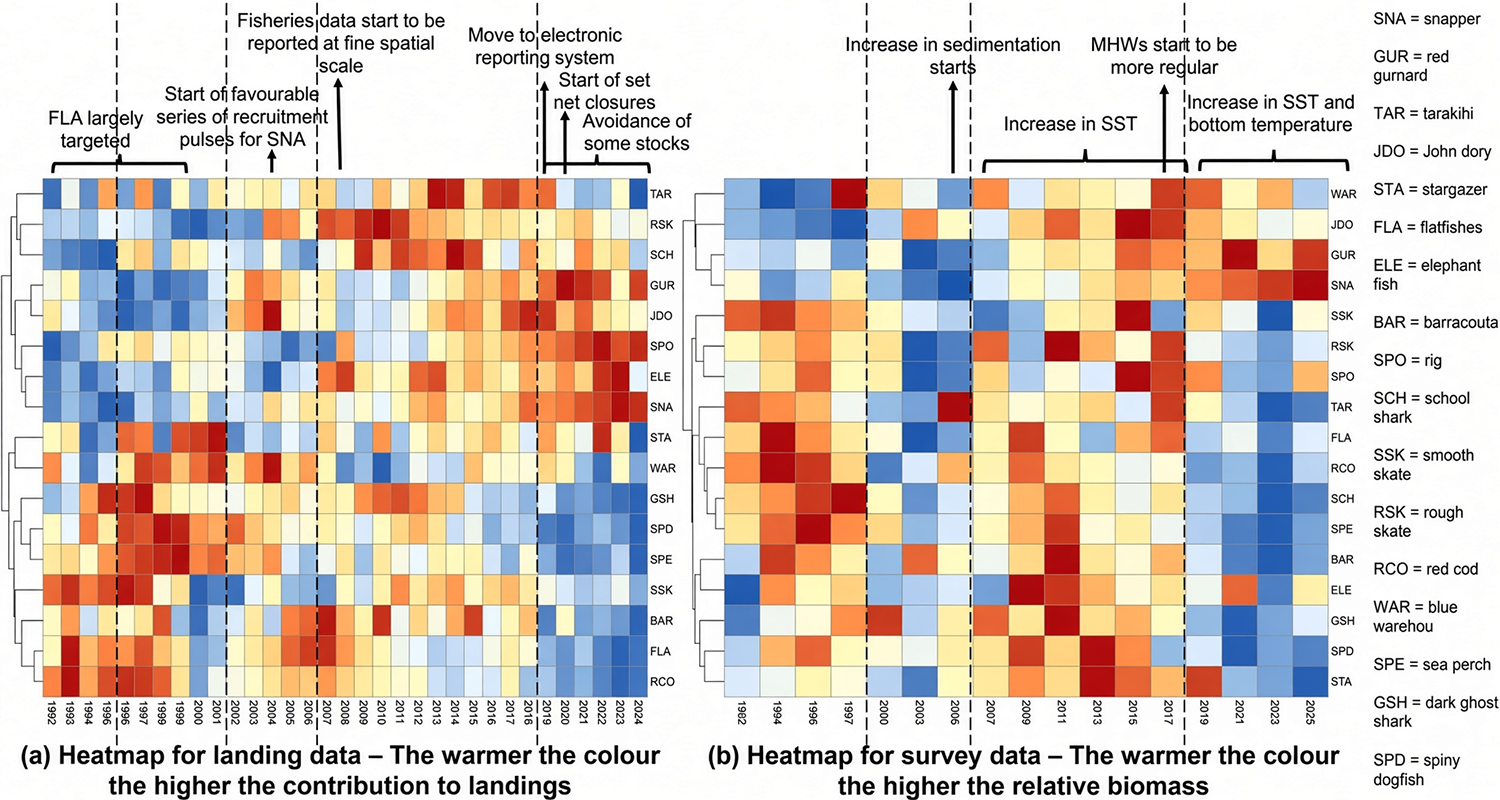
Principal component analyses (PCAs; essentially, a way of simplifying complex data so the main patterns become easier to see) and heat maps were applied to landing compositions from the fishery and to research survey biomass data. These analyses divided the past 34 years into four distinct clusters. The earliest period was characterized by particularly high biomasses and landings of flatfishes and associated bycatch species, while the most recent period saw marked increases in the biomasses and landings of the commercially valuable snapper (Chrysophrys auratus) and red gurnard (Chelidonichthys kumu).
Drawing on the literature and the knowledge of resource managers and stakeholders, the authors interpreted the year clusters in relation to natural and anthropogenic drivers. For instance, the recent rise in snapper biomass and landings may be partly linked to warming and more frequent marine heatwaves that have benefited the population.
The tools identified can help progress EAFM in New Zealand and support existing management in several ways. In particular, accessible visual analyses based on PCAs, heat maps and métier analysis (grouping fishing trips or vessels that fish in a similar way, so managers can understand the real structure of a mixed fishery) can strengthen the framework for defining fisheries by revealing catch composition as an emergent property of fishing activity. The authors recommend further application of these tools within New Zealand, and the overall approach can be adapted for use in other regions.
Relevance of research findings to the industry
For the commercial sector the results are reportedly useful in several specific ways. Operators in the WCSI mixed fishery already know that catch mixes change, but the cluster analysis quantifies those shifts and ties them to observable drivers. That information can inform day-to-day decisions about where and how to fish when one species is approaching its catch limit and others are not. It also supplies a common, visual language that managers, scientists and industry can use when discussing technical interactions, bycatch limits or the need for multi-species catch settings.
Because the tools are relatively simple and rely on data that already exist (landings and survey biomasses), they can be updated without large new research programs. In a period of constrained funding this is practical. The analyses can feed into existing processes, such as the concurrent reviews of linked stocks that Fisheries New Zealand has already trialled and help justify or refine management responses when environmental conditions change. For coastal communities that depend on the fishery, a clearer understanding of how climate and fishing interact can reduce the risk of sudden and not anticipated shifts in available catch.
Perspectives
The authors openly acknowledge the constraints on what is feasible at present. Full dynamic multi-species or whole-ecosystem models remain data- and capacity-intensive, and the paper notes that even relatively straightforward EAFM tools still require dedicated effort. Therefore, their recommendation is reasonable: invest first in robust, user-friendly methods that strengthen EAFM, then build toward more ambitious EBFM once foundations and resources allow.
They also stress that the overall approach of reviewing tools, ranking them with managers, and testing them on a real mixed fishery is transferable, and possibly other regions facing similar funding pressures could adapt the same sequence.
In the longer term, the temperature link for snappers illustrates a wider point. As marine heatwaves become more common, catch compositions in mixed fisheries are likely to keep shifting. Simple, regularly updated visual analyses of the sort presented here will not replace detailed stock assessments, but they can flag changes early and keep ecosystem considerations visible inside day-to-day management.
Continued application across other New Zealand fisheries, combined with stakeholder workshops to interpret the results, would test how far these tools can go and where more sophisticated modeling is still required.
Using acoustics to characterize and classify rockfish and walleye pollock at bottom-trawl sites in the Gulf of Alaska
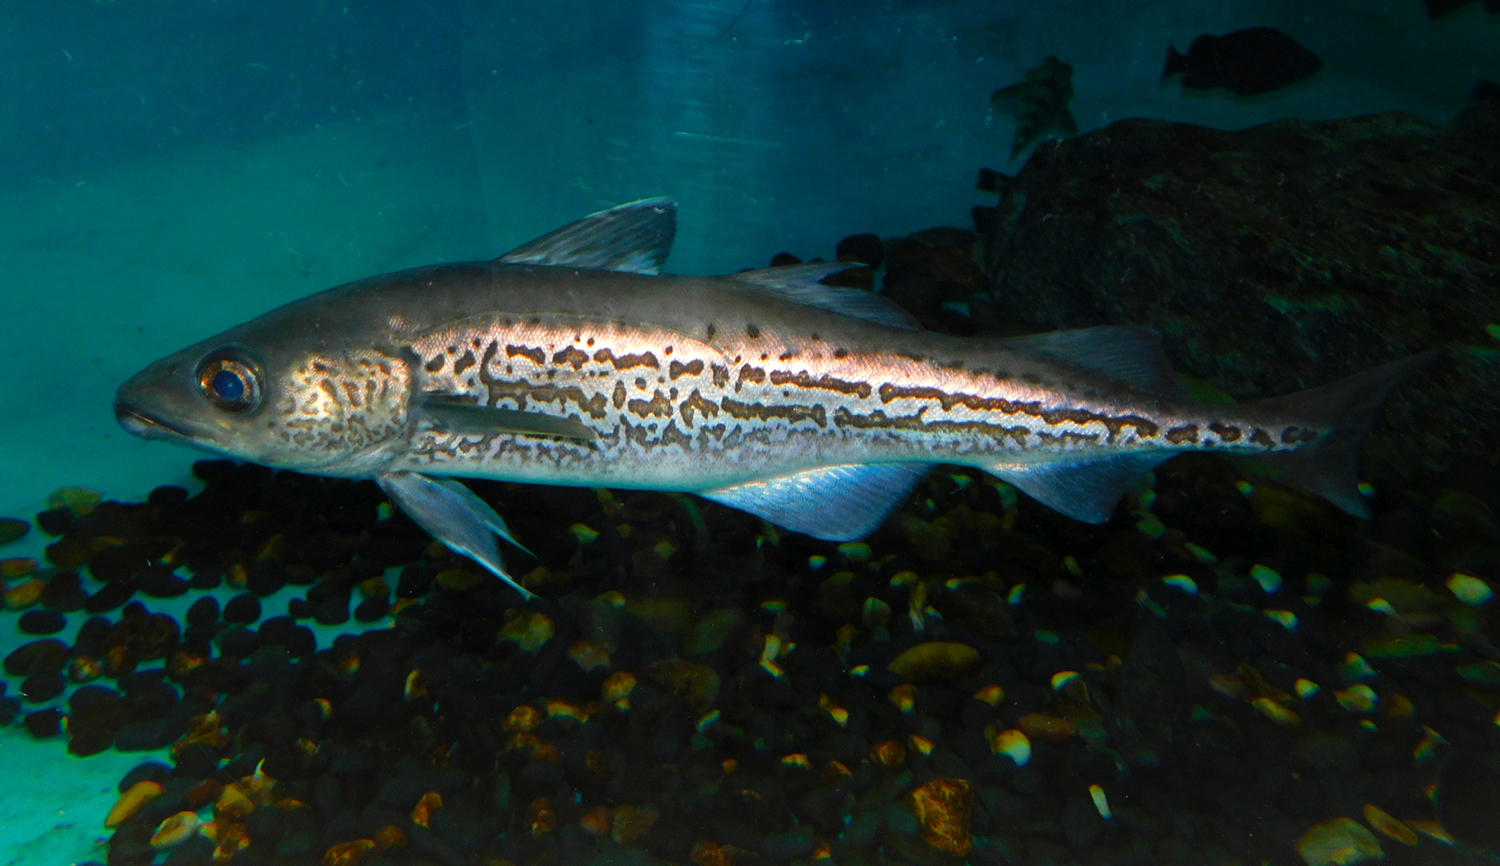
Research trawl surveys in Alaska waters show that rockfishes are often patchily distributed, which increases the uncertainty of biomass estimates from those surveys. Echosounders fitted to bottom-trawl survey vessels can supply additional acoustic data on how fish aggregate in space, information that may help improve survey design.
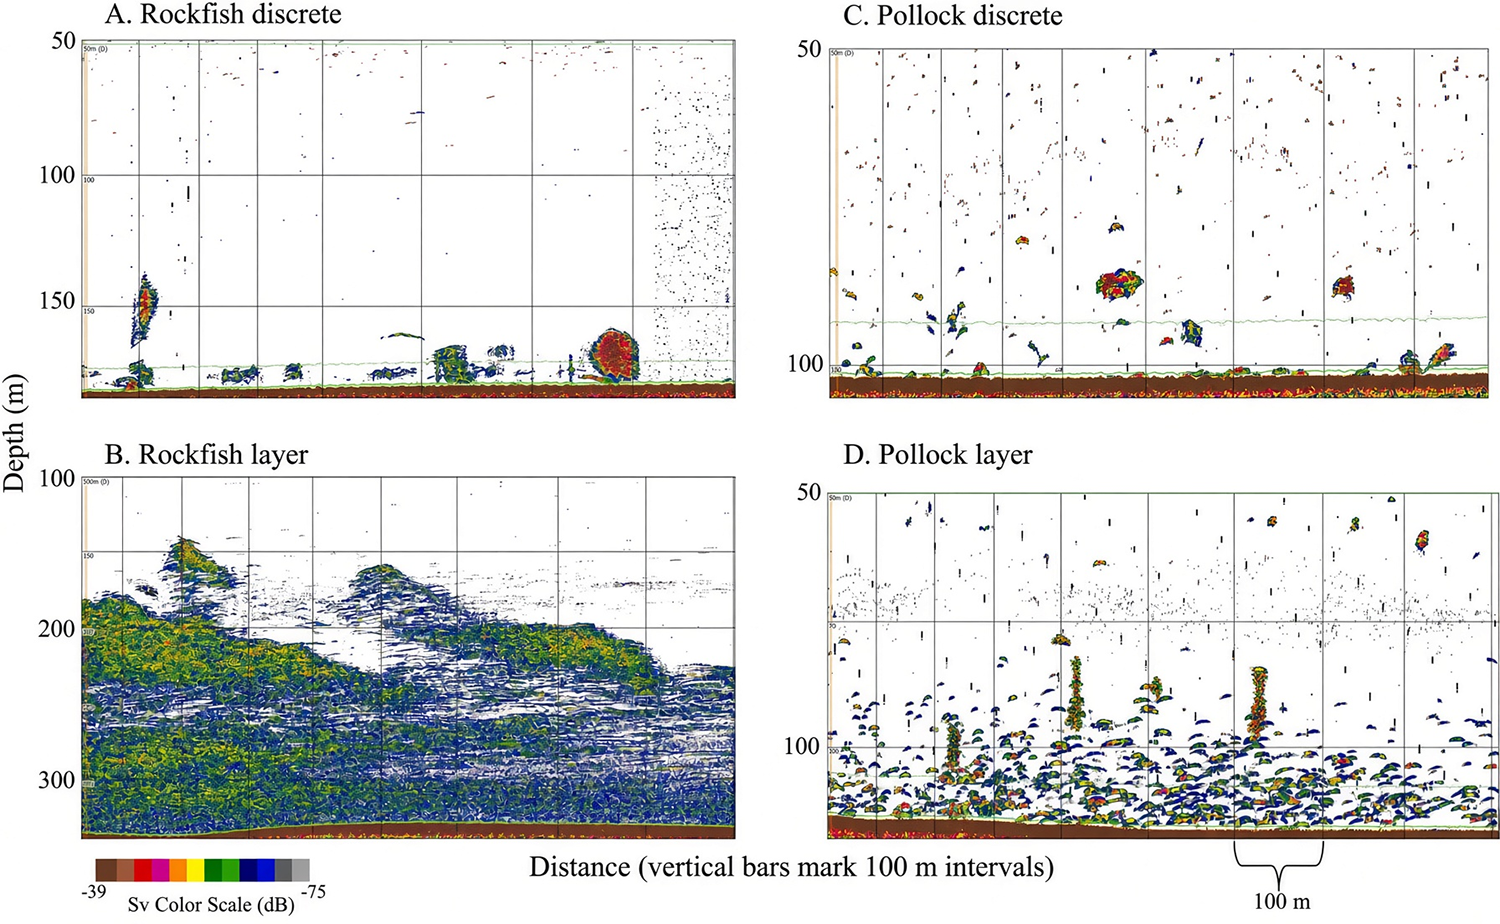
In research by Denise R. McKelvey and colleagues at the Alaska Fisheries Science Center of the National Marine Fisheries Service (USA), the authors examined acoustic backscatter recorded at demersal trawl locations in the Gulf of Alaska. They described aggregation patterns at tows that were either at least 80 percent rockfish (Sebastes spp., mostly Pacific Ocean perch, Sebastes alutus) or at least 80 percent walleye pollock (Gadus chalcogrammus), a species that commonly co-occurs with rockfish in Alaskan waters. And they used random-forest classification (a machine learning method that uses many decision trees working together to classify data into categories) to distinguish the two species’ aggregations.
The researchers also compared near-bottom acoustic backscatter along the tow path with demersal catches of mixed species in four depth strata: 100–150 meters, 150–200 meters, 200–250 meters and > 250 meters. The data came from groundfish bottom-trawl surveys and from a dedicated rockfish bottom-trawl survey.
Aggregations at monospecific tows varied in shape, depth and acoustic intensity. Two broad types were identified according to length (those longer or shorter than 800 meters) and roughly 90 percent of both rockfish and pollock aggregations were shorter than 800 meters. A patch index based on aggregation length was developed; values below 0.3 were correlated with the natural log of catch per unit effort.
Using only the acoustically derived aggregation metrics, a random-forest model correctly classified rockfish versus pollock aggregations 85 percent of the time. When bottom depth and bottom temperature were added, classification accuracy rose to 89 percent. These results suggest that acoustic aggregation patterns could help identify species within bottom-trawl survey designs, although further work is needed on mixed-species aggregations in which neither rockfish nor pollock dominates.
Correlations between acoustic backscatter and demersal catches of mixed species during the groundfish surveys were consistently strong in the 150–200-meter depth stratum. This indicates that, in that depth range, a two-phase sampling design that uses acoustic backscatter as an auxiliary variable to inform catch estimates could improve the precision of abundance estimates for both pollock and rockfish.
Relevance of research findings to the industry
For the commercial and assessment sectors the findings suggest a practical opportunity. Bottom-trawl surveys are expensive, and rockfish estimates are particularly variable because of their patchy distribution. If acoustic data already being collected on survey vessels can help identify species aggregations and refine sampling, it could reduce the number of tows needed or improve the precision of the estimates that are used in stock assessments.
Pollock and rockfish support important fisheries in the Gulf of Alaska. More precise abundance indices would give managers better information when setting catch limits, and industry operators would benefit from lower uncertainty around the status of the stocks. And because the method used in this study relies on existing echosounders rather than new hardware, the incremental cost is relatively low. A two-phase design that uses acoustics to guide or weight the trawl sampling could be especially useful in the 150–200-meter stratum, where the correlation with catch was strongest.
Perspectives
The results show clear potential, but the authors emphasize that mixed-species aggregations still need more research work. In real surveys many tows contain a mix of species, and the acoustic signature becomes harder to interpret when neither rockfish nor pollock dominates. Extending the classification to these more typical situations should be the next practical approach by researchers.
There is also scope to test the approach on a wider range of years and locations, and to explore whether other acoustic features, or combinations with environmental data, can push classification accuracy higher. If the method holds up, it could be incorporated into routine survey design, either by adjusting station spacing where aggregations are detected or by using backscatter as an auxiliary variable in abundance estimation.
In the longer term, better use of the acoustic data already streaming from survey vessels offers a relatively low-cost way to tighten the estimates that underpin management of two commercially important species. Overall, the results of this study demonstrate that the acoustic patterns are informative, but authors point out the need to study how far this approach can be pushed before the gains in precision level off.
Now that you've reached the end of the article ...
… please consider supporting GSA’s mission to advance responsible seafood practices through education, advocacy and third-party assurances. The Advocate aims to document the evolution of responsible seafood practices and share the expansive knowledge of our vast network of contributors.
By becoming a Global Seafood Alliance member, you’re ensuring that all of the pre-competitive work we do through member benefits, resources and events can continue. Individual membership costs just $50 a year.
Not a GSA member? Join us.
Author
-

Editor Emeritus
Related Posts
Fisheries
Catch & Culture Review: Worldwide genome-wide genetic diversity and population structure of mahimahi
This review of recent fisheries literatures explores population dynamics of mahimahi, marine protected areas and sea scallop adaptation.
Fisheries
Analysis of pelagic tuna fisheries management in China
Although a range of supervisory management measures have been implemented over nearly four decades, its regulatory framework should be improved.
Fisheries
Beyond bait: Fisheries innovators use light, behavior and biology to reduce impact
Fisheries innovators are exploring “baitless” systems using visual stimuli, species-specific responses and gear design to draw in target species.
Fisheries
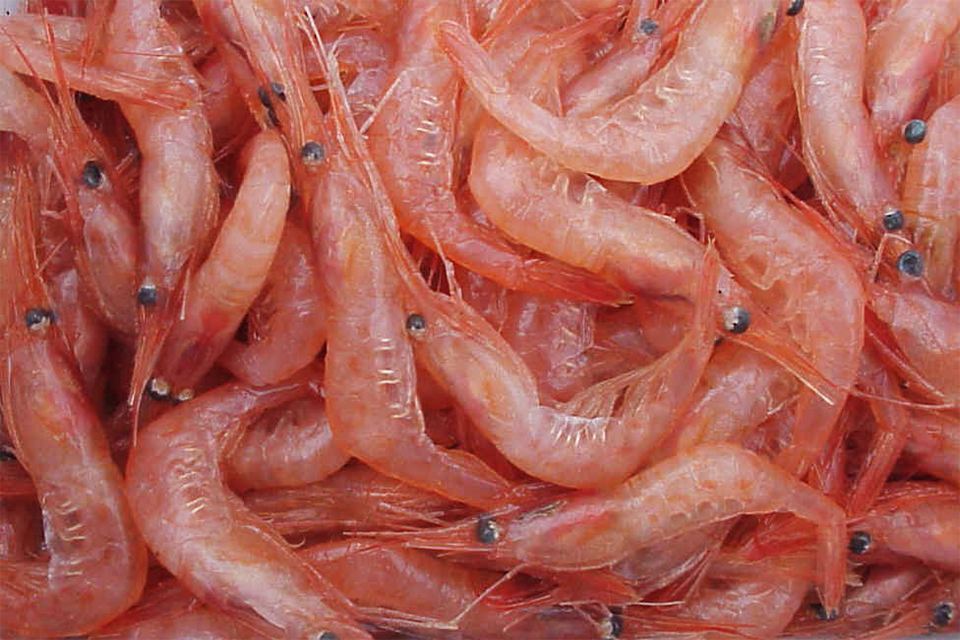
Using broadband hydroacoustics to identify Atlantic cod, polar cod and northern shrimp
Pelagic organisms can be discriminated using the complexity of their target spectra, which machine learning algorithms can efficiently identify.