Trace minerals in tilapia fillets, part 1
Results from evaluation of samples from U.S. markets
Fish is a protein-rich food increasingly favored by consumers, and being packed with nutrients, can play an incredible role in fighting the malnutrition problem, one of the biggest issues facing the world. Fish are not only rich in high quality protein but are also one of the primary sources of omega-3 polyunsaturated fatty acids (PUFAs), which can decrease cardiovascular disease and are essential for brain development. In addition, fish are good sources of highly bioavailable micronutrients such as minerals and vitamins that play important role in human health, growth and development and disease prevention. However, the important role of fish as a dietary source of micronutrients is poorly recognized and under-evaluated.
As the aquaculture industry is growing it is embracing a nutrition sensitive approach and is moving beyond maximizing productivity to improving nutrition and health of the animal. Production of healthier fish with better nutritional quality can in return improve the health of human consumers.
This article – adapted and summarized from the original publication – reports on a study where a market survey was conducted to evaluate the mineral and heavy metal composition of tilapia fillets available in the U.S. marketplace and provide information for consumers on potential contribution of consumption of tilapia fillet to mineral contents of their diets. After the market study, a fish trial was conducted to evaluate the effect of selenium species as functional ingredients in the diet of Nile tilapia (Oreochromis niloticus) – these results will be reported in part two of this article.
This study was funded by Virginia Tech’s College of Agriculture and Life Sciences John Lee Pratt Animal Nutrition Program and Interdisciplinary Graduate Education Program (IGEP) water INTERface. The authors also would like to thank Daniel Taylor for help in designing and building the RAS system.
Study setup: market study
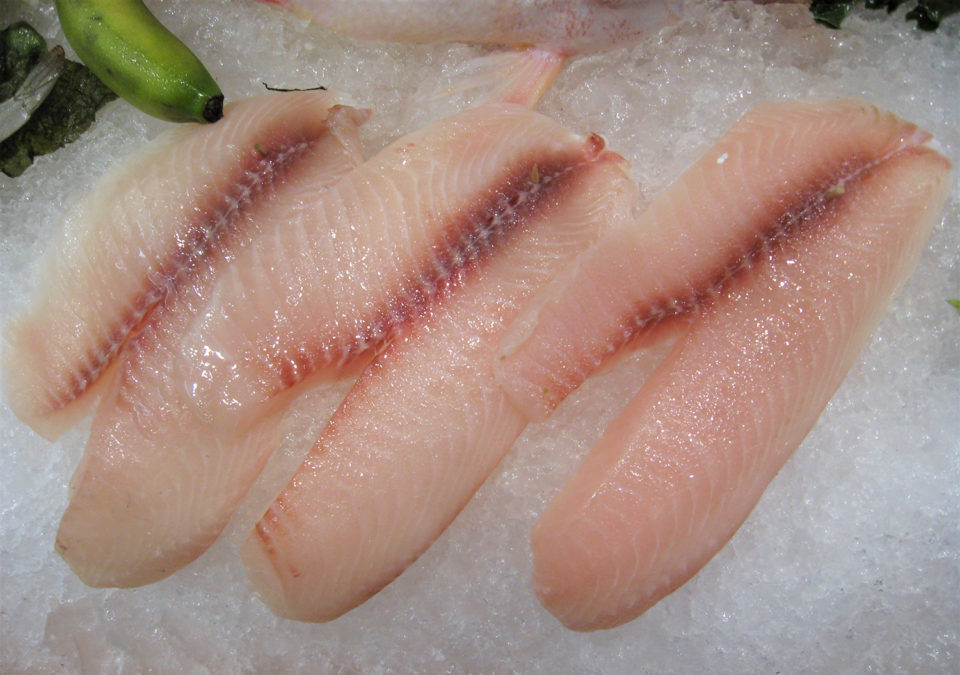
Twelve tilapia samples were purchased from various grocery stores in four different regions of the United States. Samples were collected from the mid-Atlantic (Blacksburg, Va.), mid-west (Chicago, Ill.), northeast (Boston, Mass. and New York City, NY) and southeast regions (Plano, Texas). Data regarding type of culture (wild caught versus farmed raised), country of origins, price, product certification and fish condition were recorded upon purchase. Samples were freeze-dried and stored at minus-20 degrees-C in accordance with United States Environmental Protection Agency (USEPA) guidance for fish tissue analysis. Freeze-dried samples were microwave digested and mineral concentrations were measured using several methods.
For detailed information on the fillet samples; reagents and materials; microwave digestion; Inductively Coupled Plasma Mass Spectroscopy (ICP-MS); health benefit value of selenium (HBV); and risk and nutritional assessment, please refer to the original publication.
Results and discussion
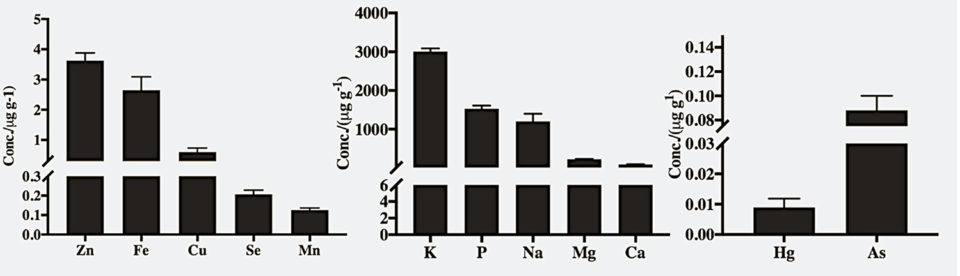
Eleven of the 12 tilapia samples available in U.S. marketplace were farm-raised, and China was the main country of origin. Good recovery of analyte was achieved for digestion of all the samples using microwave-assisted digestion. The recovery values of reference material were between 87 and 111 percent for the elements that were being analyzed. Concentrations of essential and trace minerals and soft electrophiles in tilapia fillets are presented in Fig 1. The major microelements were potassium (K), phosphorus (P), sodium (Na), magnesium (Mg) and calcium (Ca), followed by the micronutrients zinc (Zn), iron (Fe), arsenic (As), selenium (Se), copper (Cu) and manganese (Mn), and the heavy metals mercury (Hg), arsenic (As) and cadmium (Cd).
On the health benefit value of selenium, the tilapia fillets had a positive Health Benefit Value (HBV) for selenium (HBVSe) of 11.83 ± 4.95. And regarding their contribution to the dietary Reference Intake (DRI), the contribution of tilapia fillets per 100 g serving to mineral’s DRI is summarized in Table 1 for children and adults. Tilapia fillets provide more than 10 percent of the DRI of P, Se and Na for adult, and more than 10 percent of the DRI of Cu, Mg, P, Se and Na per 100 g of serving for children.
Farzad, Tilapia, Table 1
| Subject | Ca | Cu | Fe | Mg | Mn | Mb | P | Se | Zn | K | Na |
|---|---|---|---|---|---|---|---|---|---|---|---|
| Children | 0.93 | 13.60 | 2.65 | 17.57 | 0.08 | 1.29 | 31.50 | 68.90 | 7.26 | 8.08 | 10.50 |
| Male | 0.82 | 6.93 | 2.94 | 5.93 | 0.63 | 0.66 | 17.80 | 39.00 | 1.45 | 6.14 | 12.60 |
| Female | 0.80 | 6.93 | 2.04 | 7.32 | 0.63 | 0.66 | 17.80 | 39.00 | 4.54 | 6.14 | 12.60 |
The concentrations of minerals of tilapia fillet of this study were compared with USDA composition data for raw tilapia fillets, which is shown in Table 2. Tilapia fillets from the market survey had significantly different concentrations of Ca, Fe, Mg, Mn, K, Na, Cu, and Zn compared to USDA composition data.
Farzad, Tilapia, Table 2
| Mineral | Market Study Data | USDA Composition Data |
|---|---|---|
| Ca | 9.2 ± 0.3 | 14 |
| Fe | 0.26 ± 0.04 | 0.69 |
| Mg | 17 ±0.7 | 34 |
| P | 116 ± 7.8 | 204 |
| K | 303 ± 7.6 | 380 |
| Na | 125 ± 20 | 56 |
| Zn | 0.35 ± 0.2 | 0.41 |
| Cu | 0.059 ± 0.006 | 0.075 |
| Mn | 0.012 ± 0.0004 | 0.037 |
Among the main elements of 12 commercially available tilapia samples in the U.S. marketplace that were analyzed, K had the highest concentration followed by P, Na, Ca, Mg. Previous studies have shown that higher concentration of Na than K in the diet can significantly increase the risk of cardiovascular disease. The concentration of Na was lower than K in all the tilapia fillets samples of the present study, showing that these products from marketplace are good choices for a healthy diet.
Total concentrations of As, Cd and Hg were measured and compared to food safety standards, showing that the studied fish products do not pose health risks associated with heavy metal exposures. Cadmium concentration in all the samples were below detection limits, which agrees with previous research that found only trace amounts of Cd in tissues of aquatic organisms.
In nature, As exists in both organic (i.e. arsenobetaine and arsenocholine) and inorganic forms; however, in fish tissue it is present mostly in organic forms, which are less toxic than the inorganic species. The tilapia fillet total As (organic and inorganic) concentration was significantly lower than the USEPA limit of 1.3 mg per kg (wet weight) in freshwater fish for human health protection.
Mercury is one of the most toxic heavy metals in the environment. Methylmercury (MeHg) is a contaminant in fish that can pose risks to humans, and high exposures can have severely adverse effects on the central nervous system, particularly the developing brain of fetuses. However, instead of harm, epidemiological studies have consistently found that increasing Hg exposures from maternal consumption of ocean fish during pregnancy result in substantial maternal health benefits and improved neurological outcomes in their children. Clearly, it is not the increased Hg exposures that were responsible for these positive health outcomes. Instead, the improved neurological development, motor abilities, verbal intelligence, perception, social behavior and diminished hyperactivity appear to be due to improved maternal intakes of nutrients such as omega-3 fatty acids and selenium, which are abundant in ocean fish.
Mercury concentrations in tilapia fillets analyzed in the market survey were similar to the U.S. FDA report on Hg concentrations of fish and shellfish. The U.S. FDA action level for Hg is 1.0 mg per kg (ppm wet weight), but many countries have level of 0.5 mg per kg as acceptable Hg concentration in fish tissue. Mercury concentration in all the tilapia fillets in this study were under 0.5 mg per kg.
Recent studies have shown that fish rich in selenium provide healthy nutrients while minimizing risks associated with Hg exposure. Therefore, in addition to total Hg measurement, the Hg health risk associated with consumption of tilapia from U.S. marketplace was investigated by measuring the Health Benefit Value, HBV. This criterion considers both Se and Hg concentrations and is proposed as a more reliable risk assessment index in regard to Hg exposures. Tilapia fillets had positive HBVs, which is an indication that health benefits outweigh risks related to Hg exposures.
The mineral contribution to DRI per 100 gram serving for essential and trace minerals were calculated. Food that provide more than 10 percent of a nutrient per serving are considered good source of that nutrient. Tilapia fillets from the U.S. marketplace of this study can provide more than 10 percent of the select minerals including Se, P for adult and Cu, Mg, P, Se for children and hence are considered good source of these minerals.
The comparison of mineral concentrations in tilapia fillets from marketplace to USDA composition data for raw tilapia fillets showed that tilapia fillets from this market survey had different concentrations of Ca, Cu, Fe, Mg, Mn, K, Na and Zn compared to USDA composition data (Table 2). These differences can be explained by factors such as the geographical variations, types of the diet, the environment that fish were raised in and differences in the methods that has been used to measure the minerals.
Now that you've reached the end of the article ...
… please consider supporting GSA’s mission to advance responsible seafood practices through education, advocacy and third-party assurances. The Advocate aims to document the evolution of responsible seafood practices and share the expansive knowledge of our vast network of contributors.
By becoming a Global Seafood Alliance member, you’re ensuring that all of the pre-competitive work we do through member benefits, resources and events can continue. Individual membership costs just $50 a year.
Not a GSA member? Join us.
Authors
-

Department of Food Science and Technology
Virginia Polytechnic Institute and State University
Blacksburg, Virginia, USA -
Corresponding author
Department of Food Science and Technology
Virginia Polytechnic Institute and State University
Blacksburg, Virginia, USA -
Department of Biomedical Sciences and Pathology
Virginia-Maryland College of Veterinary Medicine
Blacksburg, Virginia, USA -
Department of Food Science and Technology
Virginia Polytechnic Institute and State University
Blacksburg, Virginia, USA -
Department of Earth System Science & Policy
University of North Dakota
Grand Forks, North Dakota, USA -
Department of Food Science and Technology
Virginia Polytechnic Institute and State University
Blacksburg, Virginia, USA -
Department of Fisheries and Wildlife Sciences
Texas A&M University
College Station, Texas, USA
Related Posts
Aquafeeds
A new nutrient for aquaculture, from microbes that consume carbon waste
Biotechnology firm NovoNutrients aims to produce a line of nutraceutical aquafeed additives as well as a bulk feed ingredient that can supplement fishmeal. Its process includes feeding carbon dioxide from industrial gas to a “microbial consortium” starring hydrogen-oxidizing bacteria.

Responsibility
A review of water quality improvement products
Prof. Boyd examines products used by aquafarmers to improve water quality and conditions in their ponds and discusses their efficacy.
Health & Welfare
Organic acids in aquafeeds: A potential substitute for antibiotics
Prophylactic use of antibiotics in animal production is being banned or restricted by many countries. A potential substitute for antibiotic growth promoters in aquafeeds is organic acids, which are the focus of much research and commercial interest.

Responsibility
Trace metals toxic at high concentrations
Excessive concentrations of trace metals, especially copper, are toxic to phytoplankton and other aquatic plants. The ionic forms of trace metals are toxic to fish and other aquatic animals, but soluble, chelated trace metals are relatively non-toxic.