Sediment accumulation in earthen shrimp ponds
Research in New Caledonia shows effects of wind, aeration, stocking density
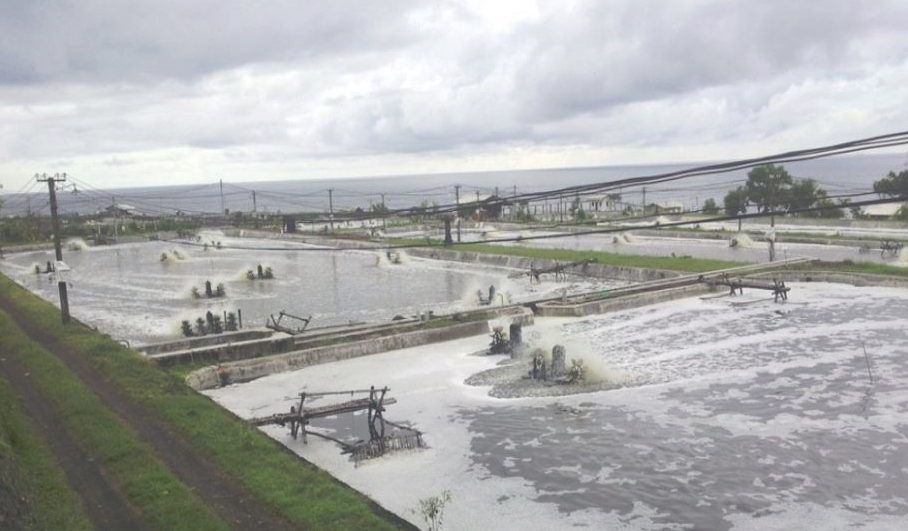
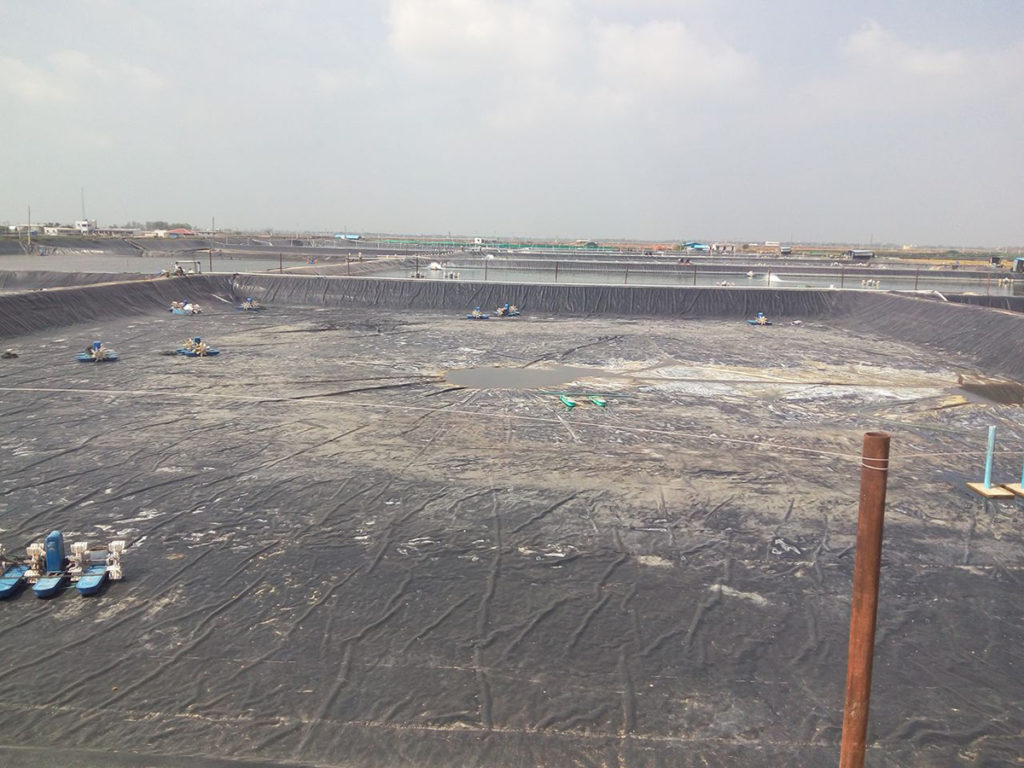
Shrimp farming in New Caledonia currently involves ten operating farms covering 450 ha and production of about 1,800 tons of shrimp (Litopenaeus stylirostris) in 1999/2000. The two grow-out techniques used are semi-intensive (7- to 11-ha ponds without aeration) and intensive (3- to 4-ha ponds with aeration). Production decreases have been observed several times during the last few years. Pond soil is considered an important factor influencing water quality and production, and farm managers suspect pond bottom degradation and sediment accumulation as possible causes for these production decreases.
Sampling, analysis
To evaluate this possibility, a sediment study was carried out on 13 earthen ponds from seven farms to assess the amount of sediment accumulated after one to 21 crops. Ten to fifteen soil core samples per pond were collected from various locations of each pond.
Sediment horizons
To study the horizons, core samples were divided into the following segments: 0-1 cm, 1-2 cm, 2-4 cm, 4-8 cm and 8 to 12 and 12 to 16 cm for the thickest cores. Density and water content of each segment were analyzed, and the amount of accumulated dry sediment was calculated considering the thickness, density and water content of the sediment.
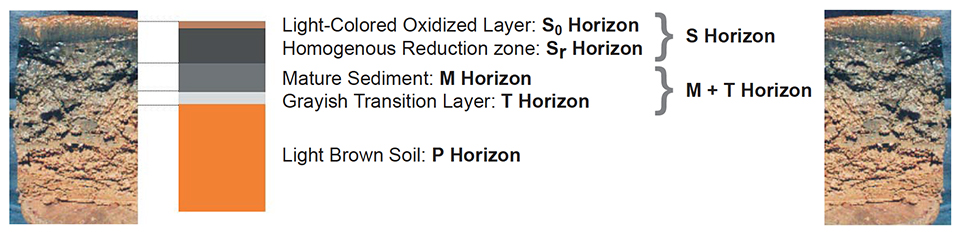
Core sampling shows five different layers (as described by Munsiri et al. 1995, Fig. 1). From top to bottom we observed:
- a brown film called the S0 horizon at the water-sediment interface
- a homogenous reduction zone called the Sr horizon
- a mature sediment called the M horizon
- a grayish transition layer called the T horizon
- a light-brown layer at the bottom of the core made of the so-called “original soil,” the P horizon, left intact by aquaculture activity.
Data on the thickness of the S horizon, of the (M + T) horizons and the amount of total accumulated sediment (S + M + T horizons) over the original soil for each pond are available from the first author.
S horizon
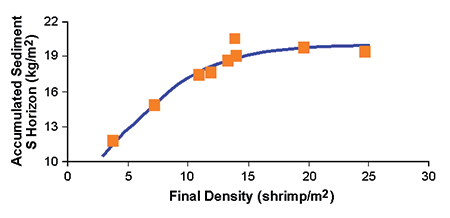
Thickness of the S horizon ranged from 1.3 to 2.2 cm. This layer was derived from sediment buildup over the grow-out period. Increasing shrimp density contributed to a significant buildup of the S horizon (Fig. 2) and a reduction of the M horizon. This effect was attributed to increasing bioturbation of the pond bottom with increasing animal density.
M + T horizon
This horizon is characterized by dark clumps of mud due to the effect of pond bottom tilling between crops. Thickness ranges from 3.1 to 4.8 cm. Rocky zones that could not be plowed in some ponds may explain differences between ponds.
S + M + T horizons
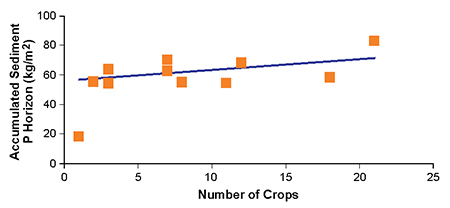
Thickness of total accumulated sediment ranges from 2.0 to 6.7 cm, corresponding to an accumulation of 18 and 83 kilograms per square meter of dry sediment, respectively (Fig. 3). The sediment accumulated during crops 1 and 2 probably came from the pond walls. From crop 2, silting up in the pond was not significant.
Sediment distribution
To study the sediment distribution within a pond, thickness of total sediment accumulated on the original soil was classified according to six levels: 0-2 cm ; 2-4 cm ; 4-6 cm ; 6-8 cm ; 8 to 10 cm ; 10 to 15 cm and 15 to 20 cm. Frequency of each level was calculated.
Heterogeneous distribution
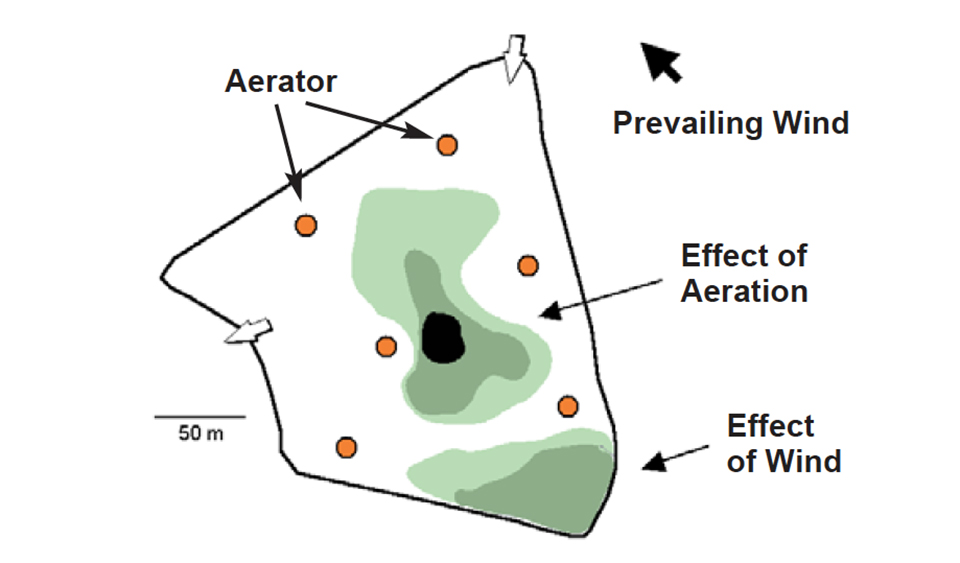
Distribution of sediment on the pond bottom was often heterogeneous, with more or less extended zones of sludge deposition (Fig. 4). Distribution depended on the intensity and pattern of water circulation (natural and/or managed), with small clay particles settling down where water movement was reduced.
Wind
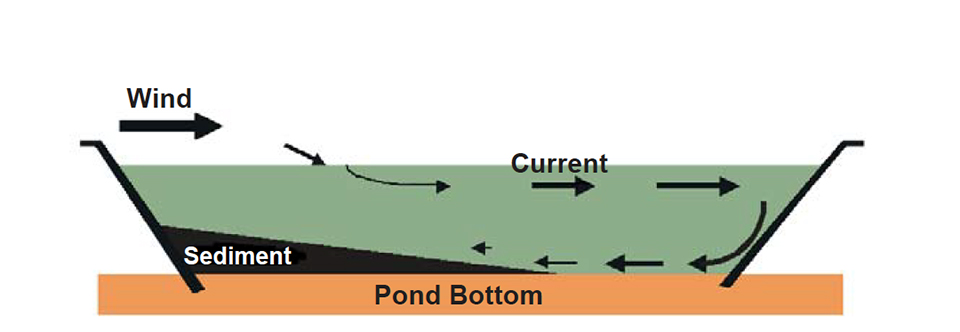
Wind was the main factor influencing water circulation within ponds (Fig. 5). It had a direct effect on sediment deposits in all ponds, aerated or not. If the prevailing wind blew along the long axis of the pond, and/or the pond was wide, heterogeneity of sediment distribution could increase dramatically (Fig. 6A). In extreme cases, wind could result in serious pond bottom erosion.
Other factors
The aeration level applied in intensive ponds played an important role in sediment distribution. It concentrated a sludge mound (Fig. 6B), either in the center of the pond when a circular water current was generated, and/or along one pond wall when it was combined with wind action (Fig. 4). Water inlets also had a direct effect on sediment distribution. Pond bottom topography, especially “higher zones,” tended to channel the water flow and thus influence silt distribution.
Homogeneous distribution
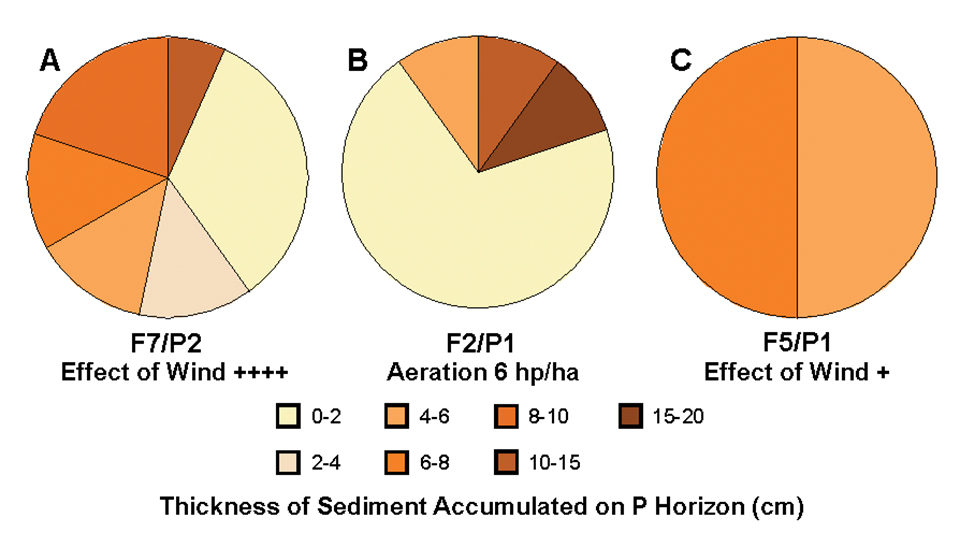
Sediment distribution on the pond bottom was homogenously distributed over the whole pond surface (Fig. 6C) when wind was not a factor or when water circulated against the prevailing wind.
Conclusion
Sediment accumulation on the bottom of shrimp ponds increased dramatically as stocking density increased from 4 to 14 per square meter. However, the accumulation plateaued in the density range from 14 to 25 per square meter, due to the effects of bioturbation. The effects of wind and/or aeration on water circulation helped to maintain and transport these particles to quiescent zones within the pond where they setttled out. In some cases, this resulted in a strong heterogeneity of sediment accumulation on the pond bottom.
Sediment accumulation patterns and their evolution result from pond design (orientation, size, water-inlets position, topography) and management applied by the farmer (shrimp density, aeration level and aerator positioning). After several years of activity, the resulting spatial heterogeneity leads to problems regarding harvest, dry out and plowing management. Results of our study did not show an increase in siltation of the pond with successive crops. In addition, no relation was found between the quantity of accumulated sediment and the yield of shrimp.
(Editor’s Note: This article was originally published in the October 2001 print edition of the Global Aquaculture Advocate.)
Now that you've reached the end of the article ...
… please consider supporting GSA’s mission to advance responsible seafood practices through education, advocacy and third-party assurances. The Advocate aims to document the evolution of responsible seafood practices and share the expansive knowledge of our vast network of contributors.
By becoming a Global Seafood Alliance member, you’re ensuring that all of the pre-competitive work we do through member benefits, resources and events can continue. Individual membership costs just $50 a year.
Not a GSA member? Join us.
Authors
-

IFREMER
BP2059 98846 Nouméa
New Caledonia -
IFREMER
BP2059 98846 Nouméa
New Caledonia -
IFREMER
BP2059 98846 Nouméa
New Caledonia -
IFREMER
BP2059 98846 Nouméa
New Caledonia
Related Posts
Responsibility
A look at various intensive shrimp farming systems in Asia
The impact of diseases led some Asian shrimp farming countries to develop biofloc and recirculation aquaculture system (RAS) production technologies. Treating incoming water for culture operations and wastewater treatment are biosecurity measures for disease prevention and control.
Health & Welfare
Alfalfa concentrate: natural shrimp color enhancer
Adding alfalfa concentrate containing natural carotenoids and pigments to the finishing diets of shrimp can enhance coloration of shrimp after cooking.
Responsibility
Appraising pond liners for shrimp culture
The use of plastic-lined ponds by shrimp farmers can significantly improve production efficiency, support more production cycles per year, and higher mechanical aeration rates and stocking densities. The capital cost of lining ponds can be very significant, so a thorough feasibility analysis is recommended when considering this production tool.
Intelligence
Aquaculture key to increasing seafood supplies to Arab states
Arab States have substantial natural resources to increase aquaculture production. Several types of systems are readily adaptable and can be implemented relatively quickly.