Performance, economics of tilapia cage culture in Brazil
Study evaluates effects of various stocking densities
Brazil has 12 percent of the world’s freshwater resources, with an estimated 6 million ha of man-made reservoirs, most of which are associated with hydropower plants. The southeastern part of the country has 2.35 million ha of these large reservoirs that, if managed as proposed by Beveridge (1984) and Schmittou (1993), could yield an estimated 4.9 to 14.1 million metric tons of farmed fish and fisheries products.
Cage fish farming is an excellent way to utilize lakes and reservoirs otherwise unsuitable for conventional aquaculture. With adequate management of carrying capacity, cage fish farming can be carried out with minimal harm to the environment.
Reservoir study
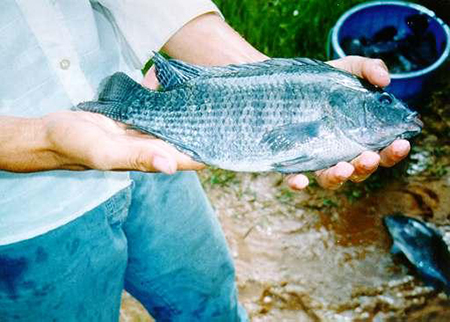
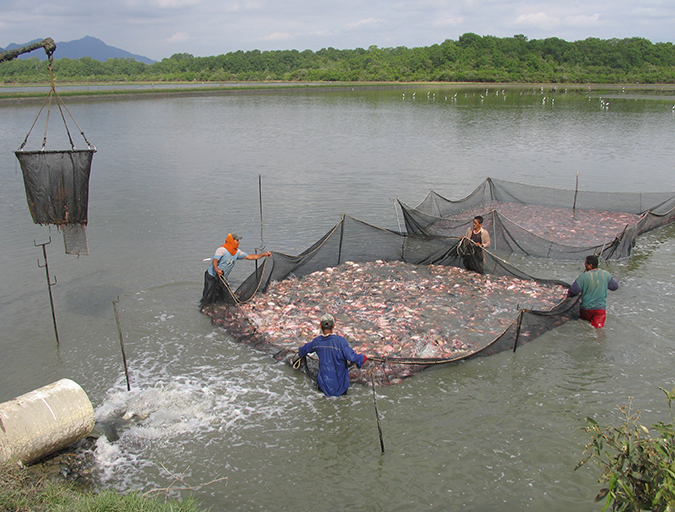
The authors recently carried out a study on the performance and economics of cage farming Nile tilapia (Oreochromis niloticus) in southeast Brazil. This research evaluated the influence of different stocking densities – 300-400 and 500 to 600 fish per cubic meter – under commercial production conditions. The study was carried out in the 3.3-ha, 4.0-meter-deep reservoir of Chapadao and that of Colonia Nova, an 8.8-ha, 2.6-meter-deep reservoir.
The Chapadao reservoir had nine cages with a total volume of 94.5 cubic meters, and Colonia Nova had 27 cages with a volume of 235.7 cubic meters. Feed consumption, fish survival rate, and water temperature were recorded daily during scheduled feeding from September 2001 to April 2002. Dissolved oxygen, pH, and water transparency were re-corded every 15 days.
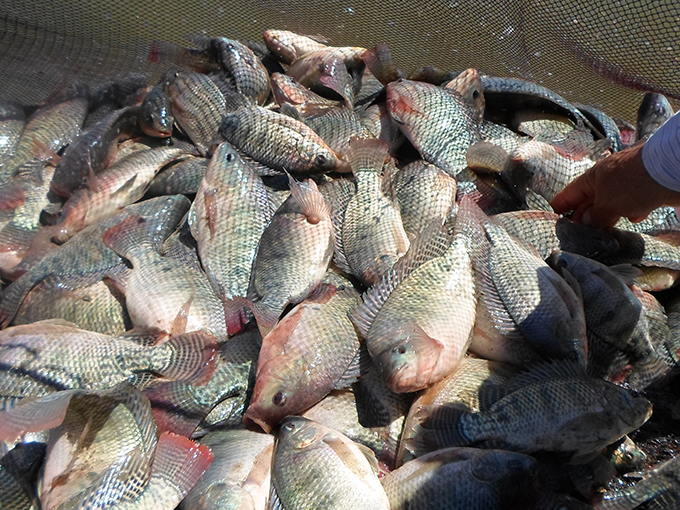
Fish growth was evaluated monthly by weighting a 3 percent sample of the population. The caged tilapia were fed commercial floating pellets with 32 percent crude protein two times every day. Feeding rate was adjusted based on sample weight and survival rate.
Results
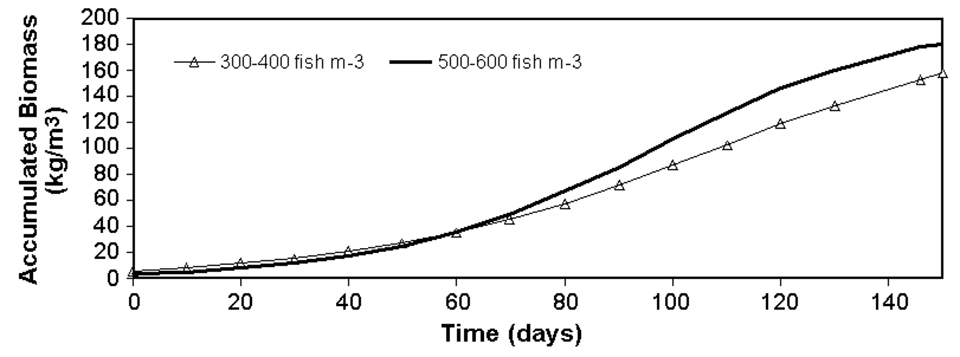
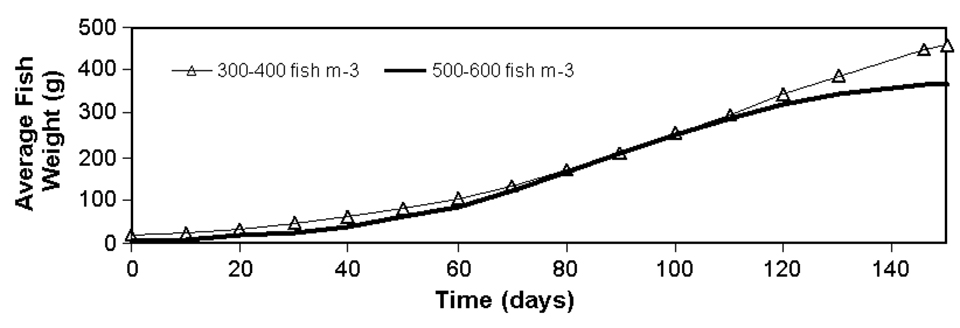
The carrying capacity of both stocking densities was set to 200 kilograms per cubic meter. The 500-600 fish per cubic meter density resulted in larger accumulated biomass (Fig. 1) and better feeding efficiency than the lower density. No significant (P > 0.05) differences between the individual, average weight of fish of both densities (Fig. 2) were observed, suggesting the increased stocking density did not influence individual fish growth.
The Logistic and Mitscherlich functions were used to estimate production functions. The estimated curves can be represented by the following equations:
AB300a400 = f(AR) = 200 •
(1 – 10(–0.001884•RA–0,066106))
AB500a600 = f(AR) = 200 •
(1 – 10(–0.002680•RA–0,061152))
where:
f(AR) = (AB) accumulated biomass (kg m-3)
AR = accumulated consumed ration (kg m-3).
The economic biomass, the value of accumulated fish biomass that maximizes the economic return of the production system, is reached when the harvest point maximizes profit. The profit represents the difference between the total revenues from fish sales and their production costs.
In this study, the biomass that maximized profit at a density of 500 to 600 fish per cubic meter was 145 kilograms per cubic meter (fish weight gain was 2.45 grams per day) and had the best feed conversion. The economic biomass for the 300 to 400 fish per cubic meter stocking density was 121 kilograms per cubic meter (fish weight gain was 2.35 grams per day).
A stocking density of 500 to 600 fish per cubic meter and average fish weight of 283 grams have many advantages, including the optimization of space and production time, better feed conversion, and higher fish production per cage volume. Such conditions were more profitable than the lower stocking density (Table 1).
Conte, Economic analysis of study results, Table 1
| Item | Stocking Density 300-400 fish/m3 | Stocking Density 500-600 fish/m3 |
|---|---|---|
| Total Costs (U.S. $/m3) | 19.07 | 21.19 |
| Economic biomass (kg/m3) | 121 | 145 |
| Total Receive (U.S. $/m3) | 82.37 | 98.70 |
| Profit (U.S. $/msup>3) | 22.06 | 33.37 |
Note: Cited references are available from the authors.
(Editor’s Note: This article was originally published in the December 2003 print edition of the Global Aquaculture Advocate.)
Now that you've reached the end of the article ...
… please consider supporting GSA’s mission to advance responsible seafood practices through education, advocacy and third-party assurances. The Advocate aims to document the evolution of responsible seafood practices and share the expansive knowledge of our vast network of contributors.
By becoming a Global Seafood Alliance member, you’re ensuring that all of the pre-competitive work we do through member benefits, resources and events can continue. Individual membership costs just $50 a year.
Not a GSA member? Join us.
Authors
-

Departamento de Economia
Administração e Sociologia
USP-ESALQ; 13418-900
Piracicaba, SP, Brazil -
Departamento de Economia
Administração e Sociologia
USP-ESALQ; 13418-900
Piracicaba, SP, Brazil -
Departamento de Economia
Administração e Sociologia
USP-ESALQ; 13418-900
Piracicaba, SP, Brazil -
Departamento de Zootecnia
USP-ESALQ
Piracicaba, SP, Brazil
Related Posts
Intelligence
Commercial implementation of in-pond raceway system
An in-pond raceway system in Alabama was utilized to supply various niche markets, including Asian grocery store chains that desired fresh live fish, recreational pond stocking businesses, private pond owners and fee fishing operations. In many cases, a higher price was achieved.
Responsibility
Addressing safety in Latin America’s tilapia supply chain
Over the last decade, the experience gained by many tilapia farmers combined with proficient programs implemented by local governments have significantly improved tilapia production in various Latin American countries like Colombia, Mexico, Ecuador and other important tilapia producers in the region.
Responsibility
Egypt’s success with tilapia a blueprint for all Africa
Egypt is the third-largest tilapia producer globally, after China and Indonesia, and accounts for about 80 percent of African production of farmed tilapia. Many of the reasons for Egypt’s successful development of its important tilapia industry could be applied to the rest of African continent.
Intelligence
Food safety, quality control in tilapia products
The most important quality issue for tilapia is the presence of off-flavors that derive from cyanobacteria and actinomycetes, which can be addressed by depuration.