Performance curves can standardize evaluations of biofilter performance
Curves are applicable over entire range of ammonia-nitrogen concentrations

The aquaculture industry relies almost exclusively on some form of fixed film biofilter for nitrification, such as those found in trickling towers and fluidized-bed, floating bead, and rotating biological contactors. The advantages of these biofilters include their resistance to short-term toxic loads, ability to perform at low influent concentrations, and high volumetric biomass concentrations. In addition, the high cell residence time of fixed film biofilters is needed for the low growth rates of both Nitrosomonas and Nitrobacter.
Currently there is no standardized way to determine and report bio-filter performance to facilitate user selection among the numerous types of biofilters. This type of information is critical for end users, but also important for both design engineers and manufacturers.
Performance measurement
In the past, the selection of the most applicable biofilter for any given species, production level, or economic consideration was made mostly by rules of thumb and operating experience based on existing systems. Today, with the commercial availability of standardized families of biofilters, the potential exists to fully characterize their operating parameters and develop sets of operational curves that reflect ammonia-nitrogen removal rates as a function of such operating parameters as ammonia-nitrogen concentrations and flow rates.
To address this issue, the authors established a simple biofilter evaluation process to express nitrification removal as a function of several operating parameters and applied it to a commercial bubble-washed bead filter.
Biofilter evaluation process
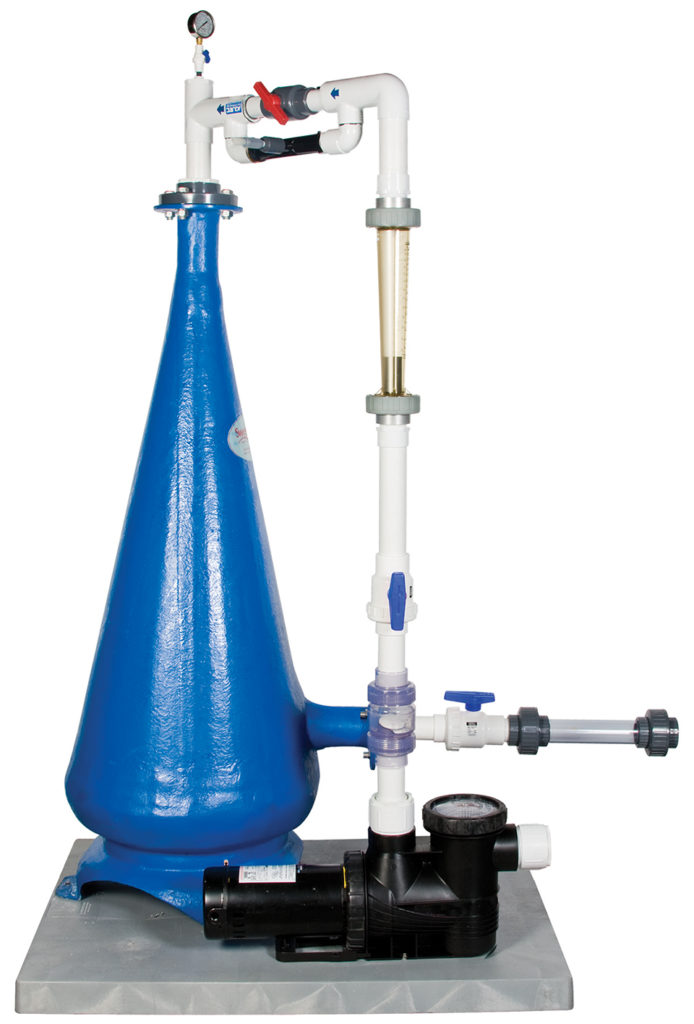
Two commercially available 56.7-liter bubble-washed bead biofilters were chosen for study. Following continuous operation for 24 months as part of a long-term research program, they had well-established bacterial biofilms.
At the conclusion of the research project, the fish were removed from the system, and the research tanks were cleaned and refilled with tap water. The two biofilters were then operated for approximately three weeks with inorganic ammonium chloride as the sole source of ammonia. Each morning, the addition of approximately 20 to 25 grams of ammonium chloride raised the ammonia-nitrogen concentrations in the tanks to 2.5 to 3.0 mg N per liter.
In addition, the filters were backwashed every other day to remove excess biofloc from the system. Heterotrophic bacterial growth was assumed to be minimal in the biofilters due to the removal of the fish, the backwashing, and the extended length of time with little available carbon for growth.
Nitrification reaction trials
Each batch nitrification reaction rate trial consisted of initially spiking each tank with 20 g of ammonium chloride. Water quality at the influent and effluent of the individual bead filters was then monitored every 30 minutes until the ammonia-nitrogen concentrations were too low to accurately measure or for a maximum of eight hours.
A range of flow rates through the biofilters of 10 to 100 liters per minute was investigated to bracket the design loading rates for the filters of 400 to 800 liters per minute per cubic meter of beads. All the experiments were conducted at room temperature, which varied 20 to 22 degrees-C.
The kinetic reaction rate or removal rate was calculated based on the change in concentration of ammonia-nitrogen across the biofilters, divided by the volume of the beads multiplied by the flow rate through the biofilters. Fig. 1 shows the ammonia-nitrogen concentration for four flow rates as a function of time.
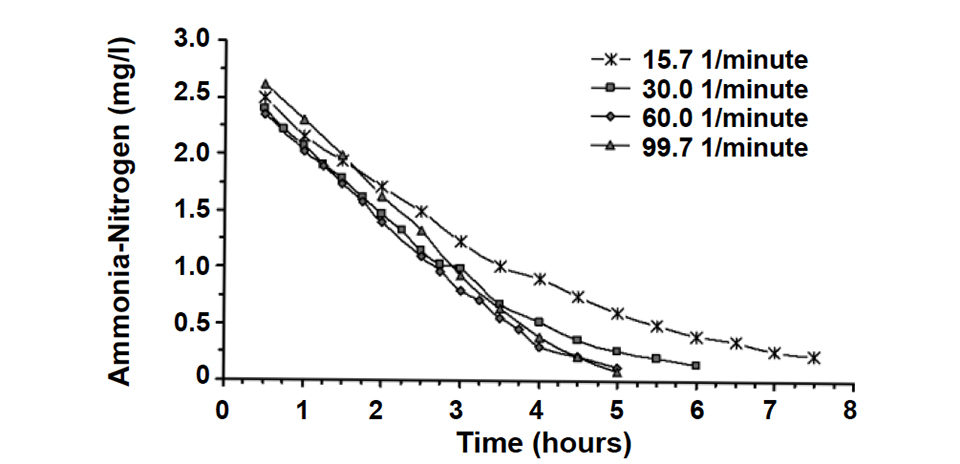
This graph suggests that at low ammonia-nitrogen concentrations, it is possible to describe the removal rate as a first-order reaction (straight line), where the removal rate is directly proportional to the influent ammonia-nitrogen concentration. At higher concentrations, the removal rate approaches a constant value or zero-order reaction rate.
The simplified first- and zero-order reaction rate model can be useful in understanding and characterizing biofilter performance for very low or very high ammonia-nitrogen concentrations. Its major drawback is characterizing the biofilter performance near the break-point between the two models, around 1.0 mg per liter ammonia-nitrogen. To overcome this difficulty, most models of biofilter kinetics use some form of a saturation equation such as the Monod relationship, a computational model inspired by the biology of cells. In the past, the saturation equations were difficult to solve, but today, several software programs include solutions to this equation.
Performance characteristic curves
Experimentally derived values for the Monod reaction rate coefficients were used to develop a series of performance characteristic curves as a function of the flow rate through the biofilter and the ammonia-nitrogen concentration (Fig. 2). The chief advantage of these curves is that they are applicable over the entire range of ammonia-nitrogen concentrations. The final curves can be used by engineers to specify biofilter operating parameters for given recirculation system designs and production species.
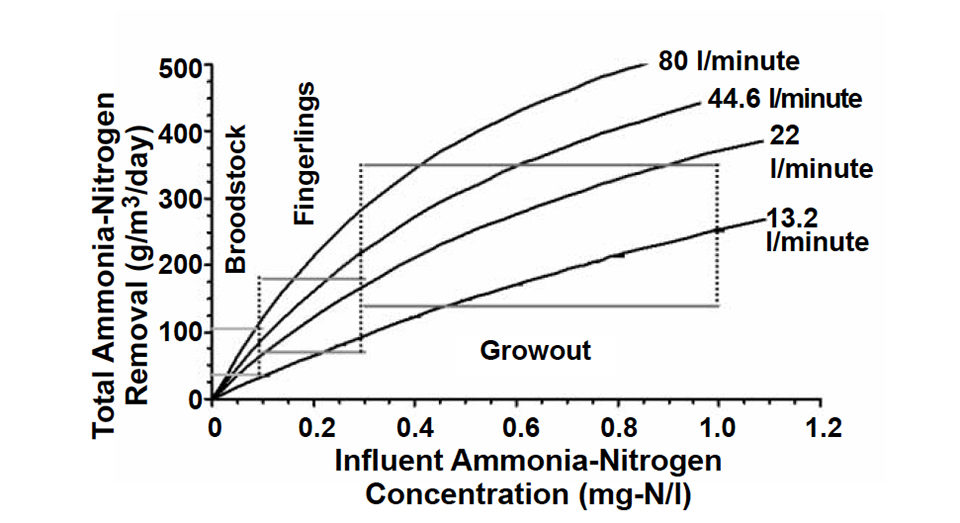
In addition, existing systems can be evaluated to determine if they are operating at their maximum removal rate for a given flow rate and ammonia-nitrogen concentration. The performance curves can help direct how to improve the removal rate or filter efficiency by modifying flow rate through the biofilter or adjusting the ammonia-nitrogen concentrations in the production system. Both modifications have limitations due to the increased cost of pumping water or species’ inherent tolerance of ammonia-nitrogen.
Operating ranges for three production classifications are also shown in the performance characteristic curves to assist in specifying the biofilter operating parameters. As with pump specification, this procedure can help design engineers and operators match biofilters and their operating parameters with sets of characteristic curves specific to system and species requirements.
(Editor’s Note: This article was originally published in the June 2005 print edition of the Global Aquaculture Advocate.)
Now that you've reached the end of the article ...
… please consider supporting GSA’s mission to advance responsible seafood practices through education, advocacy and third-party assurances. The Advocate aims to document the evolution of responsible seafood practices and share the expansive knowledge of our vast network of contributors.
By becoming a Global Seafood Alliance member, you’re ensuring that all of the pre-competitive work we do through member benefits, resources and events can continue. Individual membership costs just $50 a year.
Not a GSA member? Join us.
Authors
-

The Conservation Funds Freshwater Institute
1098 Turner Road
Shepherdstown, West Virginia 25443 USA -

Resources Engineering Department
University of Maryland
College Park, Maryland, USA
Related Posts
Health & Welfare
Biofilter inoculation in recirculating aquaculture systems
Biological filters are essential parts of recirculating aquaculture systems that transform toxic fish compounds such as ammonium and nitrite into less-harmful nitrate. The authors tested the convenience and efficiency of three methods for the initial inoculation of aerobic biofilters.
Responsibility
Biofilter start-up problems? Just add sugar!
One way to jump start biofilter operation is by adding sugar, which can provide sufficient organic carbon to neutralize the ammonia-nitrogen produced.
Responsibility
A look at unit processes in RAS systems
The ability to maintain adequate oxygen levels can be a limiting factor in carrying capacities for RAS. The amount of oxygen required is largely dictated by the feed rate and length of time waste solids remain within the systems.

Innovation & Investment
A review of unit processes in RAS systems
Since un-ionized ammonia-nitrogen and nitrite-nitrogen are toxic to most finfish, controlling their concentrations in culture tanks is a primary objective in the design of recirculating aquaculture systems.