Feeding simulation developed using fish-schooling behavior
Different feeding methods modeled resulted in individual differences in fish body mass
In aquaculture production, competition for feed leads to individual differences in the growth of the animals cultured, and these differences can increase the variability, predictability, and efficient management of their production. Rearing experiments can be conducted to determine the optimum feeding operation, and there are several studies in the literature generally concluding that the feeding method used can affect the final growth of fish.
We hypothesized that the growth difference from feeding in a spatial distribution was determined by the spatial behavior of individual fish in the tank. To understand the growth difference caused by feeding with a particular spatial distribution, the growth history of each individual should be quantitatively evaluated. However, growth is generally evaluated by the mean body mass of reared fish, and the growth of an individual fish is difficult to track. Also, it is costly and time-consuming to conduct an actual rearing experiment with live animals, so a comparison of various feeding methods is difficult.
This article – summarized from the original publication (Takahashi, Y. and K. Komeyama. 2023. Development of a feeding simulation to evaluate how feeding distribution in aquaculture affects individual differences in growth based on the fish schooling behavioral model. PLoS ONE 18(2): e0280017) – reports on the development of a feeding simulation method based on a fish schooling model to clarify the relationship between individual fish behavior and growth.
Study setup
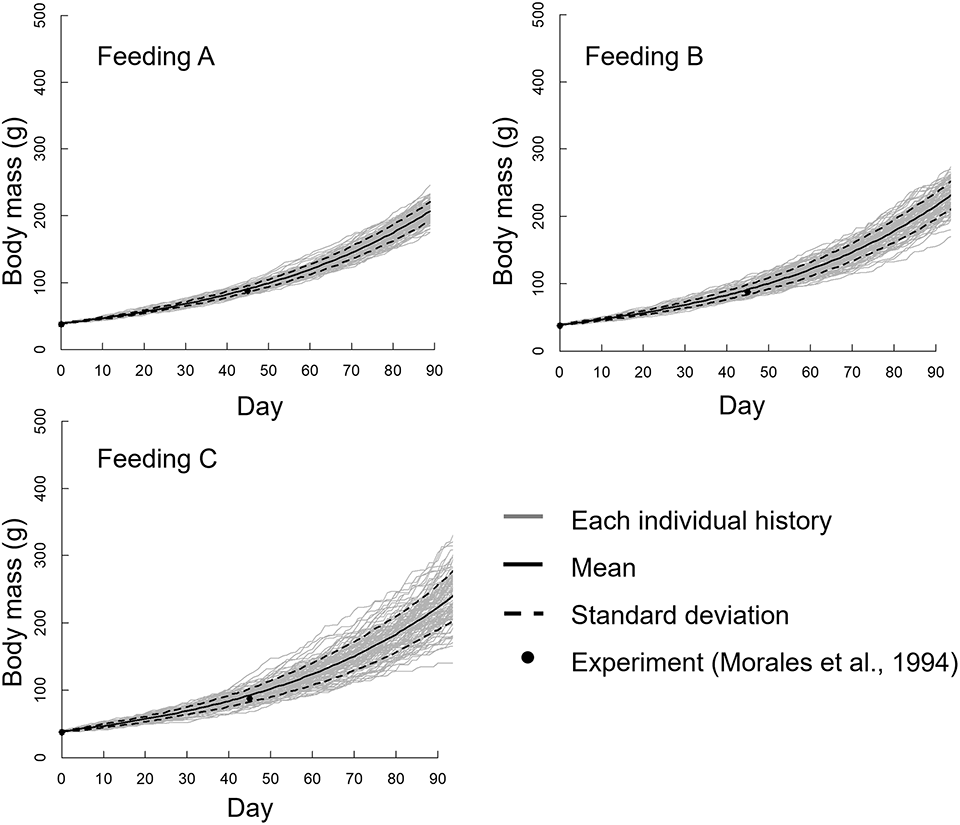
This study involved the development of a feeding simulation using a fish schooling behavior model to evaluate growth differences from the feeding spatial distribution. Rainbow trout (Oncorhynchus mykiss) were used in the study, and their feeding behavior was modeled using the fish schooling model to simulate the amount of feed consumed by each individual. Then, body mass growth was calculated based on the amount of feed consumed. We used three feeding methods to evaluate how feeding distribution affected growth: Feeding A, B, and C. The feed was distributed in a square pattern with one side length of 1.5, 1.0 or 0.5 meters for Feeding A, B and C groups, respectively. Additional details are available in the original publication.
![Ad for [Aquademia]](https://www.globalseafood.org/wp-content/uploads/2025/07/aquademia_web2025_1050x125.gif)
Results and discussion
From the simulation results, the growth variability of feeding group C, which was the narrow-area feeding group, was larger than for feeding group A, which was the wide-area feeding group. This tendency was also reported by other researchers. We demonstrated that the growth difference was determined by individual fish behavior under the simulated feeding conditions. The relevance of our results is that the growth of the fish can be explained and tracked by individual fish behavior.
Effects of a commercial, phenol-rich fulvic acid as a water additive on rainbow trout
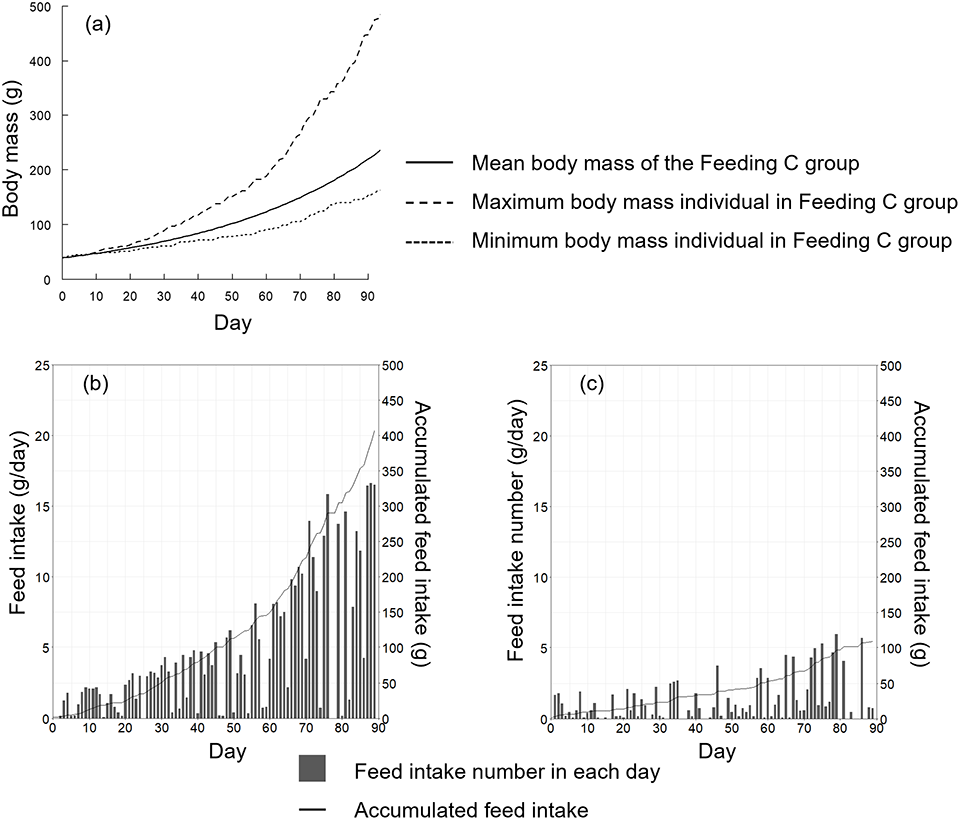
A significant difference was observed between the variance of the body mass of each distribution on day 90 of the experiment. Additionally, the skewness of narrow-area feeding was larger than that of wide-area feeding. These results suggest that the feeding distribution had an impact on the variability in growth, but not the mean body mass. We visualized the body mass growth and feeding history of the maximum and minimum individuals in feeding group C.
Regarding the suitability of our simulation model for aquaculture management, feeding cost is critical when managing an aquaculture farm, so many studies have focused on the optimum feeding amount or methods for fish growth. In the past, an actual rearing test was the only way to determine the optimum feeding amount or method; however, this approach is costly and time-consuming. In contrast, our simulation model confirmed growth before actual rearing. Therefore, the optimum feeding method and amount can be determined readily on a personal computer.
Another advantage of our proposed simulation method is that detailed information on the reared individuals can be easily obtained and visualized. Exceptionally large or small individuals always appear during the culture period. However, the reasons for this were not clearly understood because it is difficult to obtain an individual growth history. Therefore, we visualized the maximum and minimum body mass growth of individuals and their feeding history and explored the reasons for growth in detail (Fig. 2).
Exceptionally large or small individuals have a negative effect on the management of an aquaculture farm, because their selling price is very variable, and so these animals should be excluded from the simulation. A fish farmer can more easily develop a management plan if individual growth history can be predicted. This simulation model will be useful for preliminary planning and future management without the need for an empirical method and will aid aqua farmers in their decision-making for feed management and other factors.
One limitation of this study was that some parameters, such as the field of view and excess feeding ratio, were determined by trial and error. For an accurate simulation, these parameters should be based on experimental results. The behavioral parameters and field of view affected the schooling behavior directly. For example, a school will disperse when a certain model value is large and gather when that value is small. A recent study proposed a method to measure 3D fish behavior using multi-stereo imaging. In the future, 3D movement paths, including behavior according to feed presence, should be measured to understand interference by each individual of the cultured species. We believe that our qualitative results are not dependent on these parameters. However, in the future, these parameters should be determined from 3D movement paths for each species in laboratory experiments for more accurate simulations.
Perspectives
We demonstrated that growth differences according to feeding spatial distribution were determined by individual fish behavior under the simulated conditions. Feeding cost is a critical problem when managing an aquaculture farm. Many rearing studies have been performed to understand the optimum feeding amount, but these conventional rearing tests are costly and time-consuming. As a result, the operation of the actual aquaculture farm often relies significantly on the farmer’s experience.
We conducted an easy rearing simulation test within a short time using the proposed simulation method, and different methods were evaluated. The results demonstrated that optimal feed management can be determined without using an empirical method. This simulation is applicable only to rainbow trout under the specific conditions we tested in our study. In the future, this proposed simulation method can be used as a decision-making tool in aquaculture and can significantly contribute to more efficient management of aquaculture farms.
Now that you've reached the end of the article ...
… please consider supporting GSA’s mission to advance responsible seafood practices through education, advocacy and third-party assurances. The Advocate aims to document the evolution of responsible seafood practices and share the expansive knowledge of our vast network of contributors.
By becoming a Global Seafood Alliance member, you’re ensuring that all of the pre-competitive work we do through member benefits, resources and events can continue. Individual membership costs just $50 a year.
Not a GSA member? Join us.
Authors
-

Corresponding author
Faculty of Fisheries Sciences, Hokkaido University, Hakodate, Hokkaido, Japan -
Faculty of Fisheries Sciences, Hokkaido University, Hakodate, Hokkaido, Japan