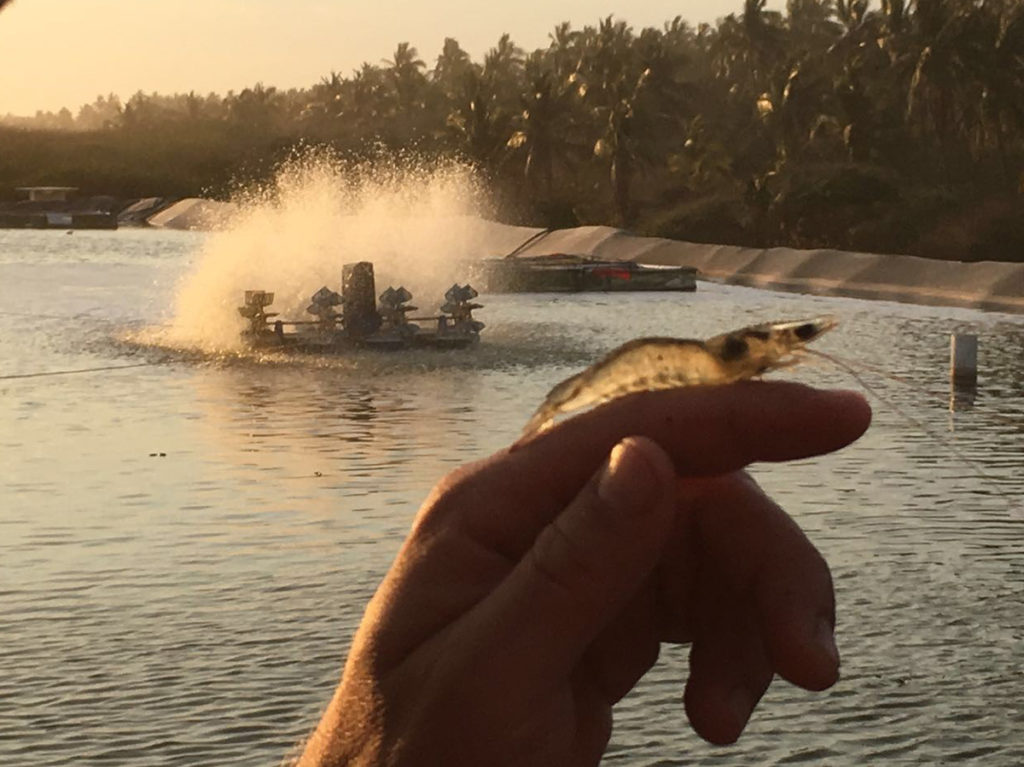
A case for better shrimp nutrition
Buying cheaper feeds, feeding for lower FCRs can sometimes reduce profitability
“You are what you eat!”
We are all familiar with this saying and its profound truthfulness. Indeed, our physical form exists because of what we have consumed. However, this is a backward-looking phrase, and hindsight is always in perfect focus.
By putting a futuristic, predictive perspective on this saying, it becomes “We become what we eat!” Meaning that if we do not consume the proper nutrients in the proper quantities within the appropriate time frame, we will succumb to various metabolic or environmental insults, eventually facing illness and death. This is not only true for humans, but all living organisms, including shrimp.
This approach to providing nourishment is not practiced effectively in our lives or in our businesses, which results in many lost economic opportunities.
![Ad for [Aquademia]](https://www.globalseafood.org/wp-content/uploads/2025/07/aquademia_web2025_1050x125.gif)
By quantitatively evaluating nutrition, feeds and feeding methods in the business of commercial shrimp farming, relative profit opportunities become apparent. Similar correlations apply to other aquaculture production systems.
Some basics
Nutrition is the science of identifying, quantifying and supplying an animal the essential chemical nutrient substances required to perform its normal physiological functions – including maintaining a highly effective natural immune system, growth and reproduction.
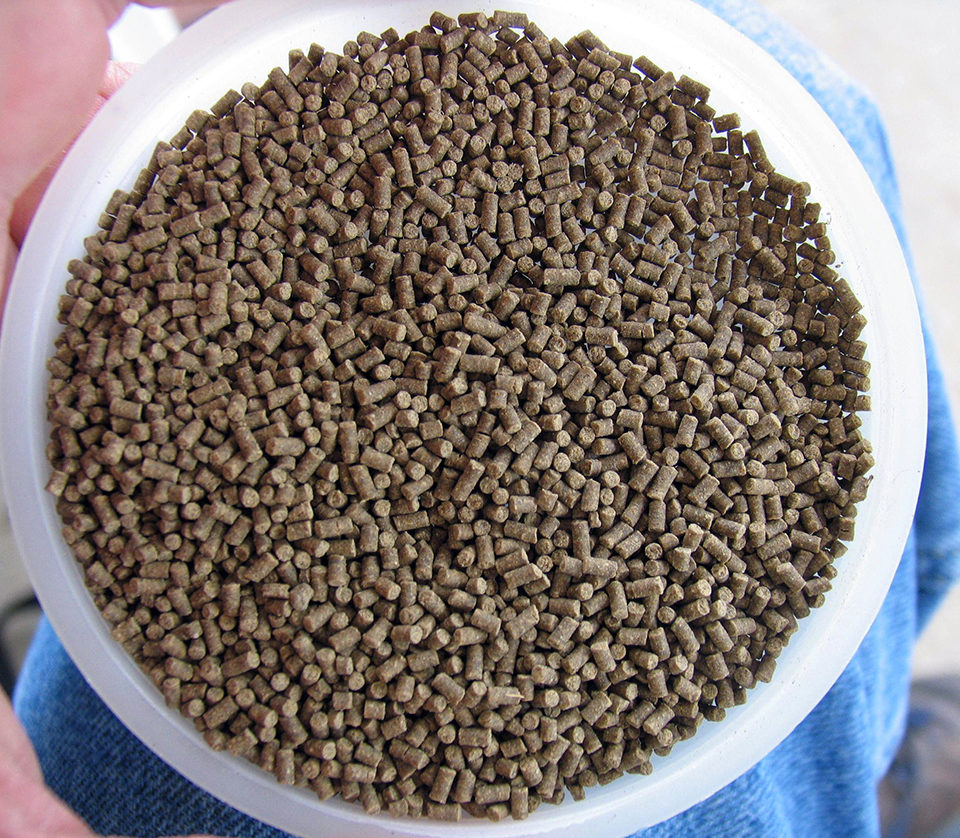
Feed is the form of ingredients which when fed to the animal is intended to supply its nutritional requirements. The feed must contain the proper nutrients in the proper ratios and in highly digestible and available forms. In addition, it must be wholesome, attractive and palatable to the shrimp and meet appropriate water stability criteria.
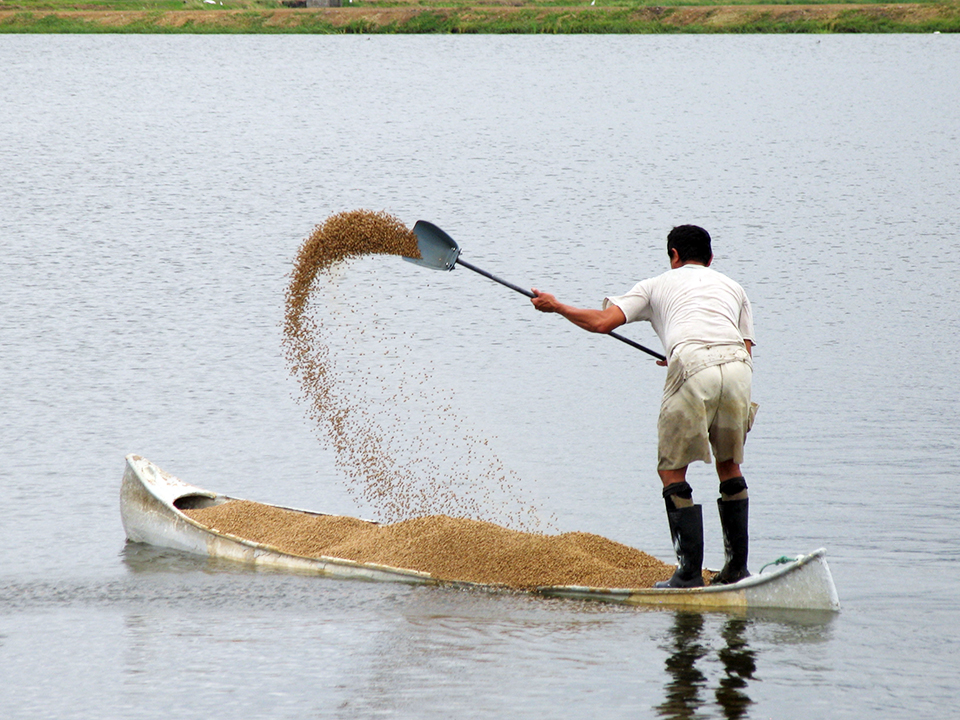
Feeding is the process of presenting feed to the animal for consumption. Ideal feeding would provide each animal with the exact amount of feed it needs and can eat at the proper location in the pond and at the proper time. Superior feeding of shrimp is extremely difficult, but without superior feeding techniques, the full potential of quality feed and nutrition will not be expressed by the animals.
Effects and interactions
Some of the complexities involved in feeding shrimp are illustrated in Table 1. Many important production parameters are significantly affected by the nutrition, feeds and feeding methods used. Equally important are the significant interactions that exist between animals and their environments.
Zeigler, Effects and interactions of nutrition, Table 1
| Factor | Affected by: |
|---|---|
| Weight gain | Nutrition, feeds and feeding techniques. |
| Compensatory growth | Nutrient availability during periods when animals can grow faster than normally expected. |
| Crop cycle | Growth rate and molt efficiencly. Crop risk is decreased with shorter cycles, but more annual cycles increase profitability. |
| Survival | Animal health, which is improved with good nutrition. |
| Immune system | Specific nutrients required to maintain animals’ immune systems. Increased levels are required during periods of stress and disease. |
| Osmoregulation | Specific nutrients that “buffer” the animals from environmental changes. |
| Physiology | Complete, balanced nutrition that maintains body processes, including digestion. |
| Molting | Complete, balanced nutrition that supports exoskeleton quality. |
| Feed efficiency | Proper feed presentation and physical parameters. Healthy tissues lining the intestinal tract and proper enzyme function are supported by adequate nutrition. |
| Oxygen levels | Feed nutrients that increase algae, both a producer and consumer of oxygen. Bacteria can also consume large quantities of oxygen. |
| Carbon dioxide levels | High levels of bacteria. Water alkalinity and pH must also be effectively managed. |
| Natural productivity | Feed and shrimp consumption. Excessive natural productivity must be effectively managed. |
| Shrimp uniformity | Nutrition, feeds and feeding methods. |
| Product quality | Shrimp texture, flavor and firmness, conditions such as black spot. |
| Shelf life | Proper nutrition, especially the level of antioxidants in feed. |
| Additives | Feed can carry medications and other treatments. |
| Anti-metabolites | Feed contaminants such as mycotoxins and heavy metals. |
Feed is the primary contributor to changes in water quality. Uneaten feed and undigested feed excreted with metabolites by shrimp are key factors in primarily reduced water quality.
Managers are challenged to thoroughly understand these factors to achieve profitable crops on a continuing basis.
For example, by feeding to achieve low feed-conversion ratios (FCRs) in order to cut feed costs, growth rates and the shrimp’s immune systems may be compromised. This can result in lower survival and a longer production cycle that further puts the crop at risk. Natural productivity can be reduced, which also has the indirect effect of increasing FCR. Lower natural productivity can reduce the need to exchange water and lower pumping costs.
Estimating feed value
Feed is the single largest cost item in shrimp production. Because of this, the aquaculture industry strives to reduce feed costs by buying cheaper feeds, feeding for lower FCRs and evaluating feed performance. These strategies are often flawed and have the effect of reducing profitability. As shown in this column in January, profitability is primarily driven by crop yield and price of the shrimp.
By using simple economic modeling, as discussed in the November/December 2011 Global Aquaculture Advocate, it is possible to easily calculate feed value under different production scenarios. Production metrics for an example crop are presented in Table 2. In this example with feed costing $0.35/lb, profit is calculated as $889.00/ha. The crop metrics reported in this table were used in developing the economic models reported in the next four tables.
Zeigler, Crop example, Table 2
| Pond size (ha) | 1 |
| Stocking density (shrimp/m2) | 15 |
| Weight gain (g/week) | 1 |
| Harvest size (g) | 15 |
| Survival (%) | 50 |
| Feed-conversion ratio | 2.0 |
| Postlarvae cost (U.S. $/1,000) | 4.00 |
| Market value (U.S. $/lb) | 2.15 |
| Feed cost (U.S. $/lb) | 0.35 |
| All other costs (U.S. $/day) | 20.00 |
| Profit (U.S. $/ha) | $889.00 |
The effect of growth rate on profits and feed value is presented in Table 3. As the rate of growth is increased from 1.0 to 2.0 g/week, profits increase from $889.00 to $1,936.00/ha. Column 3 records the feed value at break-even, the feed cost that will produce a profit of $889.00/ha at the selected rate of gain. Accordingly, at a weekly gain of 1.6 g, feed could cost as much as $0.50/lb and still produce the same level of profit.
Zeigler, Effects of growth rate, Table 3
| Weekly Gain (g) | Profit (U.S. $/ha) | Feed Value at Break-Even (U.S. $/lb) |
|---|---|---|
| 1.0 | 889 | 0.350 |
| 1.1 | 1,079 | 0.388 |
| 1.2 | 1,238 | 0.421 |
| 1.3 | 1,372 | 0.448 |
| 1.4 | 1,487 | 0.471 |
| 1.5 | 1,587 | 0.491 |
| 1.6 | 1,674 | 0.500 |
| 1.7 | 1,751 | 0.525 |
| 1.8 | 1,820 | 0.538 |
| 1.9 | 1,881 | 0.551 |
| 2.0 | 1,936 | 0.562 |
The effects of FCR on profits and feed value are presented in Table 4. In this example, as FCR decreases from 2.0 to 1.0, profits increase from $889.00 to $1,754.00/ha, and the break-even value of feed increases to $0.70/lb. With an FCR of 1.5, profit calculates at $1,322.00/ha, and the value of feed at break-even becomes $0.47/lb.
Zeigler, Effects of FCR, Table 4
| Feed-Conversion Ratio | Profit (U.S. $/ha) | Feed Value at Break-Even (U.S. $/lb) |
|---|---|---|
| 2.0 | 889 | 0.350 |
| 1.9 | 976 | 0.368 |
| 1.8 | 1,062 | 0.389 |
| 1.7 | 1,149 | 0.412 |
| 1.6 | 1,235 | 0.437 |
| 1.5 | 1,322 | 0.467 |
| 1.4 | 1,408 | 0.500 |
| 1.3 | 1,495 | 0.539 |
| 1.2 | 1,581 | 0.584 |
| 1.1 | 1,668 | 0.636 |
| 1.0 | 1,754 | 0.700 |
The effects of survival on profits and feed value are presented in Table 5. As survival increases from 50 to 100 percent, profits increase from $889.00/ha to $4,472.00/ha. The break-even value of feed increases from $0.35 to $0.71/lb. With a survival of 85 percent, the profit level becomes $3,389.00/ha, and the break-even value of feed becomes $0.65/lb. Because most hatcheries give 5 to 10 percent extra shrimp with each order, a survival rate of 100 percent is achievable.
Zeigler, Effects of survival, Table 5
| Survival (%) | Profit (U.S. $/ha) | Feed Value at Break-Even (U.S. $/lb) |
|---|---|---|
| 50 | 889 | 0.350 |
| 55 | 1,247 | 0.416 |
| 60 | 1,606 | 0.471 |
| 65 | 1,964 | 0.517 |
| 70 | 2,322 | 0.557 |
| 75 | 2,681 | 0.592 |
| 80 | 3,039 | 0.622 |
| 85 | 3,398 | 0.649 |
| 90 | 3,756 | 0.672 |
| 95 | 4,114 | 0.693 |
| 100 | 4,472 | 0.713 |
Table 6 demonstrates the significant profit opportunities that exist if realistic productivity goals are met. For this example, the production metrics in Table 2 are changed: the weekly weight gain to 1.6 g, survival to 85 percent and FCR to 1.5. The revised production metrics are both realistic and achievable. In the latter example, profit levels increase 5.5 times to $4,918, and the break-even value of feed becomes $1.13/lb.
Zeigler, Productivity of crop, Table 6
| Survival | Example 1 | Example 2 |
|---|---|---|
| Pond size (ha) | 1 | 1 |
| Stocking density (shrimp/m2) | 15 | 15 |
| Weight gain (g//week) | 1.0 | 1.6 |
| Harvest size (g) | 15 | 15 |
| Survival (%) | 50 | 85 |
| Feed-conversion ratio | 2.0 | 1.5 |
| Postlarvae cost (U.S. $/1,000) | 4.00 | 4.00 |
| Market value (U.S. $/lb) | 2.15 | 2.15 |
| Feed cost (U.S $/lb) | 0.35 | .035 |
| All other cost (U.S. $/day) | 20.00 | 20.00 |
| Profit (U.S. $/ha) | 889.00 | 4,918.00 |
| Feed value at break-even (U.S. $/lb) | 1.13 |
Opportunity thinking
A review of current production data for shrimp farms clearly indicates that farm performance in many areas is marginally below realistic production standards. This presents opportunities to challenge and change common management habits with scientifically proven nutrition, feeds and feeding techniques, resulting in significantly improved profitability.
This and previous articles demonstrate that through economic modeling examining the effects of growth rate, FCR and survival on profitability, significant increases in profit can be achieved through incremental improvements in these important production metrics. Although economic modeling may not yield perfect data, the resulting incremental improving trends cannot be refuted.
(Editor’s Note: This article was originally published in the March/April 2012 print edition of the Global Aquaculture Advocate.)
Now that you've reached the end of the article ...
… please consider supporting GSA’s mission to advance responsible seafood practices through education, advocacy and third-party assurances. The Advocate aims to document the evolution of responsible seafood practices and share the expansive knowledge of our vast network of contributors.
By becoming a Global Seafood Alliance member, you’re ensuring that all of the pre-competitive work we do through member benefits, resources and events can continue. Individual membership costs just $50 a year.
Not a GSA member? Join us.
Authors
-

Senior Technical Advisor
Past President and Chairman
Zeigler Bros., Inc.
P. O. Box 95
Gardners, Pennsylvania 17324 USA -

Animal Nutritionist
Zeigler Bros., Inc.
P. O. Box 95
Gardners, Pennsylvania 17324 USA
Related Posts
Aquafeeds
A look at protease enzymes in crustacean nutrition
Food digestion involves digestive enzymes to break down polymeric macromolecules and facilitate nutrient absorption. Enzyme supplementation in aquafeeds is a major alternative to improve feed quality and nutrient digestibility, gut health, compensate digestive enzymes when needed, and may also improve immune responses.
Aquafeeds
A look at phospholipids in aquafeeds
Phospholipids are the major constituents of cell membranes and are vital to the normal function of every cell and organ. The inclusion of phospholipids in aquafeeds ensures increased growth, better survival and stress resistance, and prevention of skeletal deformities of larval and juvenile stages of fish and shellfish species.

Aquafeeds
Aquaculture Exchange: Dr. Tom Zeigler
The World Aquaculture Society’s latest Lifetime Achievement Award recipient reflects on 50 years in the business of producing high-quality, nutritious feeds for the poultry, livestock and aquaculture industries.
Aquafeeds
Changing the aquafeed paradigm
Change the aquafeed paradigm by viewing feed as an investment, instead of simply as a cost. This can result in greater profitability.