Statistical modeling of field data can aid shrimp grow-out operations
Tracking farm area, salinity, stocking density, seedstock source, growth rates and feeds
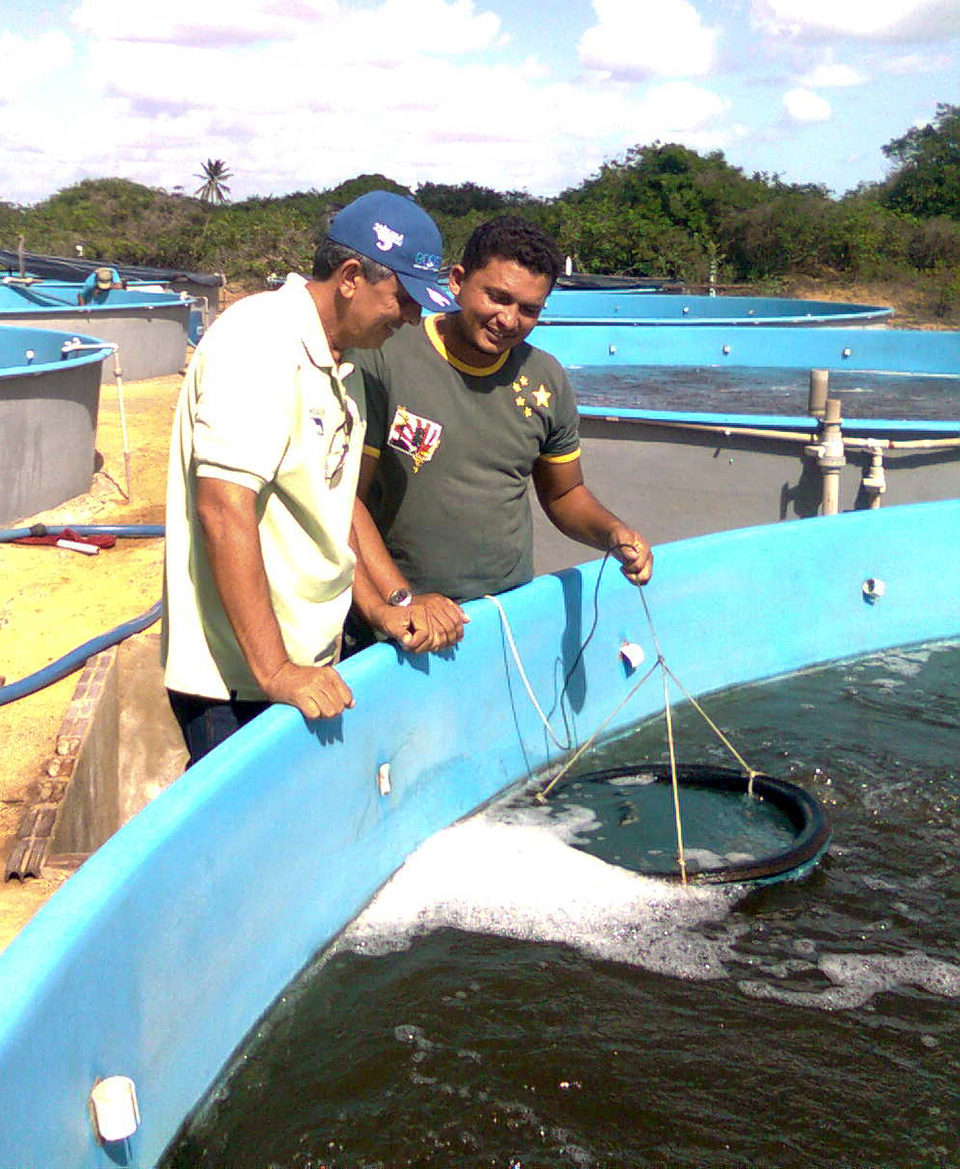
Aquatec, a leading commercial shrimp hatchery in Brazil, maintains a team of post-sales technical experts who follow up on customer outcomes and offer advice on such matters as shrimp grow-out and disease management. It is part of their job to collect accurate field data from commercial grow-out operations stocked with the company’s genetically improved postlarvae as well as animals from competitors.
Data collection, analysis
During the years of 2008 and 2009, field data from over 3,000 shrimp commercial grow-out facilities were collected in the states of Paraíba, Pernambuco, Rio Grande do Norte and Ceará. These field data followed a pre-specified format and included information on farm area, salinity, stocking density, seedstock source, growth rates and feeds. Additional data on management levels and production problems were noted.
After preliminary data checks and different types of validations, accurate field data from 2,768 commercial shrimp grow-outs were subjected to mixed linear model statistical analyses. Random effects of farm and commercial feed brand and type were considered.
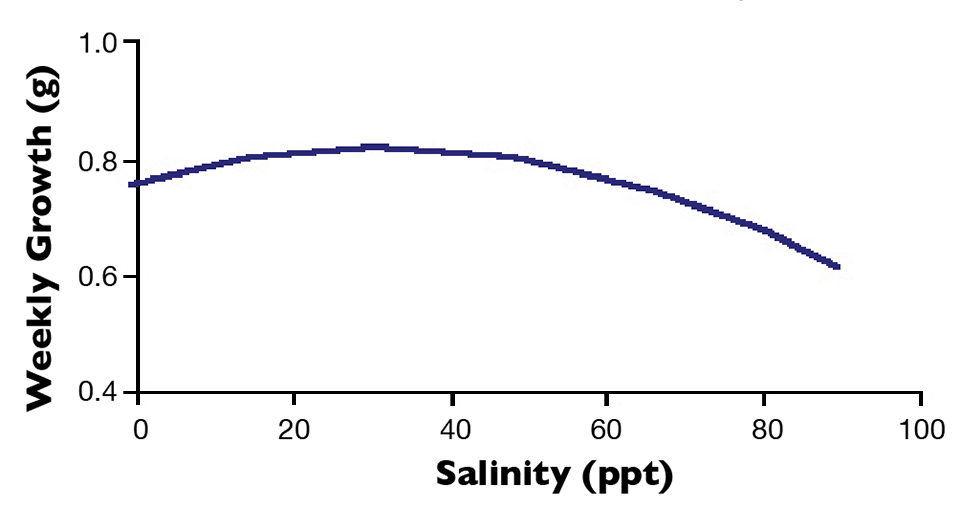
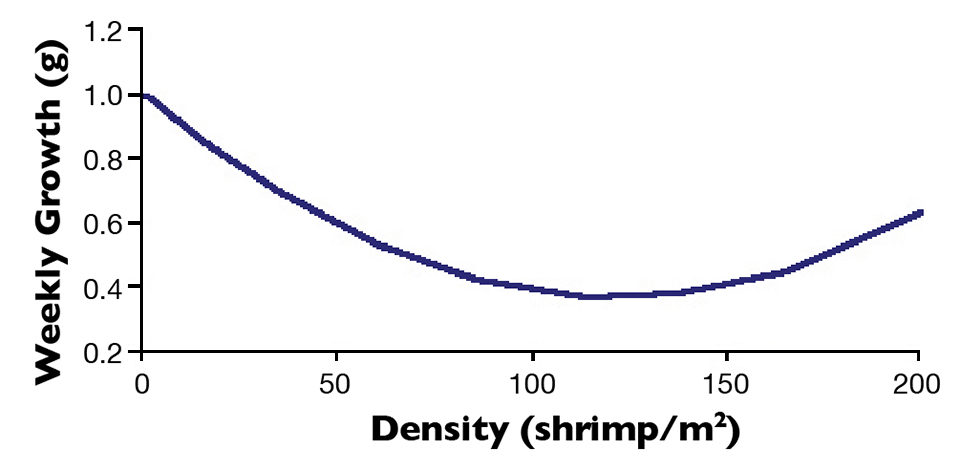
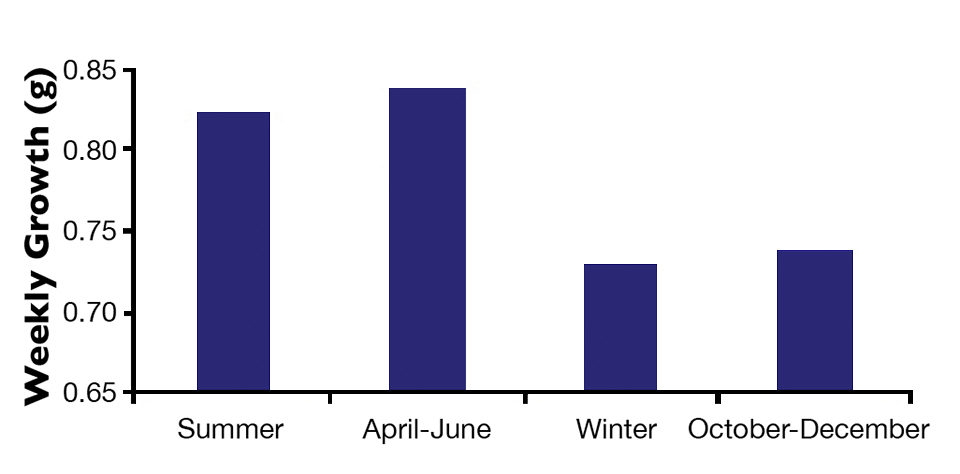
Of the commercial grow-outs included in the analyses, 1,943 had been stocked with Aquatec’s Speed Line postlarvae (PLs), and the remainder had PLs from other commercial suppliers. The fixed effects of salinity, stocking density and grow-out period – as well as average harvest weight and survival, when appropriate – were fitted as linear, quadratic or higher-order covariates.
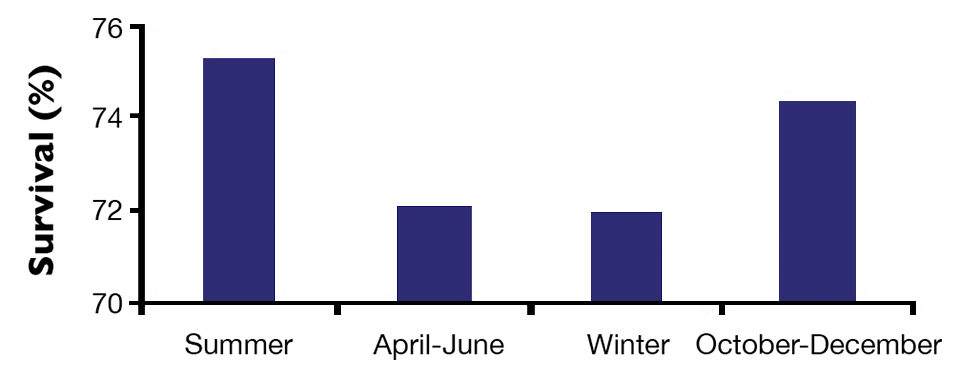
Model selection was implemented for the dependent variables: harvest weight and weekly growth, adjusted for survival; grow-out survival; feed-conversion ratio, adjusted for average harvest weight and survival; harvested biomass/ha; number of grow-out days, adjusted for average harvest weight and survival; and incidence of infectious myonecrosis, necrotizing hepatopancreatitis and vibriosis.
For each dependent variable, all the biological functions and relationships included in the statistical model and listed above were thoroughly studied and validated. Some of them are illustrated in Figs. 1 to 4.
Results
The impacts of the management level effect included in the statistical models for the dependent variables are summarized in Table 1.
Rocha, Impacts of management level effects, Table 1
| Trait | Average Impact of Poor Management |
|---|---|
| Harvest weight | -0.45 g |
| Weekly growth rate | -0.024 g/week |
| Feed-conversion ratio | 0.061 |
| Growout survival | -15.2 % |
| Harvested biomass | -321.1 kg/ha |
| Incidence of IMNV | 8.6% |
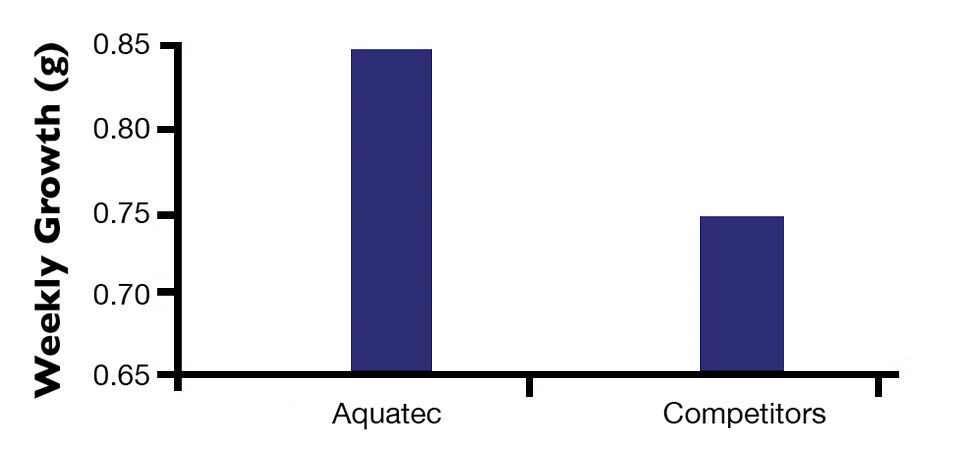
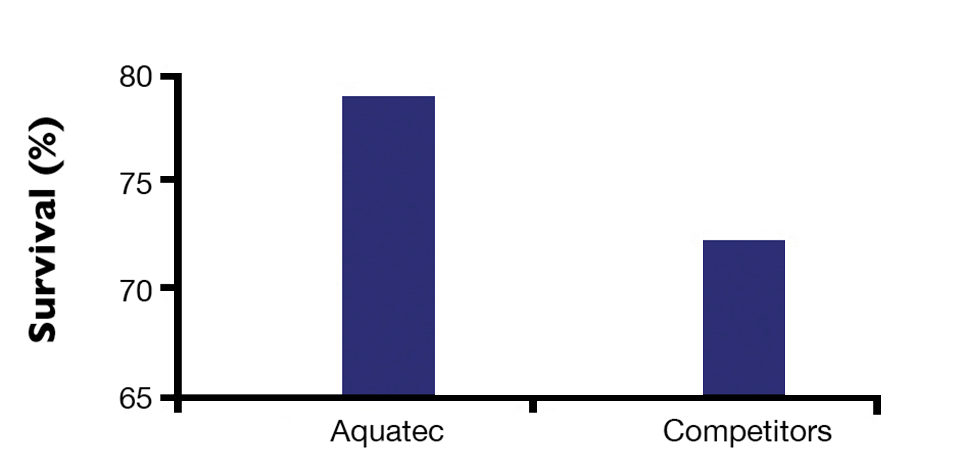
Once a given statistical model and its included biological functions and relationships were validated and reached a satisfactory level of biological credence, the authors proceeded to the comparisons of the performances of Aquatec’s PL products and those of competitors. Some of these are illustrated in Figs. 5 and 6.
(Editor’s Note: This article was originally published in the May/June 2011 print edition of the Global Aquaculture Advocate.)
Authors
-

Genearch Aquacultura
Aquatec Industrial Pecuária
Praia de Pititinga and Barra do Cunhaú
R.N., CEP 59190, Brazil -
Genearch Aquacultura
Aquatec Industrial Pecuária
Praia de Pititinga and Barra do Cunhaú
R.N., CEP 59190, Brazil -
Genearch Aquacultura
Aquatec Industrial Pecuária
Praia de Pititinga and Barra do Cunhaú
R.N., CEP 59190, Brazil -
Genearch Aquacultura
Aquatec Industrial Pecuária
Praia de Pititinga and Barra do Cunhaú
R.N., CEP 59190, Brazil -
Genearch Aquacultura
Aquatec Industrial Pecuária
Praia de Pititinga and Barra do Cunhaú
R.N., CEP 59190, Brazil
Related Posts

Innovation & Investment
Aquaculture Exchange: Barry Costa-Pierce, UNE
University of New England Professor Barry Costa-Pierce says aquaculture is often neglected in studies examining ocean health and ecosystem and resource management. The “Ocean Prosperity Roadmap” released this summer, he said, was more of the same.

Responsibility
Aquaculture Exchange: Jon Grant, Dalhousie University
The chairman of the NSERC-Cooke Industrial Research in Sustainable Aquaculture extols a comprehensive approach to aquaculture and other marine activities. Farm location and density, he says, have strong impacts on disease risk, waste dispersal and growth rates.
Health & Welfare
Arapaima a candidate for intensive freshwater culture
Arapaima, also known as pirarucu or paiche, offers appealing flesh color and texture, low fat content and high levels of protein and fatty acids.
Health & Welfare
A case for better shrimp nutrition
Shrimp farm performance can often be below realistic production standards. Use proven nutrition, feeds and feeding techniques to improve profitability.