NIR an accurate method for determining chemistry of shrimp feed ingredients
The Oceanic Institute evaluates application and reproducibility limits of NIR in predicting the chemical composition of fishmeal, soybean meal
Commercial near infrared (NIR) instruments were introduced in the 1970s. Today, NIR has become a commonly accepted tool in the food and grain industries to almost instantaneously measure protein, oil, moisture, starch, and other constituents without the use of chemicals or heat.
The process is based on the principle that certain types of chemical bonds absorb specific frequencies of light energy in the near infrared spectrum. The amount of infrared light energy that is reflected or transmitted through the product has a direct relationship with its chemical composition.
In the aquaculture industry, NIR is gaining popularity, especially in the analysis of ingredients and feeds as part of quality control and feed management. We evaluated the application and reproducibility limits of NIR in predicting the chemical composition of two major shrimp feed ingredients: fishmeal and soybean meal.
Samples and analyses
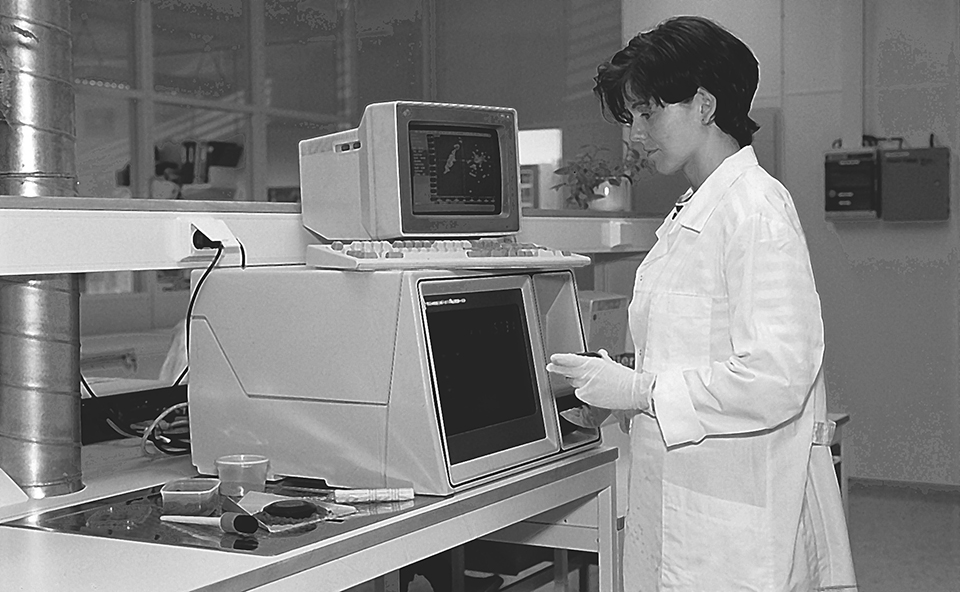
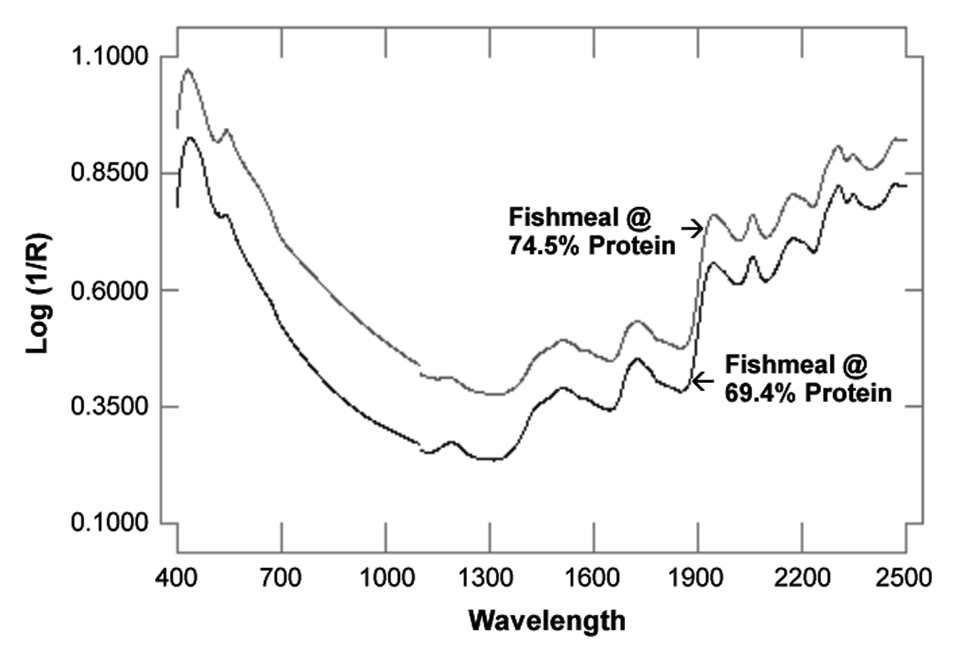
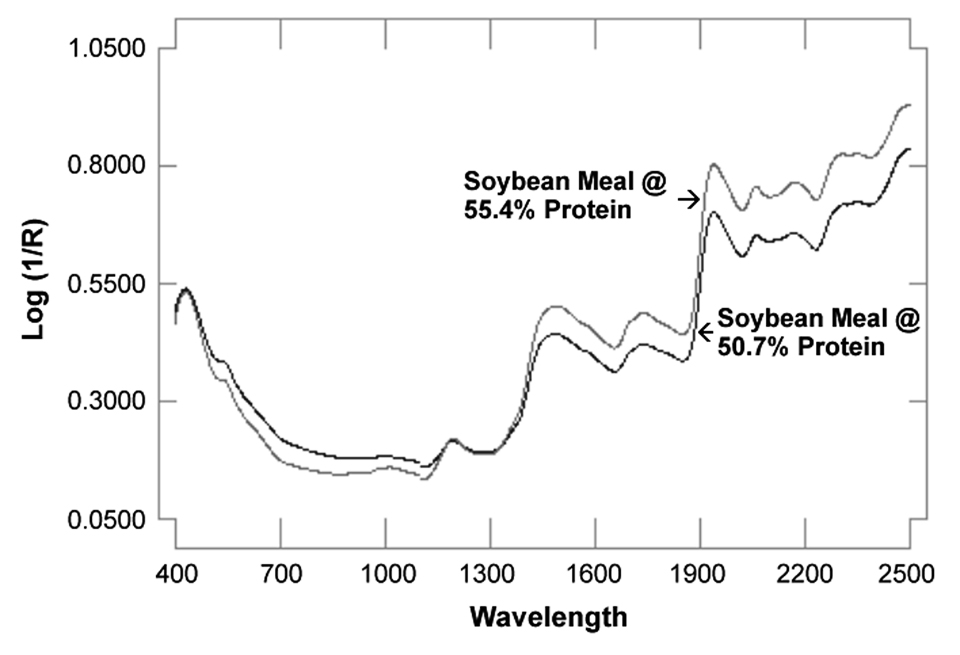
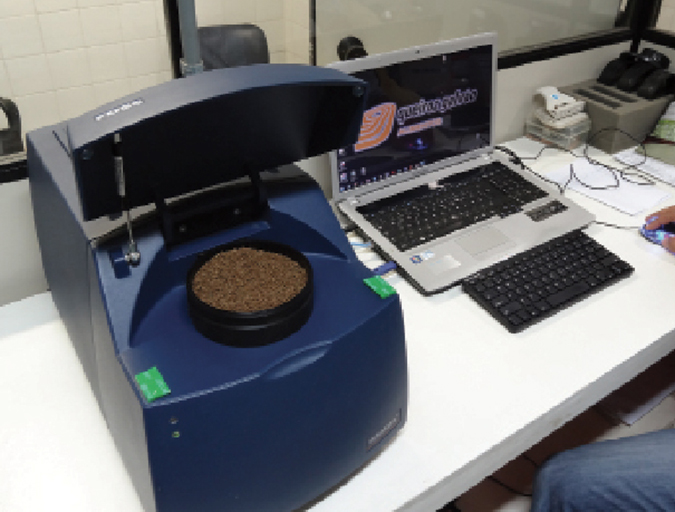
A total of 27 unique samples of fishmeal and 20 unique samples of soybean meal were collected from suppliers in the United States and abroad. These samples were used in evaluating the reproducibility limits of near infrared reflectance analyzer, NIRSystems 6500 (Foss NIRSystems, Silver Spring, MD USA). Other shrimp feed ingredients received did not have sufficient samples for the development or expansion of a calibration. At least 30 unique samples are required to develop a calibration and at least 10 samples to expand an existing set of calibrations. Samples of fishmeal and soybean meal were used to expand existing calibrations and were tested for protein, fat, and moisture. These samples were scanned by NIR and then analyzed by conventional laboratory procedure. The typical spectra generated by NIR for fishmeal and soybean meal are shown in Figs. 1 and 2, respectively.
Calibration and evaluation
Evaluation of predicted (NIR) and actual (laboratory) values indicated the feasibility of expanding the existing calibration equations for both fishmeal and soybean meal. Expanding the calibration set was carried out by adding the new samples spectra to the existing calibration making it more robust. An independent set of laboratory-analyzed fishmeal and soybean meal samples were used to validate the new set of calibration equations. The result was evaluated using standard error of prediction (SEP) and correlation coefficient (R). SEP measures the accuracy of the NIR method and is compared to the standard deviation of the laboratory method. The correlation coefficient describes the degree of fitness of the data on the regression line.
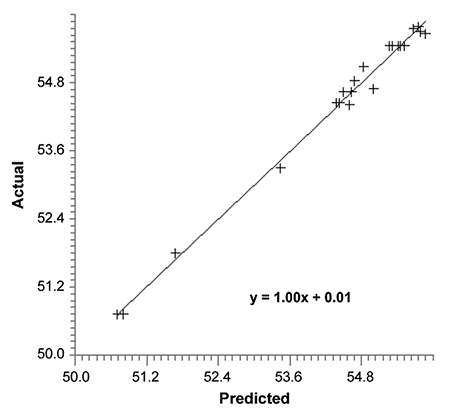
Fishmeal
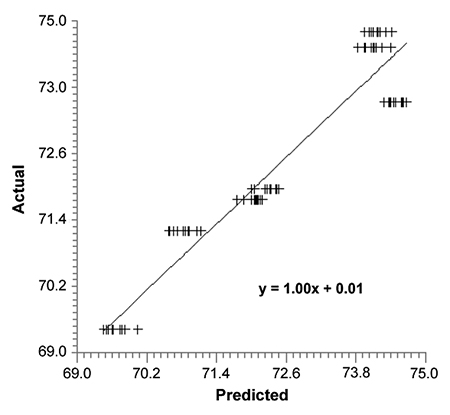
The calibration result for fishmeal protein is given in Fig. 3. Fishmeal protein shows a SEP value of 0.54, slope of 1.0 and R value of 0.95, indicating a 95 percent agreement between laboratory and NIR values. Similar calibration results were obtained for moisture. Validation of calibration equation was carried out using independent sets of laboratory-analyzed fishmeal samples. The validation result for protein yielded an average difference of 0.04 percent between the laboratory and NIR method. It had a slope of 1.0 and R value of 0.99. Result for percent moisture showed very similar values.
Soybean meal
Soybean meal calibration result for percent protein is illustrated in Fig. 4. The figure shows a SEP of 0.138 and a slope of 1.0. The correlation coefficient value of 0.99 indicates a 99 percent agreement between laboratory and NIR measurements. Calibration result for fat was not as consistent as the result for protein. It had a correlation coefficient of 0.93 and an SEP value of 0.196. Independent sets of laboratory-analyzed soybean meal samples were used to validate the calibration equations for both protein and fat. Validation result for percent protein yielded a SEP value of 0.112, slope of 0.98 and R value of 0.99. Result for fat indicated a SEP value of 0.194 and R value of 0.96.
Conclusion, recommendations
NIR proved to be an accurate method for measuring the chemical composition of fishmeal and soybean meal. Acceptable and reproducible results were achieved using the existing and expanded calibration equations to predict protein and moisture in fishmeal, and to predict protein and fat in soybean meal. Our results showed low SEP, little or no bias, slope of 1.0 and R value close to 1.0, indicating a very good calibration for both fishmeal and soybean meal.
The potential for the use of NIR spectroscopy as a tool for rapid and accurate prediction of the chemical composition of fishmeal and soybean meal, including other shrimp feed ingredients, deserves further investigation. The collection of a wide and uniform range of representative samples is recommended for more calibration work. NIR is matrix-sensitive and requires substantial calibration development and maintenance to produce results with accuracy similar to chemical analyses, which require use of corrosive or toxic chemicals, none of which are needed for NIR analysis.
(Editor’s Note: This article was originally published in the October 2001 print edition of the Global Aquaculture Advocate.)
Now that you've reached the end of the article ...
… please consider supporting GSA’s mission to advance responsible seafood practices through education, advocacy and third-party assurances. The Advocate aims to document the evolution of responsible seafood practices and share the expansive knowledge of our vast network of contributors.
By becoming a Global Seafood Alliance member, you’re ensuring that all of the pre-competitive work we do through member benefits, resources and events can continue. Individual membership costs just $50 a year.
Not a GSA member? Join us.
Authors
-

The Oceanic Institute
Aquatic Feeds and Nutrition Program
41-202 Kalanianaole Highway
Waimanalo, Hawaii USA 96795 -
The Oceanic Institute
Aquatic Feeds and Nutrition Program
41-202 Kalanianaole Highway
Waimanalo, Hawaii USA 96795 -
Agricultural Diagnostic Service Center
University of Hawaii
Honolulu, Hawaii USA
Related Posts

Health & Welfare
Near-infrared spectrometers determine stage maturity in channel catfish
This study evaluated the feasibility of a portable, hand-held micro near-infrared spectrometer to objectively determine the stage of maturity in channel catfish. Such a rapid, non-invasive method to stage fish maturity in hatcheries would improve the efficiency of hatchery production.
Health & Welfare
Advice for managing predatory birds, part 2
A look at economic implications of predatory birds on commercial tilapia facilities, and the various control technologies – mostly non-lethal, such as frightening techniques – used by the industry to protect its farmed fish.
Aquafeeds
Effective ingredient specifications yield quality feeds
Aquafeed manufacturers can ensure quality by looking beyond price and with written ingredient specifications adhering to nutritional formulations.
Aquafeeds
NIRS technology ensures shrimp feed quality at farm level
Feed plants deal with varied raw materials, formulations and feeds for different animals, which can lead to quality issues and nutrient variations. Near-infrared spectroscopy (NIRS) has been successfully applied in Brazil to ensure feed quality standards at the farm level.