Global shrimp survey: GOAL 2016
Production could reach 4.44 million metric tons by 2018
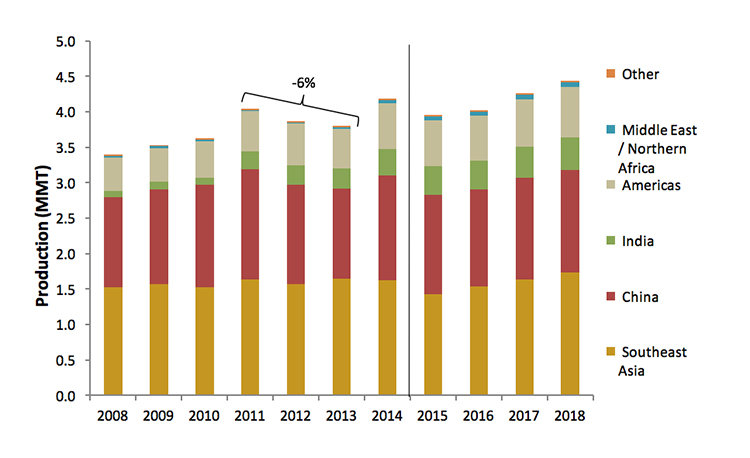
The Global Aquaculture Alliance’s GOAL (Global Outlook for Aquaculture Leadership) 2016 survey of production trends in shrimp farming polled 42 respondents from Asia/Oceania, 21 from Latin America and two from Africa. Fig. 1 summarizes the production estimates for global production during 2008-2018, which combine data from the United Nations’ Food and Agriculture Organization (FAO) and the 2014, 2015 and 2016 GOAL surveys.
[Editor’s note: To download a truncated version of the GOAL 2016 Global Shrimp Survey, as presented by Dr. Anderson at the GOAL conference in Guangzhou, China, in September, please click this link: goal2016_global-shrimp-survey]
Respondents in the 2014 survey had reported substantial production declines during 2012-2013 in China, Thailand, Vietnam and Mexico as a consequence of the Early Mortality Syndrome (EMS) disease that broke out in China in 2009. Surging shrimp prices in international markets during 2013 were consistent with industry expectations of declining production.

Nevertheless, the most recent FAO data show China’s production increasing 9 percent in 2012 and remaining stable in 2013. In the case of Mexico, FAO reported a 20 percent increase in 2013, even though production had contracted by half, according to industry reports. FAO data also seem to overestimate production in Honduras during 2013 and 2014.
Given these discrepancies, data from 2008 through 2011 in Fig. 1 correspond to FAO; data for China, Mexico and Honduras for 2012-2013 were obtained from the 2014 GOAL survey; data for China and Honduras for 2014 are from the 2015 GOAL survey; all other estimates through 2014 were obtained from FAO while estimates for 2015-2018 correspond to the 2016 GOAL survey. Discrepancies between FAO data and industry reports may narrow in the future as national governments and FAO revise their production statistics.
According to FAO, global shrimp farming production reached 4.05 million metric tons (MMT) in 2011 and then increased to 4.17 MMT in 2012 (up 3.0 percent), 4.32 MMT in 2013 (up 3.6 percent), and 4.58 MMT in 2014 (up 6.0 percent). In contrast, the GOAL surveys indicate that global production fell to 3.87 MMT in 2012 (down 4.3 percent) and further down to 3.80 MMT (1.8 percent) for an overall decline of 6 percent between 2011 and 2013 (Fig. 1). GOAL statistics confirm that there was a strong rebound in 2014 (up 10 percent to 4.18 MMT) followed once again by a decline in production in 2015 (down 5.4 percent) and recovery finally taking place from 2016 to 2018 at an approximate annual rate of growth of 3.9 percent. Global production is expected to reach around 4.44 MMT in 2018, barring a new disease crisis.
Asia production
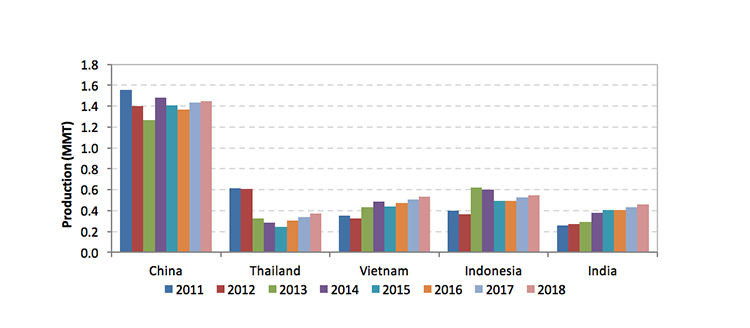
Shrimp production grew steadily in east Asia through 2011, averaging 6 percent annual growth from 2008 to 2011. The GOAL surveys indicate that production declined from 3.45 MMT to 3.25 MMT in 2012 (down 5.8 percent) and 3.21 MMT in 2013 (down 1.1 percent) due to the impact of EMS in China, Thailand, Vietnam and Malaysia (Fig. 2). Production increased substantially in 2014 to 3.49 MMT (up 8.5 percent) mostly due to the larger harvests reported in China, Vietnam and India.
Despite this recovery, survey respondents estimated that production decreased again in 2015 due to smaller harvests in China, Thailand, Vietnam and Indonesia. Although Thailand is expected to grow at an annual rate of 14.5 percent between 2015 and 2018 – with production reaching 370,000 MT in 2018 – this recovery would account nevertheless for only 60 percent of the production level reached in 2012, prior to the onset of EMS. By 2014, Indonesia, Vietnam and India had surpassed Thailand as the second largest producer in Asia. This trend is expected to continue through 2018 as the former countries grow at an average annual rate between 4 and 7 percent.

An uneven recovery from EMS is expected in China: While the nadir was apparently reached in 2013 at 1.27 MMT, output increased to 1.48 MMT as farming areas in the north of the country expanded production. However, output declined again (down to 1.40 MMT) in 2015 due to disease and extreme weather events. A relatively weak recovery is expected through 2018, with an average annual growth rate barely exceeding 1 percent during 2015-2018.
In conclusion, the Asian industry seems to be on the path of recovery following the substantial production declines in 2012 and 2013 caused by EMS. Production may reach 3.65 MMT by 2018, driven primarily by growth in Thailand, Indonesia, Vietnam and India. China will remain the largest producer but its contribution to regional growth will be more modest. Of course, these estimates rely on the assumption that no major disease will break out in the region in the next few years.
Latin America
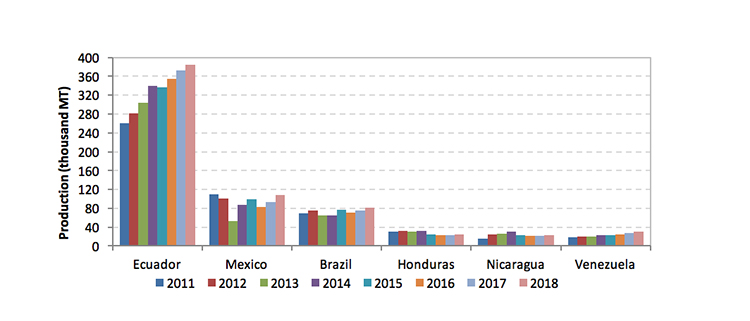
Fig. 3 presents estimates for the major producing nations in Latin America. Besides Asian countries, Mexico was heavily impacted by EMS in 2013: respondents reported a 48 percent decline in production, from 100,000 MT in 2012 to 52,000 MT in 2013. Output recovered substantially in 2014 and 2015, nearing pre-crisis levels. Growth through 2018 will be more moderate (around 3 percent per year), with production reaching nearly 110,000 MT. Still, this output falls short from the 130,000 MT harvested in 2008.
Most growth in the region will come from Ecuador, which should reach around 385,000 MT by 2018. Ecuador is increasingly targeting European and Asian markets in response to declining exports from east Asian nations. Brazil and Venezuela also expect to increase production by 2018, reaching 81,000 and 30,000 MT, respectively.
Although the region is expected to increase production from 646,000 MT in 2015 to 711,000 MT in 2018, only four countries will contribute to this growth: Ecuador, Mexico, Brazil, and Venezuela. Production in the remaining Latin American countries is in fact expected to fall from 109,000 to 105,000 MT between 2015 and 2018. The reasons for this decline are varied, ranging from the impact of diseases to the reduced potential for expansion of farming areas.
Product form trends
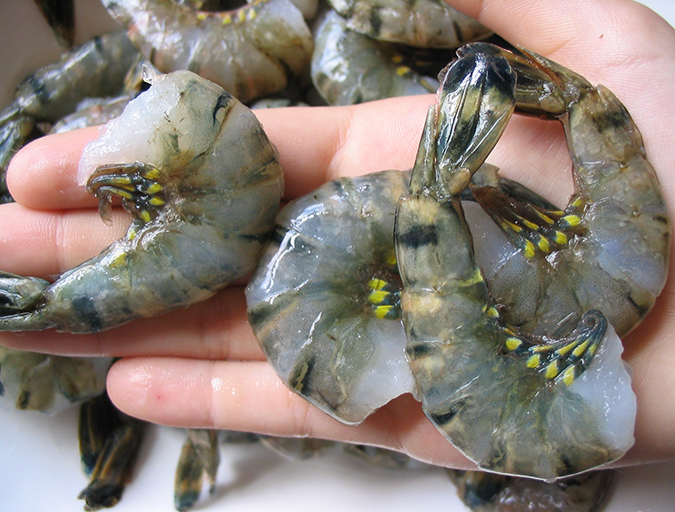
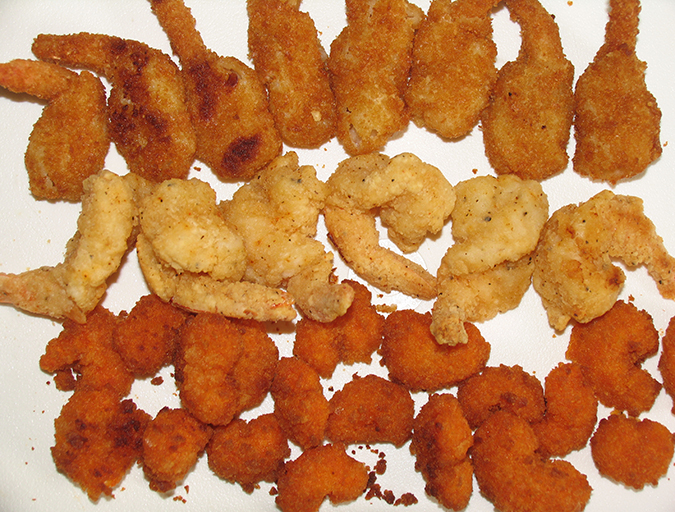
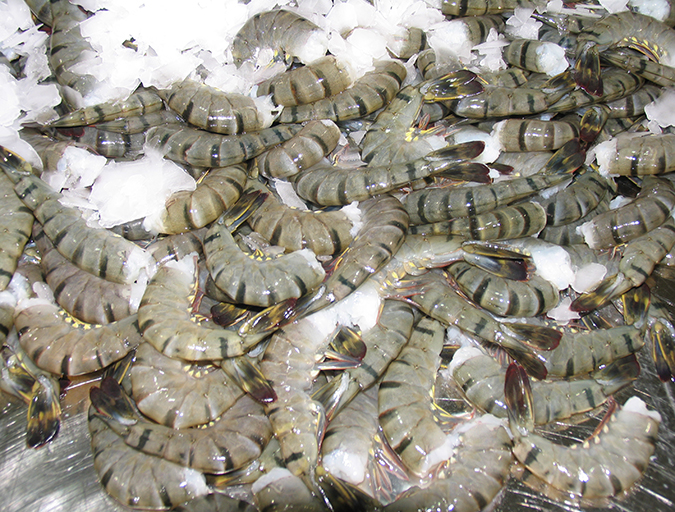
The GOAL survey also collects information on trends in size categories and product forms. A recent and notable trend in Asia is the increase of green shrimp relative to other product forms such as cooked and breaded. While head-on and head-off green shrimp accounted for only 25 percent of production in the 2008 survey, it accounted for 42 percent in the most recent poll. These changes may signal the growing importance of the domestic Chinese market, which has a preference for green shrimp over other processed forms.
Production in Latin America continues to be oriented towards green shrimp. Head-on shrimp has become the dominant product form over head-off shrimp. It accounted for 56 percent of production in 2015, up from 40 percent in 2007. Increased shipments of Ecuadorian shrimp to European and Asian markets are an important factor driving this trend.
Respondents in Asia have reported a move towards production of smaller shrimp sizes (51-60 and smaller) since 2011. The share of small counts increased from 27 percent to 42 percent between 2010 and 2015. The shift to smaller shrimp seems to have been driven by narrowing price margins between the small sizes and the larger counts. Early harvests caused by EMS and other factors also help explain this trend.
Disease impacts
“Diseases” was once again identified by respondents from Asia as the top challenge faced by the industry. Other disease-related issues such as “seed stock quality and availability” and “access to disease-free broodstock” were also ranked as major concerns – in the second and fourth positions, respectively. “Feed costs” ranked as the third most important issue in Asia.
In Latin America, “diseases” is also considered among the three most important issues affecting the industry. This year, however, respondents ranked “feed costs” and “market prices” as slightly more important.
Perceptions on diseases have changed remarkably over the last nine years. In the 2007 survey, “diseases” did not make it among the top three challenges for either Asian or Latin American producers, who used to be more concerned about feed costs, market prices and trade barriers. Disease issues have moved to the forefront in the most recent years, particularly in Asia given the strong impact of EMS.
Most Asian and Latin American respondents expect global economic conditions to either improve or remain stable in 2017; most respondents also expect the global shrimp market to strengthen in 2017. Upward pressure on feed prices is nevertheless expected to continue in 2017.
Now that you've reached the end of the article ...
… please consider supporting GSA’s mission to advance responsible seafood practices through education, advocacy and third-party assurances. The Advocate aims to document the evolution of responsible seafood practices and share the expansive knowledge of our vast network of contributors.
By becoming a Global Seafood Alliance member, you’re ensuring that all of the pre-competitive work we do through member benefits, resources and events can continue. Individual membership costs just $50 a year.
Not a GSA member? Join us.
Authors
-

Director, Institute for Sustainable Food Systems
Professor, Food and Resource Economics
University of Florida -

Associate Professor, School of Management
University of Los Andes, Colombia -

Editor Emeritus
Global Aquaculture Advocate
Related Posts

Intelligence
GOAL video: James Anderson on shrimp trends
James Anderson delivered a data-rich survey on global shrimp and finfish production volumes for the Global Aquaculture Alliance at its GOAL conference in October. See the full video of his presentation.
Intelligence
GOAL Shrimp Production Survey: Recovery coming
The GOAL 2015 Shrimp Production Survey showed that global farmed shrimp production is rebounding from the decrease seen from 2011 to 2013 due to diseases, and is headed to an all-time high of around 4.8 million metric tons in 2017, barring any new crises.

Innovation & Investment
Results of the GOAL 2016 audience poll questions
Each year the attendees of the Global Aquaculture Alliance’s GOAL conference – held in September in Guangzhou, China – have the opportunity to answer poll questions posed by speakers and moderators of panel discussions.
Intelligence
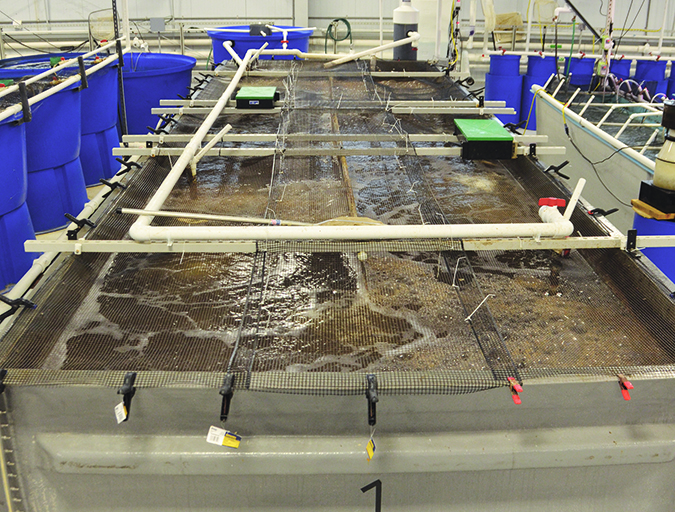
Indoor-raised shrimp find potential market in Kentucky test
By raising shrimp in a closed building, producers can increase biosecurity, produce shrimp more consistently, grow shrimp year-round and locate production centers near markets. Chefs and consumers were very accepting of whole fresh shrimp, offered at a farmers market, that was farmed indoors in Kentucky.