Using environmental DNA metabarcoding to identify and monitor pelagic fish biodiversity in the Western Indian Ocean
Ninety-eight fish species were detected from 176 seawater eDNA samples, with composition and relative abundance of economic species showing expected differences from fishery statistics
The Indian Ocean is the world’s third-largest ocean, covering approximately 29 percent of the global ocean area, and its fisheries catch accounts for about 15 percent of the global marine capture production. While catch volumes in other major ocean regions are declining, the Indian Ocean remains one of the few areas where fishing yields have continued to grow.
Understanding the fish composition of the Indian Ocean is crucial for assessing the socioeconomic impact on the region, as fish are a primary source of food and income for many coastal communities. At the same time, changes in the fish composition of the Indian Ocean can reflect the impact of climate change on marine ecosystems, providing valuable information for predicting future trends and developing sustainable management strategies.
To complement traditional trawling methods for biodiversity surveys of fishery resources, environmental DNA (eDNA) metabarcoding has emerged in recent years and played an increasingly important role in the investigation of fishery resources. eDNA consists of the DNA molecules or fragments that organisms continuously shed into the environment through biological materials such as skin, mucus, saliva, sperm, eggs, feces, urine and decomposing bodies. The technology associated with eDNA involves the qualitative and quantitative analysis of DNA extracted from environmental samples.
This is achieved using techniques like quantitative PCR and high-throughput sequencing, enabling researchers to infer and assess the presence, species diversity, abundance and distribution of organisms within a specific environment. Compared to traditional monitoring methods, eDNA analysis offers several advantages, including its non-invasive nature, high sensitivity, and the ability to detect multiple species simultaneously.
![Ad for [membership]](https://www.globalseafood.org/wp-content/uploads/2025/07/membership_web2025_1050x125.gif)
This article – summarized from the original publication (Lyu, D. et al. 2025. Monitoring Fish Biodiversity in the Pelagic Zone of the Western Indian Ocean Using Environmental DNA Metabarcoding. Biology 2025, 14(9), 1194) – applied environmental DNA (eDNA) metabarcoding (the barcoding of DNA/RNA in a manner that allows for the simultaneous identification of many taxa within the same sample) for a species diversity survey in the Western Indian Ocean, offering a more reliable, efficient and non-invasive alternative to traditional methods.
Study setup
This study tested a new method using environmental DNA in the Western Indian Ocean. Instead of catching fish, we collected seawater from different depths at 130 locations and looked for tiny traces of DNA (eDNA) that fish leave behind. We conducted water sampling from December 2023 to February 2024. The survey area covered the Western Indian Ocean, with a total of 130 survey stations. The total coverage area of all station positions is approximately 396,000 square nautical miles (nmi2; a nautical mile is 1,852 meters), with adjacent stations spaced about 15 nmi apart.
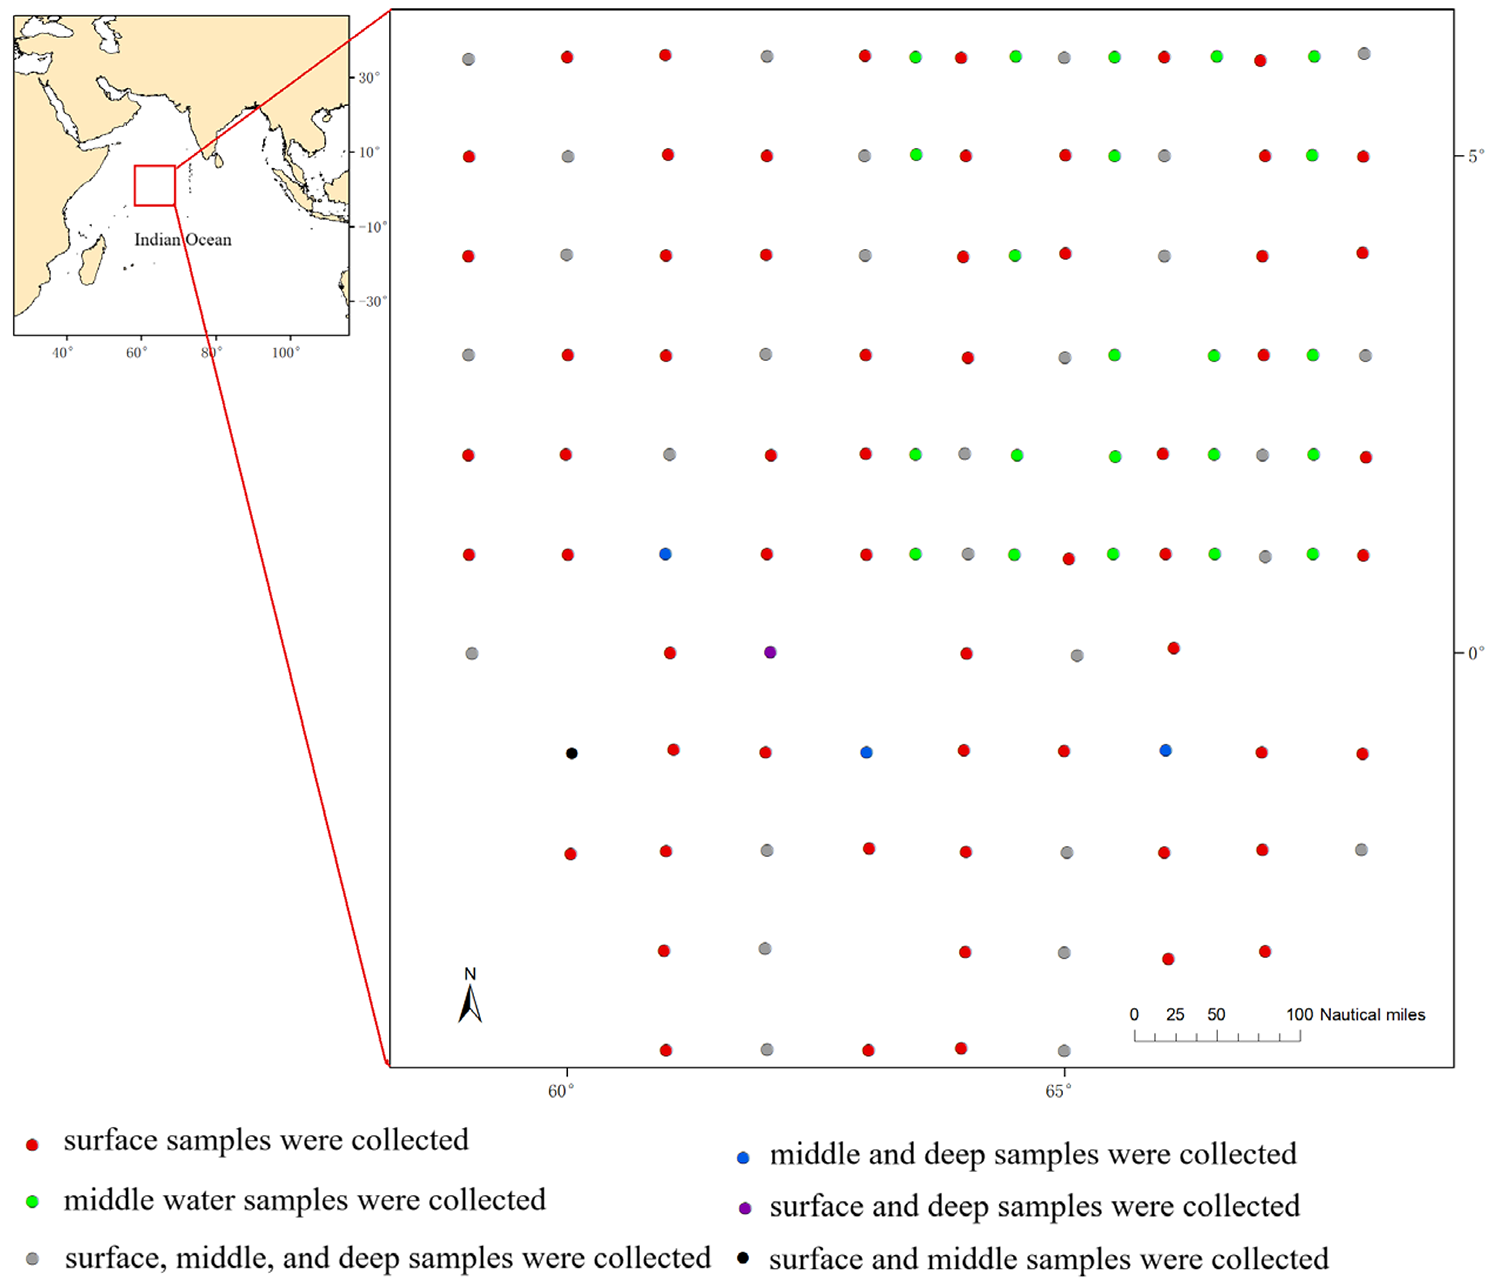
Out of the 130 stations, 34 stations were sampled for surface (with the depth of 0 meters), middle layer (100 meters) and deep (300 meters) water samples; 66 stations were sampled only for surface water; and 30 stations were sampled only for middle layer water. Thus, a total of 198 water samples were collected. Due to the large sample size in this study, sample duplication was not set in this study. Fish species diversity was analyzed through 12S rRNA gene amplicon sequencing; the 12S rRNA gene is a widely used molecular marker to identify species, and amplicon sequencing is a highly targeted approach that enables researchers to analyze genetic variation in specific genomic regions.
For detailed information on the experimental design, sample collection and preparation and eDNA analyses, refer to the original publication.
Detection and quantification of sea lice using eDNA around aquaculture locations
Results and discussion
Using eDNA metabarcoding for aquatic species diversity surveys is highly attractive and its potential has been demonstrated in numerous studies. Previous fish eDNA detection studies have often focused on freshwater or nearshore regions. The challenges of pelagic research lie in the difficulty of sampling, and compared to nearshore and freshwater areas, pelagic regions lack sufficient fishery catch data for comparison and support. However, this also highlights the significant importance of conducting fish species diversity surveys in the pelagic zone using eDNA.
In this study, eDNA metabarcoding was applied to assess species diversity in the pelagic zone of the Western Indian Ocean. While evaluating the fish composition of the region, we also explored the potential application of eDNA metabarcoding for fish detection in pelagic areas. Even after removing species with low copy numbers, which were considered false positives, we detected 98 fish species.
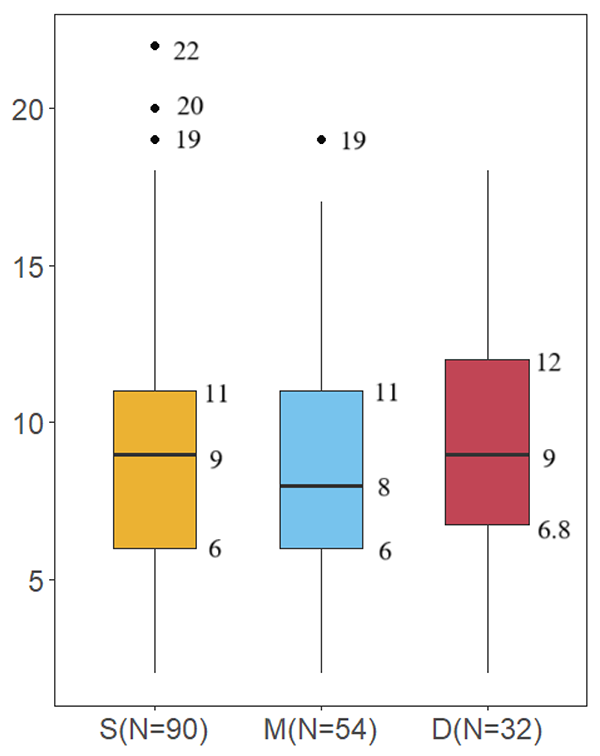
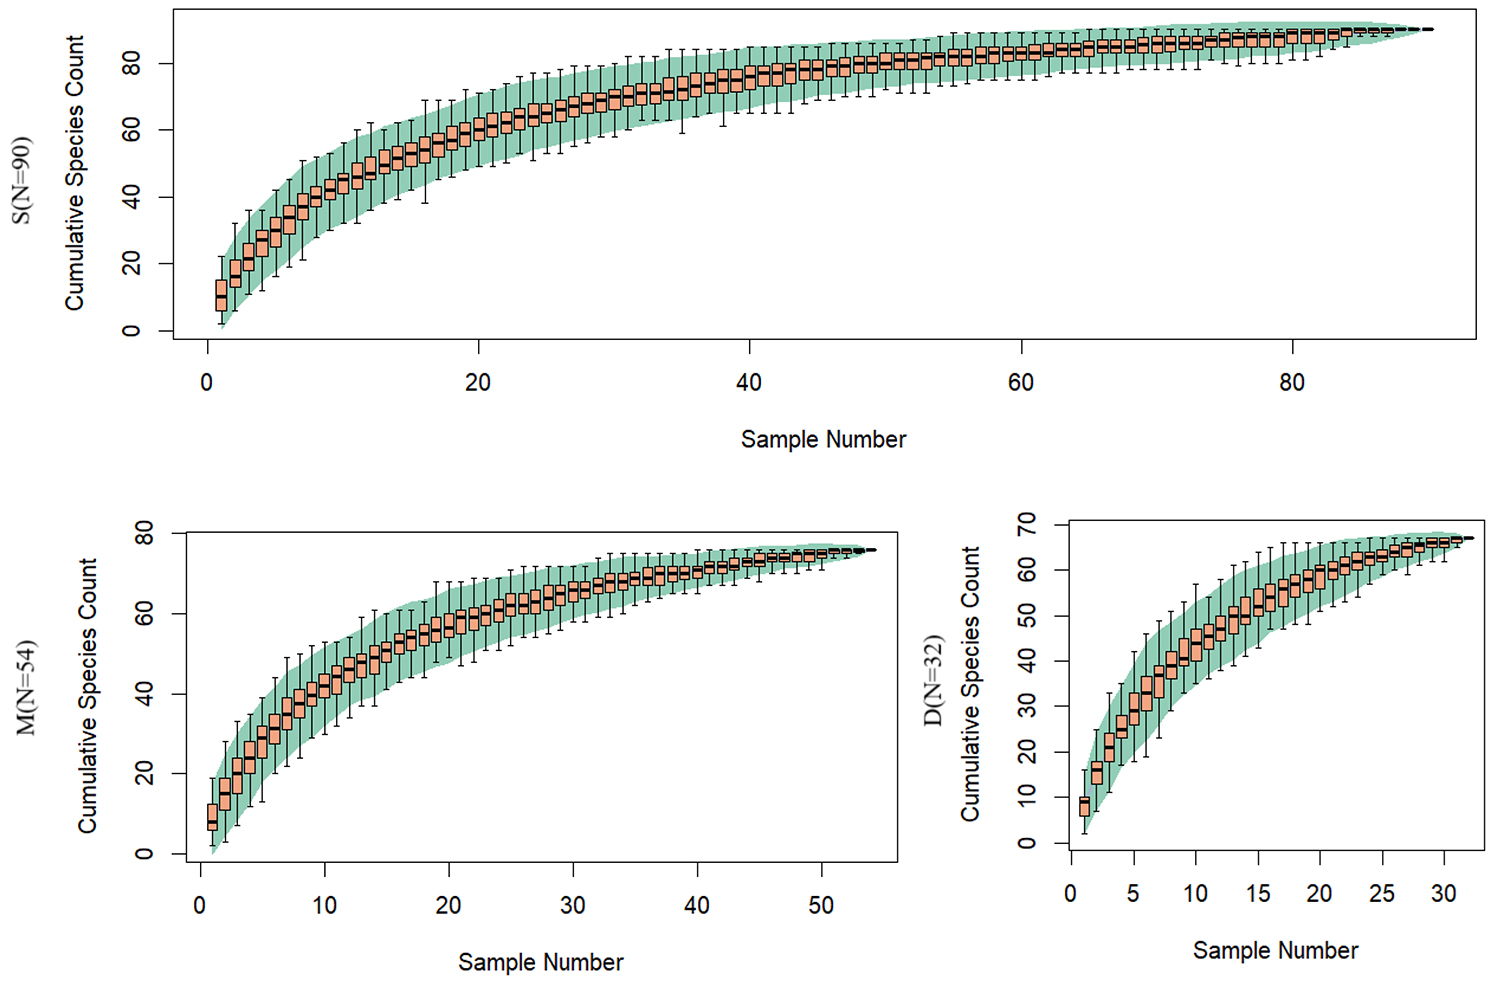
Although the pelagic region was generally considered to have fewer species due to its simple environment and limited habitats and resources, this study still achieved a considerable number of species observations compared to previous studies. The main reason for this was the large sample size in this study. However, the number of species identified from a single sample was quite low, typically ranging from two to 22 species.
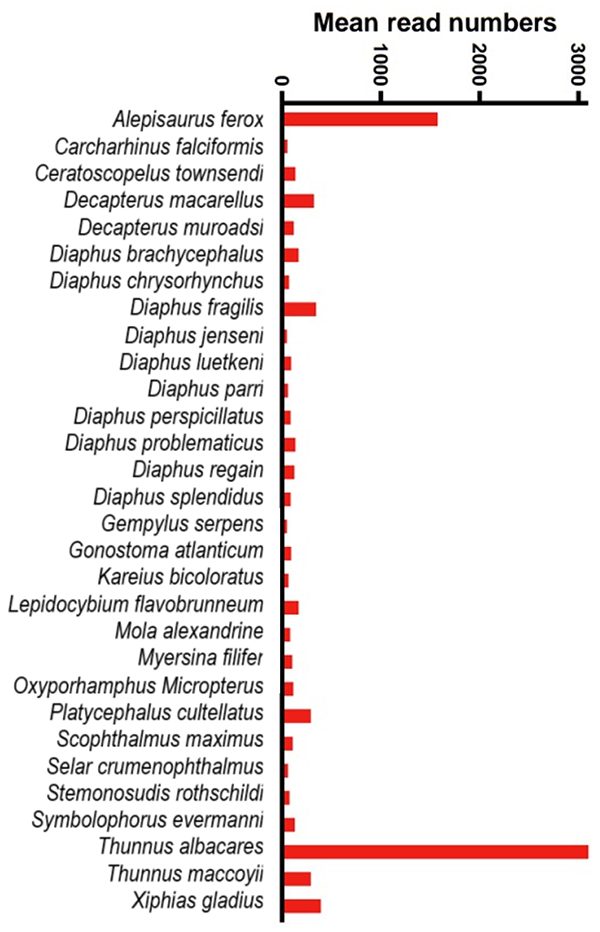
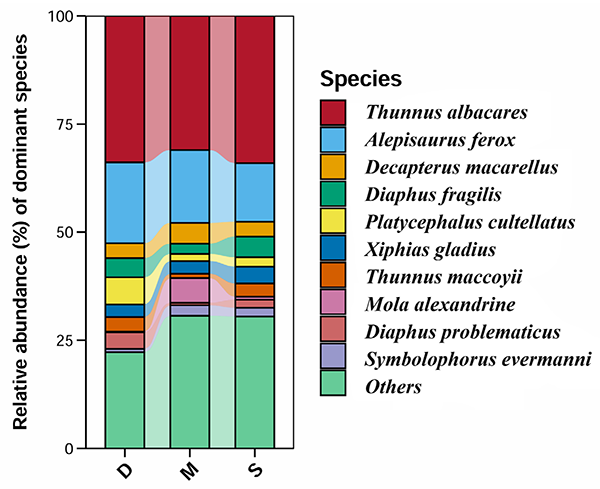
The fish families with the highest relative abundance in this study included Scombridae (mackerels, tunas and bonitos), Myctophidae (lanternfishes) and Alepisauridae (lancet fishes).
According to FAO statistics (accessed on 5 June 2024), the Scombridae family accounted for the highest catch in the Western Indian Ocean, making up 50 percent of the total catch. In this study, the relative abundance of Scombridae was also quite high (38.02 percent).
Other fish species with higher catch rates in the Western Indian Ocean included Clupeidae (herrings and sprats), Carangidae (jacks, pompanos, jack mackerels, runners, trevallies and scads) and Serranidae (sea bass and grouper). Clupeidae and Carangidae were less abundant, while Serranidae was not detected. The suspected reason for this is that the sampling area in this study is located in the oceanic region, which is different from the habitats of these species.
There are several possible reasons for the low number of species identified in a single sample, including the relatively low number of species in the pelagic region, the low concentration of eDNA, and the incompleteness of the database. Another possible reason is that the higher water temperature in the tropical region increases the degradation rate of eDNA. A larger sample size is essential, and this conclusion is further supported by the species accumulation curve.
Data also showed that, within the 300-meter depth range covered in this study, there was no significant difference in species diversity. The comparison of different water layer samples suggests that collecting only surface and deep-water samples is sufficient for species identification, and middle water samples can be omitted. If the goal is to further reduce sampling costs, collecting only surface water samples would cover the vast majority of species and diversity information. It is also worth noting that no clear pattern was observed in the diversity indices across different sampling stations, indicating that species identification at different stations has a significant degree of randomness.
The primary source of randomness may stem from the fact that eDNA is not uniformly distributed within water bodies but exists as particles of varying sizes. Additionally, variations in sampling timing and the impacts of hydrodynamic processes such as water movement and diffusion may contribute to this observed randomness. To address these challenges, in addition to the previously recommended strategy of increasing sample size, implementing standardized sampling protocols across large spatial scales while comprehensively accounting for environmental variables and hydrodynamic influences will be crucial for enhancing the accuracy and reliability of future eDNA-based studies.
Results also suggested that an eDNA-based survey still cannot fully meet the needs of assessing fish relative abundance. For example, errors introduced by differences in PCR amplification efficiency of different sequence types in eDNA samples are unavoidable. Sequencing read counts cannot accurately represent the relative abundance of eDNA from different species in the sample.
Although eDNA-based fish surveys have been widely applied, this method still has several limitations. For example, this study identified some species that should not have been present in the Indian Ocean. In addition to potential false positives, the removal of low-copy-number species in this study may lead to the loss of rare species (false negatives). Establishing a comprehensive and targeted barcode database is an important solution to this issue. Although this task is challenging, it is still necessary to enhance the practicality of eDNA metabarcoding.
In this study, we only used a pair of universal primers as the research tool, while the selection of universal primers can also impact taxonomic coverage. Considering that tropical oceans are rich in fish diversity, the species detection rate using a single primer might be unsatisfactory. To address these limitations, using multiple sets of universal primers, along with validating and supplementing results from different primers, is an effective way to improve the reliability of eDNA survey results.
Additionally, environmental factors that affect eDNA persistence, such as ocean mixing, temperature, and depth gradients, were not analyzed in this study. In future research, considering environmental factors and understanding eDNA behavior in tropical aquatic environments, as well as standardizing analytical procedures, are also ways to enhance the reliability of marine eDNA studies.
Perspectives
This study is the first to investigate the fish diversity in the Western Indian Ocean’s pelagic zone using eDNA metabarcoding, detecting a total of 98 fish species, including many important economic species. It determined that within a depth range of 300 m, the species and diversity indices identified from eDNA samples at different water layers were similar. The species composition and relative abundance of economic species observed in this study differed somewhat from FAO fishery catch statistics, a result that was anticipated. The results of this study provide a new perspective on species diversity in the Western Indian Ocean and suggest that eDNA is an important complement to traditional survey methods to monitor fish biodiversity in the oceanic region.
Now that you've reached the end of the article ...
… please consider supporting GSA’s mission to advance responsible seafood practices through education, advocacy and third-party assurances. The Advocate aims to document the evolution of responsible seafood practices and share the expansive knowledge of our vast network of contributors.
By becoming a Global Seafood Alliance member, you’re ensuring that all of the pre-competitive work we do through member benefits, resources and events can continue. Individual membership costs just $50 a year.
Not a GSA member? Join us.
Authors
-

State Key Laboratory of Mariculture Biobreeding and Sustainable Goods, Yellow Sea Fisheries Research Institute, Chinese Academy of Fishery Sciences, Qingdao 266071, China
-
State Key Laboratory of Mariculture Biobreeding and Sustainable Goods, Yellow Sea Fisheries Research Institute, Chinese Academy of Fishery Sciences, Qingdao 266071, China
-
State Key Laboratory of Mariculture Biobreeding and Sustainable Goods, Yellow Sea Fisheries Research Institute, Chinese Academy of Fishery Sciences, Qingdao 266071, China
-
State Key Laboratory of Mariculture Biobreeding and Sustainable Goods, Yellow Sea Fisheries Research Institute, Chinese Academy of Fishery Sciences, Qingdao 266071, China
-
State Key Laboratory of Mariculture Biobreeding and Sustainable Goods, Yellow Sea Fisheries Research Institute, Chinese Academy of Fishery Sciences, Qingdao 266071, China
-
State Key Laboratory of Mariculture Biobreeding and Sustainable Goods, Yellow Sea Fisheries Research Institute, Chinese Academy of Fishery Sciences, Qingdao 266071, China
-
Corresponding author
State Key Laboratory of Mariculture Biobreeding and Sustainable Goods, Yellow Sea Fisheries Research Institute, Chinese Academy of Fishery Sciences, Qingdao 266071, China -
State Key Laboratory of Mariculture Biobreeding and Sustainable Goods, Yellow Sea Fisheries Research Institute, Chinese Academy of Fishery Sciences, Qingdao 266071, China
Related Posts
Intelligence
DNA barcoding applications in aquaculture
DNA barcoding is an exciting tool for the identification of fish. Even non-taxonomists can classify organisms through the molecular taxonomy technique.
Health & Welfare
Barcoding, nucleic acid sequencing are powerful resources for aquaculture
DNA barcoding and nucleic acid sequencing technologies are important tools to build and maintain an identification library of aquacultured and other aquatic species that is accessible online for the scientific, commercial and regulatory communities.

Fisheries
Can a data-sharing tool eliminate IUU fishing and make seafood supply chains more reliable?
The Sustainable Fisheries Partnership’s new data-sharing tool helps users identify environmental risks and eliminate IUU fishing in seafood supply chains.
Fisheries
Trawl surveys, environmental DNA analysis and scientific echo sounder techniques to analyze the East China Sea fisheries resources
The complementary strengths of each method of fisheries analysis support the understanding of spatiotemporal dynamics of fish communities.