Trawl surveys, environmental DNA analysis and scientific echo sounder techniques to analyze the East China Sea fisheries resources
Comparative analysis revealed that eDNA is sensitive to pelagic and cryptic species, trawl surveys effectively detect demersal fish, and acoustics allow for broad-scale biomass estimation

The East China Sea (ECS) is a semi-enclosed continental shelf sea bordered by Korea, Japan, China and Taiwan, covering an area of approximately 744,000 square km. It is a highly productive marine ecosystem that serves as a key spawning and overwintering ground for various commercial fish species. High densities of migratory species such as Japanese anchovy, sardine, hairtail, mackerel and horse mackerel are distributed throughout the region, supporting the coastal fisheries of China. The ECS is influenced by several major currents and from freshwater input from the Yangtze River, resulting in strong seasonal variations in sea temperature, salinity, nutrients and dissolved oxygen, which in turn lead to dynamic changes in fish community structure and resource abundance.
Over the past decades, excessive fishing, land-based pollution and climate change have significantly reduced fishery resources in the ECS. Although management measures such as seasonal fishing bans and trawl prohibition zones have been implemented, negative trends – including community simplification, the dominance of small-sized species and a decline in biodiversity – continue to persist. Thus, the development of a precise and timely monitoring system is urgently needed to evaluate resource recovery potential and support effective management strategies.
Few studies have applied tri-method integration – combining bottom trawl, eDNA metabarcoding and multi-frequency hydroacoustic surveys – on a seasonal scale in large and biologically complex regions such as the ECS. In this study, we developed a comprehensive assessment framework that integrates these three approaches to examine the spatiotemporal dynamics of fish species composition and biomass.
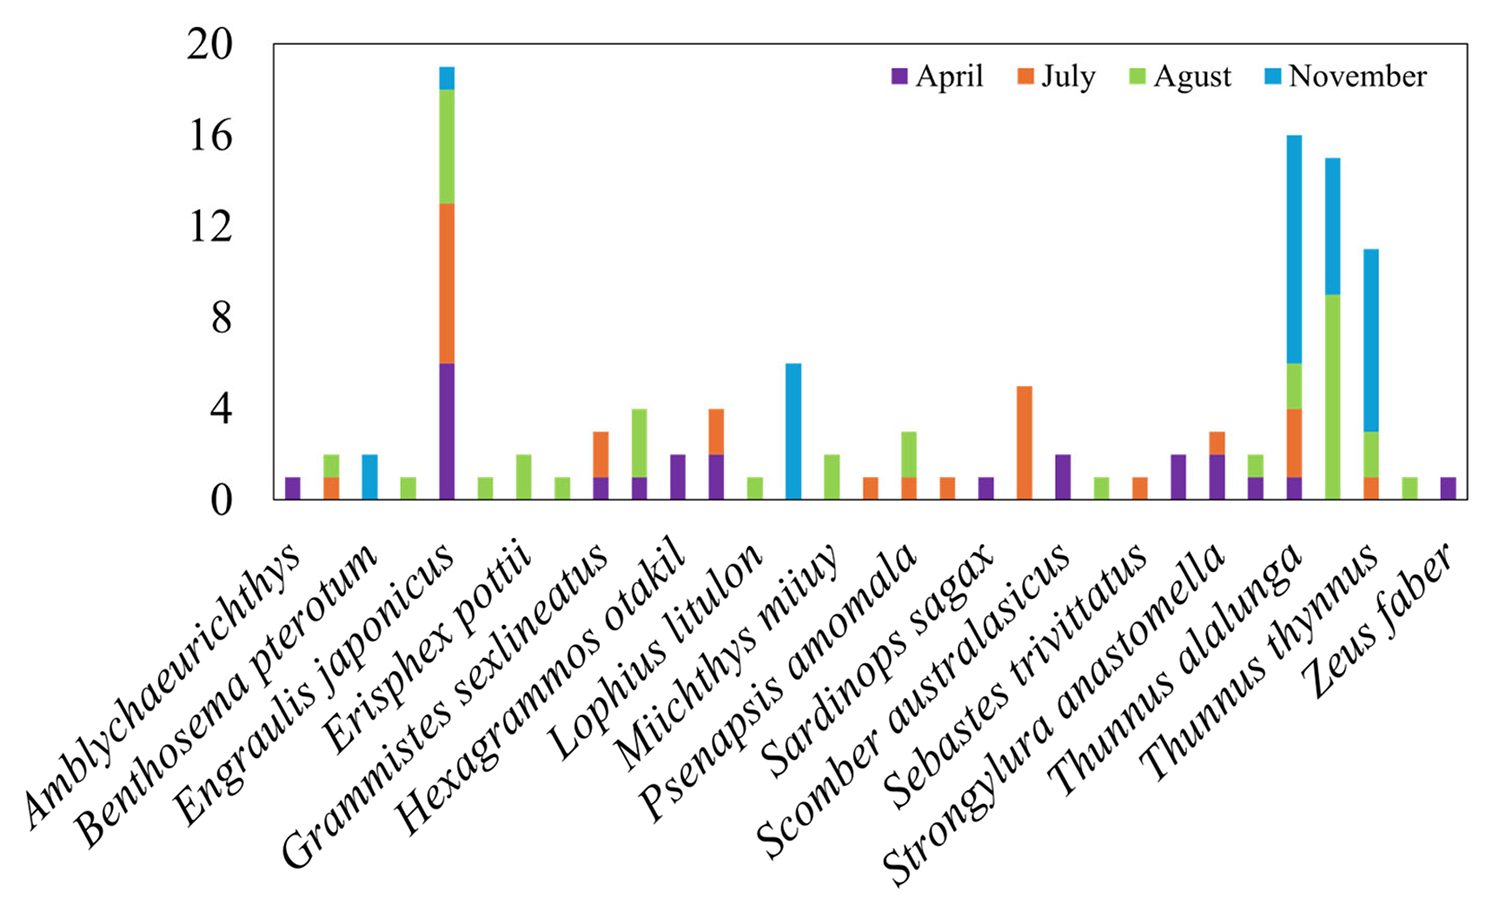
This article – summarized from the original publication (Lee, S. et al. 2025. Analysis of Fishery Resource Distribution and Seasonal Variations in the East China Sea: Utilizing Trawl Surveys, Environmental DNA, and Scientific Echo Sounders. Water 2025, 17(16), 2477) – reports on a study that assessed species composition using both bottom trawl surveys and eDNA analysis and identified dominant species for each method.
![Ad for [BSP]](https://www.globalseafood.org/wp-content/uploads/2025/07/BSP_B2B_2025_1050x125.jpg)
Study setup
Surveys were conducted in the East China Sea with a training vessel from Chonnam National University (Republic of Korea). Seasonal surveys were conducted in April, July, August and November 2022, covering a total survey area of approximately 33,104 square km.
Acoustic surveys were performed on five transects during each season, and in addition to acoustic and biological surveys, oceanographic environmental data were collected during each cruise to assess the physical and chemical conditions of the water column. The fishing catch survey was conducted using a bottom trawl net installed on the training vessel. This integrative approach allows for a comparative analysis of species-level abundance estimates across methods, enabling a more ecologically informed interpretation of fishery resources by leveraging the distinct detection characteristics of each method, despite their respective limitations.
For detailed information on the experimental design, surveys, sample collections, eDNA extraction and metabarcoding analysis; acoustic data analysis; fish density estimation and other analyses, refer to the original publication
Results and discussion
This study evaluated the seasonal variations in fish species composition and distribution in the East China Sea through a multi-method approach, incorporating bottom trawl surveys, eDNA metabarcoding, and scientific echo sounder-based acoustic techniques during April, July, August and November 2022. Each method differs in terms of ecological detection range, spatial coverage, and sensitivity, and their integrated comparison contributes to a more comprehensive understanding of the spatiotemporal dynamics of marine ecosystems.
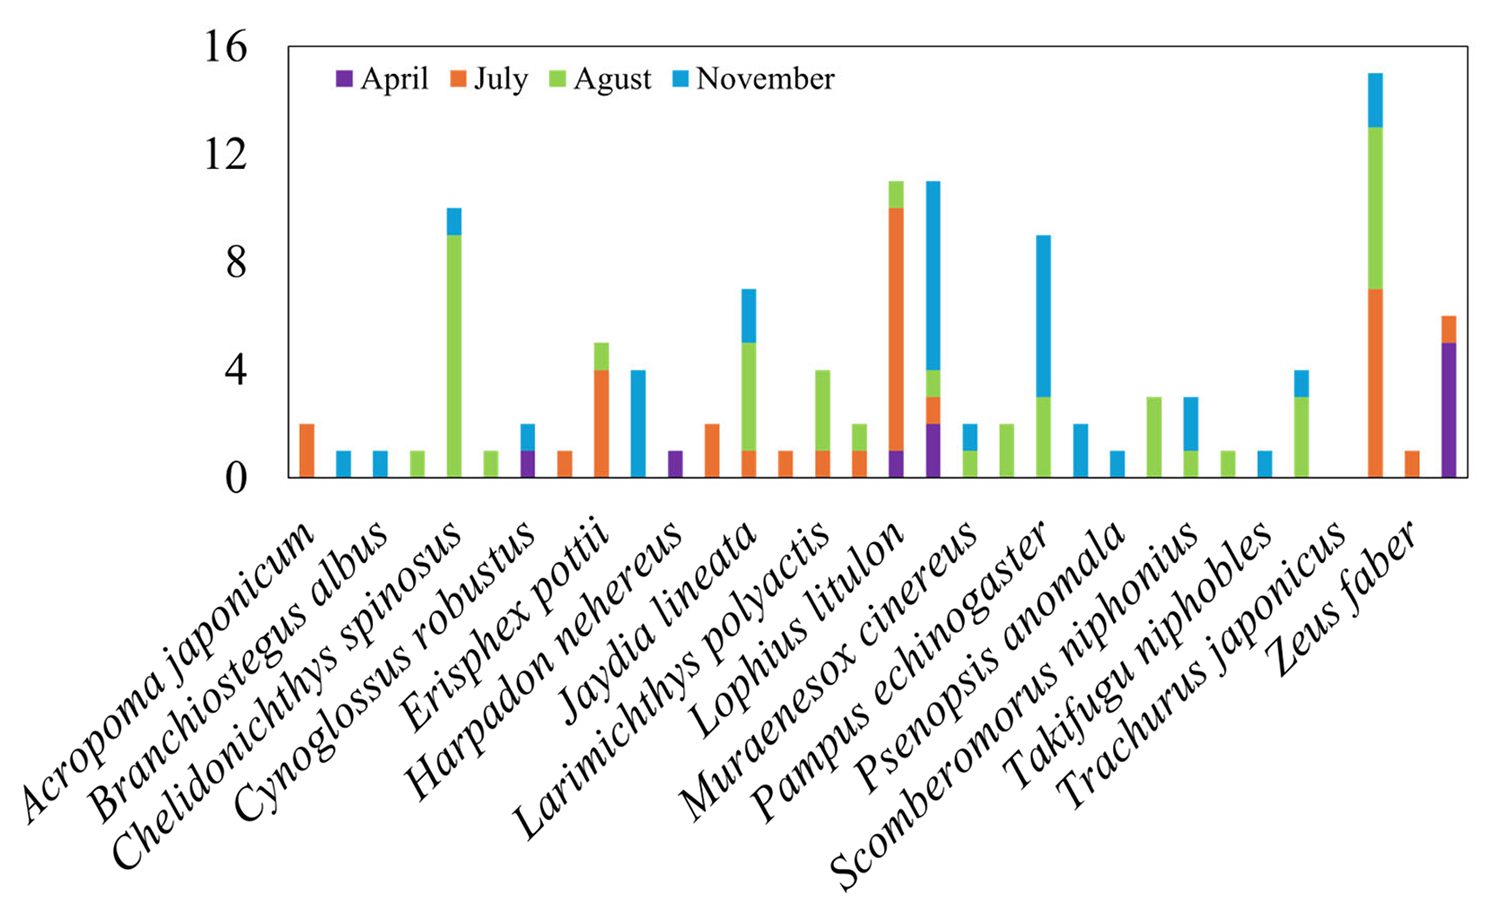
Furthermore, this research empirically compared the ecological detection ranges, sensitivities, and biases of each survey method by analyzing results from the same sampling stations. The trawl survey demonstrated strength in detecting demersal species and enabling physical specimen collection, but it tended to underestimate pelagic or migratory species. eDNA metabarcoding enabled broad taxonomic detection with a high sensitivity, yet showed limitations for mid- and deep-water species due to DNA degradation, dilution and primer specificity issues. Acoustic methods provided high-resolution biomass estimates for schools above a certain body size but lacked the capacity for species identification and excluded species without established TS (target strength) values.
Substantial differences in biomass estimates were observed among the methods. For example, eDNA-based density values were up to 15 times higher than those from trawl surveys, reflecting differences in detection sensitivity and data processing approaches. These discrepancies reflect the method-specific biases and detection scopes, emphasizing the importance of cautious integration rather than conducting a simple cross-method comparison. Recognizing and strategically integrating their respective strengths and limitations can help construct a more nuanced and balanced assessment of fish community structure and biomass, rather than relying on any single method.
Seasonal environmental changes had a clear influence on fish community structures. Water temperature, salinity, dissolved oxygen, and pH formed distinct water mass characteristics each month, affecting the occurrence and vertical distribution of dominant species. In August, vertical mixing and increased surface temperature facilitated the upward movement of demersal and mesopelagic species, resulting in greater overlap in dominant taxa between the trawl and eDNA analyses. Indeed, ten shared dominant species were identified by both methods in August, reflecting a seasonal convergence in vertical distribution. A similar trend was also reported in a previous study in the Zhoushan coastal region.
In contrast, during stratified seasons such as April and November – when strong vertical layering was induced by temperature and salinity gradients – the species composition was distinctly separated between surface and bottom layers, resulting in minimal species overlap between the eDNA and trawl results. This illustrates the ecological detection differences among methods. Other authors have reported that eDNA is more effective in detecting mobile or surface-dwelling species, while trawling is specialized for benthic species, indicating the complementary nature of the two approaches.
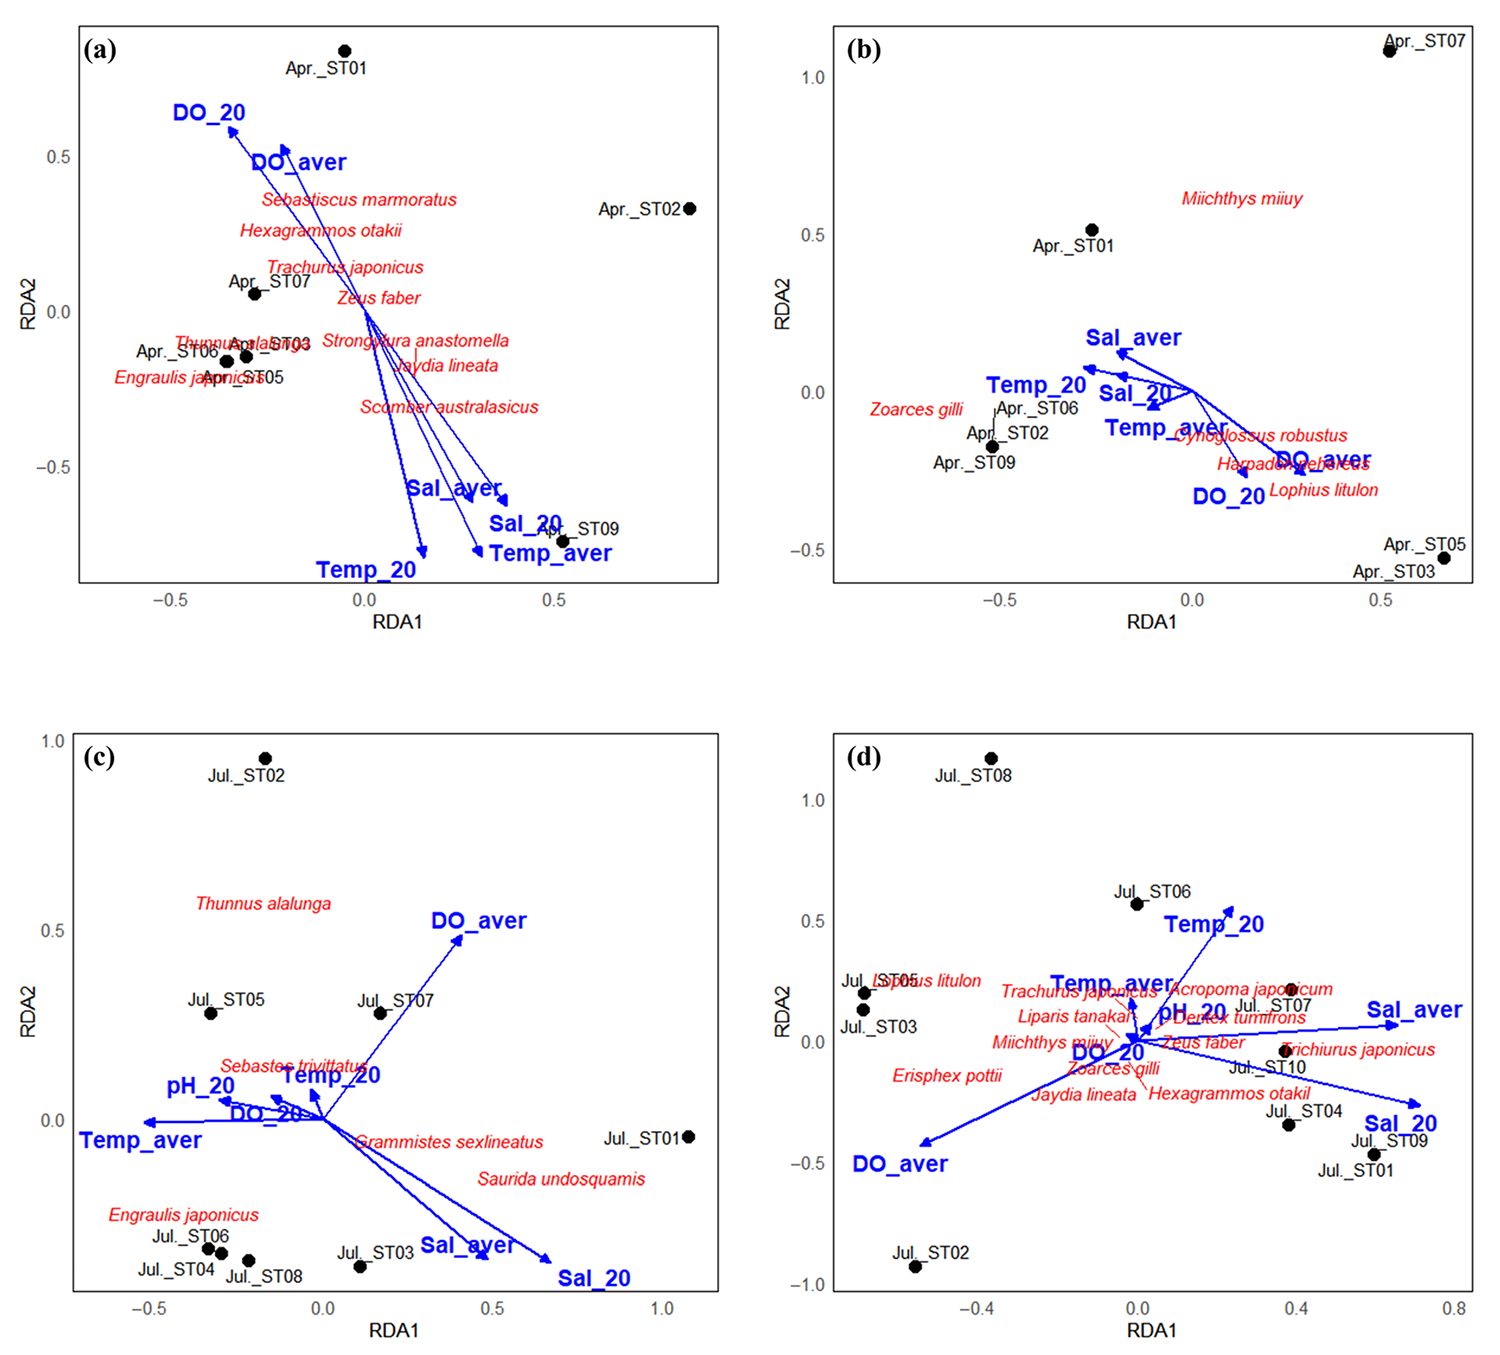
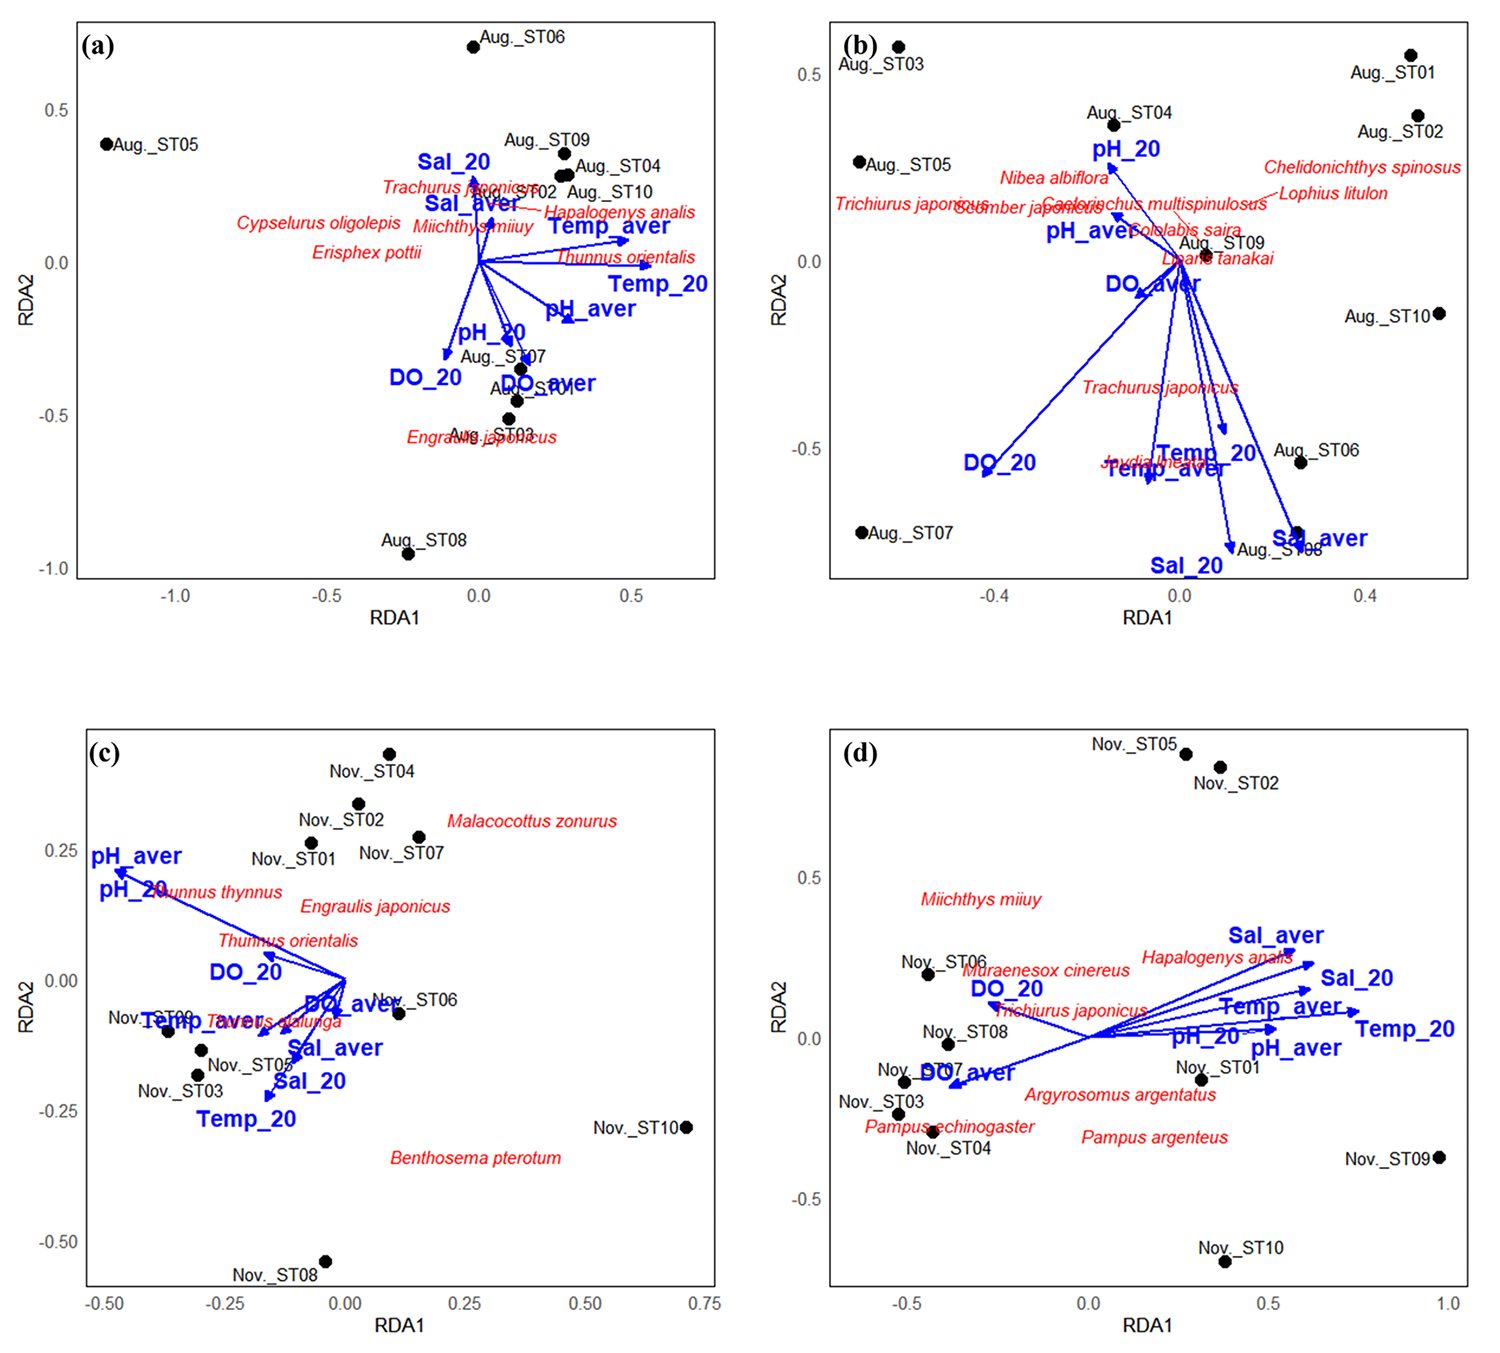
To further explore these seasonal patterns, redundancy analyses (RDA) were conducted using both eDNA and trawl datasets for each sampling month. The RDA plots revealed distinct differences in species composition and environmental responses between the two methods. These RDA results further support the seasonal variability in method-specific detection efficiency and reinforce the complementary nature of eDNA and trawl surveys (Figs. 3-4).
Acoustic-based density analyses also revealed discrepancies. Biomass derived from trawl data peaked in November, whereas the highest eDNA-based density was observed in April. This may reflect the acoustic method’s sensitivity to species-specific biomass concentration, body size, vertical distribution, and the availability of target strength (TS) information. In contrast, eDNA analysis, due to its surface-oriented sampling and the limitations of its genetic reference databases, may lead to the over- or underestimation of certain species. This highlights the strong influence of surface sampling on eDNA detection sensitivity, especially during warm seasons when DNA degradation accelerates, potentially resulting in underestimation.
These results suggest that a simple cross-comparison among survey methods is challenging. While biomass or other units of measurement are useful for spatial comparison, they cannot serve as a representative index of total resources unless sensitivity, detection range, and data quality of each method are jointly considered. Furthermore, eDNA has a high potential for broad species detection but faces challenges in species-level accuracy due to marker redundancy and incomplete reference databases.
In the future, it is necessary to quantify the detection sensitivity and false positive/negative rates of each method and to integrate data from co-located stations or probabilistic models for a comparison of their reliability and calibration. Survey design improvements such as collecting eDNA samples by depth layers, introducing midwater and surface trawls, and obtaining high-resolution TS data by species are also required. These approaches will enhance the accuracy of monitoring in seasonally dynamic ecosystems like the East China Sea and support the development of customized strategies for different target species across seasons.
Perspectives
This study investigated the seasonal dynamics of fish communities in the East China Sea based on seasonal surveys conducted in April, July, August and November. In conclusion, it demonstrates an integrated approach combining eDNA, trawl and acoustic methods for fishery resource assessment in the East China Sea. By highlighting the complementary strengths of each method, we provide a robust basis for understanding the spatiotemporal dynamics of fish communities and for advancing more accurate and sustainable fishery management strategies.
The seasonal shifts observed in species composition reaffirm the ecological role of the East China Sea as a key spawning and overwintering ground and indicate a strong correlation between species turnover and environmental drivers. Notably, during the warm summer period, vertical water mass stratification and hypoxia directly influenced fish community structure, either by causing an upward redistribution or a reduced density of certain species. Understanding such spatiotemporal dynamics is fundamental for effective fishery resource assessment and management.
Future studies should incorporate depth-stratified eDNA sampling and mid- and surface-layer trawl surveys to better resolve vertical distribution patterns. Additionally, the development of machine learning-based integrative models is needed to unify occurrence data across survey types. Ultimately, by establishing models that quantitatively link fish occurrence with environmental variables (e.g., temperature, salinity, and dissolved oxygen), we can enhance our predictive understanding of community dynamics. This will provide a critical scientific foundation for sustainable fishery resource management in highly dynamic regions like the East China Sea.
Now that you've reached the end of the article ...
… please consider supporting GSA’s mission to advance responsible seafood practices through education, advocacy and third-party assurances. The Advocate aims to document the evolution of responsible seafood practices and share the expansive knowledge of our vast network of contributors.
By becoming a Global Seafood Alliance member, you’re ensuring that all of the pre-competitive work we do through member benefits, resources and events can continue. Individual membership costs just $50 a year.
Not a GSA member? Join us.
Authors
-

Department of Marine Production Management Major of Fisheries Physics, Pukyong National University, Busan 48513, Republic of Korea
-
College of Fisheries and Ocean Sciences Training Ship Administrative Center, Chonnam National University, Yeosu 59626, Republic of Korea
-
Institute of Low-Carbon Marine Production Technology, Pukyong National University, Busan 48513, Republic of Korea
-
Institute of Low-Carbon Marine Production Technology, Pukyong National University, Busan 48513, Republic of Korea
-
Corresponding author
Division of Marine Production System Management, Pukyong National University, Busan 48513, Republic of Korea