Comparing imaging sonar and optical camera technologies for estimating fish densities at artificial reefs
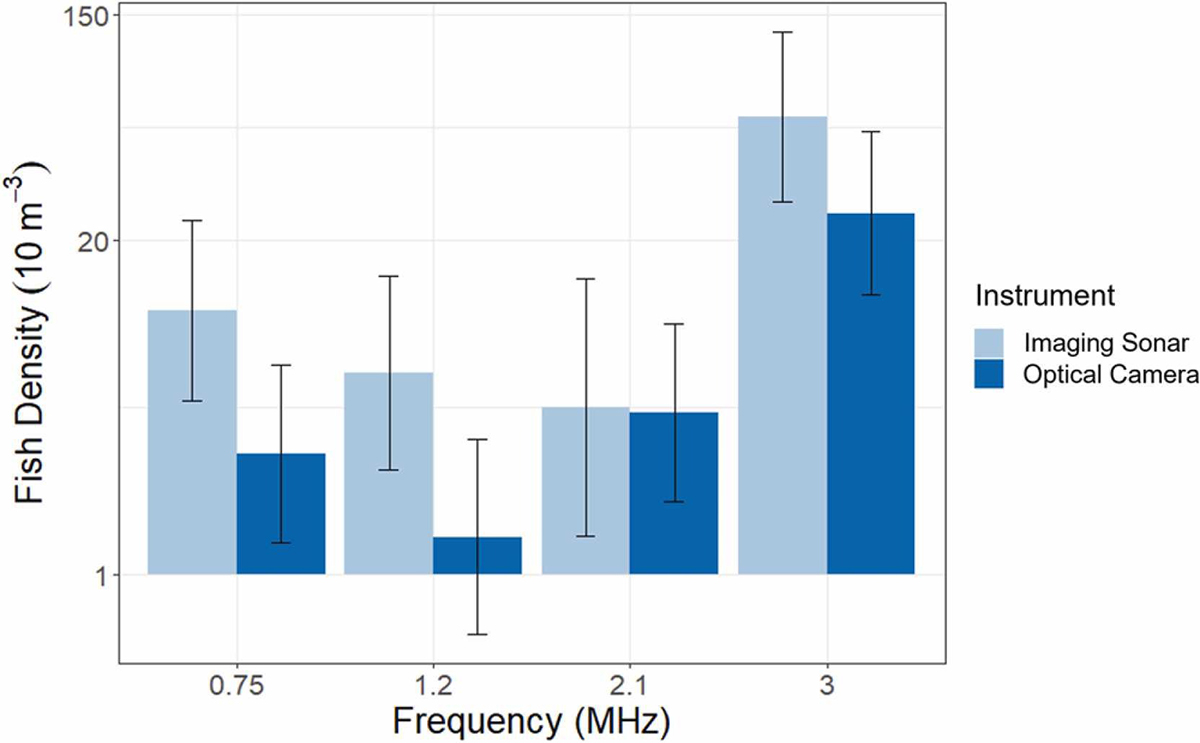
Imaging sonar enumerated higher fish densities than an optical camera at three out of four frequencies tested
Many surveys of the fish biodiversity of tropical and subtropical coastal systems are conducted using optics. Optics assess fishes through visual observation via various platforms, including human-based platforms, such as SCUBA-facilitated underwater visual censuses and remote platforms like camera-mounted Remote Operated Vehicles, (ROVs).
Optics can provide high-resolution detail of fishes, facilitating their identification and characterizing their behavior, distribution and community structure. However, optics are light-dependent, thus are limited in low visibility scenarios (e.g., at depth, at night, or in turbid water). Optics are also typically characterized by the limited range that visible light can penetrate the water and are altogether inhibited by opaque physical barriers, ranging from particulates in the water column to artificial structures. As such, the spatial extent of optics is constrained, which limits optic quantification of sparsely distributed and rare species and fishes in large aggregations. Complementary survey techniques that do not share the limitations of optics are, therefore, needed to provide a more complete assessment of fish communities, particularly in areas of restricted visibility.
Active acoustic devices, collectively known as SONAR, function by propagating an acoustic pulse into the water column and detecting echoes that are reflected back from physical objects such as fishes. These echoes can be graphically displayed and, in many cases, enumerated accurately to provide estimates of abundance, provided the system is calibrated.
This article – summarized from the original publication (Sibley, E.C.P. et al. 2023. Sound sees more: A comparison of imaging sonars and optical cameras for estimating fish densities at artificial reefs. Fisheries Research, Volume 264, August 2023, 106720) – reports on a study with simultaneous imaging sonar and optic surveys of the fish assemblages around two artificial reefs, the Rottnest fish towers, off Perth, Western Australia, to improve our understanding of the performance of imaging sonar and its efficacy as a standalone or complementary tool to enumerate fish assemblages.

Study setup
This study compared quantitative data of fish assemblages obtained using imaging sonars operating at four frequencies (0.75, 1.2, 2.1, and 3 MHz) with simultaneous optical camera footage at two artificial reefs.
The study site was the Rottnest fish towers, two steel artificial reefs situated on the outer continental shelf of Western Australia, 11 km south of Rottnest Island and 27 km west of Perth. The towers were deployed in 2017 to act as fish aggregating devices and bolster commercial fisheries. The towers are 12.5 meters tall, 10 meters long and 7.8 meters wide and are positioned on unconsolidated soft sediment. Fishes were acoustically detected using imaging sonars mounted on an Oceanbotics SRV-8 Remotely Operated Vehicle (ROV), and the optic system consisted of the integrated dual-mode HD camera onboard the ROV.
For detailed information on the study design, instruments and equipment, and data acquisition, processing and analysis, refer to the original publication.
Results and discussion
This study provides one of the first comparisons between imaging sonar and optics in surveying fish assemblages in complex habitats. There was a significant effect of instrument type (imaging sonar or optical camera) on recorded fish densities, with the greatest differences in densities occurring at 0.75, 1.2 and 3 MHz, where sonar density was higher than optic density. This study also reports a significant effect of frequency; fish density was likely much higher at the north tower, where only 3 MHz was used, therefore it was not possible to distinguish the effect of local density versus frequency. However, this did not prevent us from estimating the difference in detection rates between the two instruments at this frequency, which was comparable to that observed at 0.75 and 1.2 MHz.
The higher densities quantified by imaging sonar in this study conform with reports by other researchers of imaging sonar quantifying higher fish densities than optical methods. This study reinforces these findings by providing a comparison between imaging sonar and optics for a more speciose fish assemblage in a deeper habitat, and as such is more broadly appropriate for inferring the relative performance of imaging sonar to quantify fishes in diverse marine ecosystems.
In addition to the general, extensively described drawbacks of acoustics, like limited resolution for species identification, this study has identified several key limitations of imaging sonar that compromise its effectiveness for surveying fishes around complex, hard substrate habitat. These include lack of spectral resolution; limited dynamic range; physical interferences; near-field zone; and others.
Future imaging sonar studies may look to define survey volume commensurate with the radius of the noise-free void and near-field zone. Here, deploying the ROV at further distances from the towers would increase the range of the sonar pulse to the structures, generating a larger noise-free void in which fishes can be quantified, and compensating for the redundant volume of water taken up by the near-field zone in which fishes cannot be fully ensonified (filled with sound). Imaging sonars may ultimately play a key role in remote sensing of marine habitats and assemblages, particularly at lower frequencies of greater range (e.g., 10 m at 0.75, 1.2 and 2.1 MHz in this study).
Researchers: AI video surveys increase efficiency in fisheries assessments
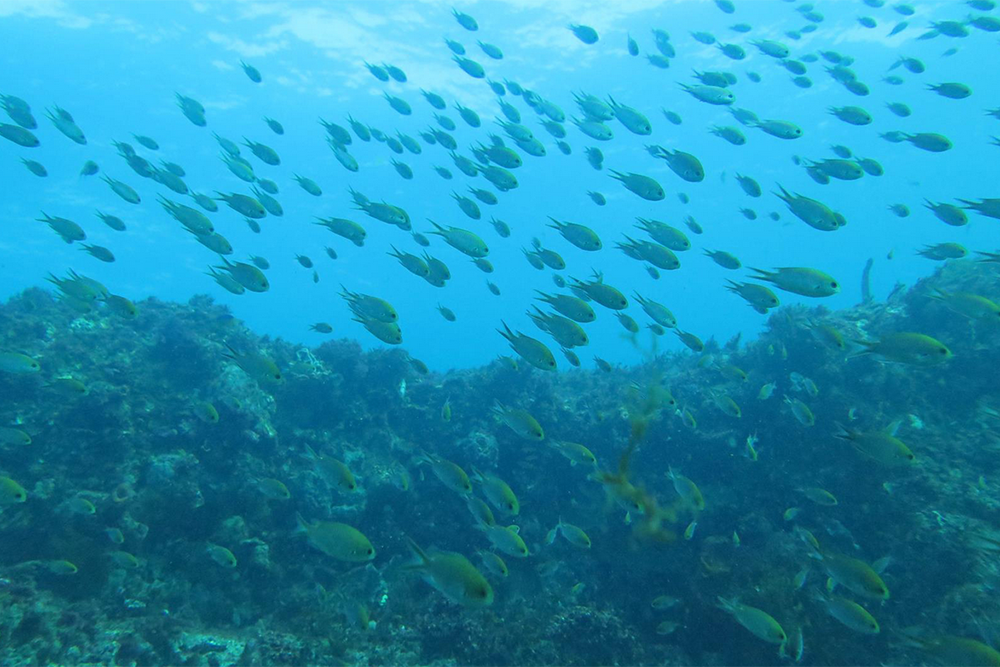
In our study, fish assemblages were dominated by small, site-attached species, most notably West Australian pullers (Chromis westaustralis) and western king wrasse (Coris auricularis) that accounted for between 37–74 percent and 21–59 percent of all fishes observed at each frequency in the optic still frames, respectively. The color of the C. westaustralis typically varies from dark teal to olive green – a spectrum near identical to that of the algal growth that covered most of the lower depth strata of the towers. Subsequently, C. westaustralis in close proximity to the towers were often camouflaged from optic detection by the towers. Similarly, C. auricularis are predominantly bleached white in color. As such, individuals near the sandy seabed were often inconspicuous and therefore were likely underrepresented in optic estimates of fish density.
The variation in fish density observed across imaging sonar frequencies in this study is not considered to be informative. Differences in the wavelengths of all four frequencies are too finite relative to the size of the fishes surveyed to incur variations in fish density. Higher fish density at 3 MHz is instead likely a product of covariance between frequency and the tower surveyed (either north or south). To negate the influence of inter-habitat differences, future studies comparing imaging sonar fish densities across multiple frequencies should survey just one habitat, or apportion sampling effort equally by method (e.g., frequency) among different habitats. At equivalent fish abundance and consistent range, lower densities may be expected at higher frequencies.
The fish densities quantified by both imaging sonar and the optical camera may have been adversely influenced on occasions where the ROV was not fully horizontal. Future studies should be aware of potential variations in fish densities resulting from inconsistent ROV orientation.
Future comparisons between imaging sonar and optics may look to employ a stereo-video complex for comparison of length estimates from both instruments, which was not possible with the single camera system used here. Stereo-video systems would also provide information on the position of fishes in the water column; imaging sonar compresses the detection of objects in 3-D space into two dimensions for display. The impact of this compression is here considered negligible given that imaging sonar did not quantify lower fish densities than optics, suggesting that there were few or no fishes in the same vertical plane that would otherwise obstruct one another on the imaging sonar display.
However, if an arrangement of fishes in 3-D space is desirable, or if the target assemblage is very dense (e.g., schooling fishes) such that obstruction of fishes in a two-dimensional display is likely, this study suggests also implementing a calibrated, multi-camera optical instrument to determine the orientation of fishes detected by imaging sonar. Alternatively, rotating the imaging sonar could ensonify fishes in the vertical dimension, while 3-D modeling and reconstruction of imaging sonar footage is also possible.
Perspectives
Results of this study indicate that imaging sonar enumerated higher fish densities than an optical camera at three out of four frequencies tested (0.75, 1.2 and 3 MHz). This finding encourages the deployment of imaging sonars for surveying the fish assemblages of other complex hard substrate habitats, including other artificial habitats like rigs-to-reefs and biogenic reefs. Most notably, imaging sonar outperformed optics in the detection of small, camouflaged, site-attached fishes that dominated the assemblages surveyed in this study.
Further use of imaging sonar to enumerate size-diverse and speciose assemblages across different habitats, particularly in comparison with simultaneous optical methods, will provide a valuable indication of the wider potential of sonars in fish surveys. Crucially, this study also identified several limitations of imaging sonar in addition to the broader constraints of acoustic instruments that may constrain the use of sonar for future investigations, many of which can be remedied by the simultaneous use of optics.
The capacity of imaging sonar to enumerate higher fish densities than optics consolidates both its broader application in marine life assessments, particularly as a complementary tool to optics, as well as its use as a substitute for optics in instances of low light.
Now that you've reached the end of the article ...
… please consider supporting GSA’s mission to advance responsible seafood practices through education, advocacy and third-party assurances. The Advocate aims to document the evolution of responsible seafood practices and share the expansive knowledge of our vast network of contributors.
By becoming a Global Seafood Alliance member, you’re ensuring that all of the pre-competitive work we do through member benefits, resources and events can continue. Individual membership costs just $50 a year.
Not a GSA member? Join us.
Author
-

Corresponding author
School of Biological Sciences, University of Aberdeen
Aberdeen, Aberdeenshire, United Kingdom
Related Posts
Innovation & Investment
Minnowtech live-stream launches its sonar-AI shrimp biomass estimator
U.S. aquaculture technology company Minnowtech launched its highly anticipated sonar-based and AI-supported shrimp biomass estimator.
Fisheries
From reporting apps to floating traps: How technology tackles ghost fishing
The global ghost fishing problem has negative environmental and economic impacts, but new technology could help locate and retrieve lost fishing gear.

Innovation & Investment
Eight digital technologies disrupting aquaculture
Eight digital technologies are disrupting aquaculture and having a profound impact on the way business operates – even displacing some established ones.
Fisheries
Fisheries in Focus: What is the Fisheries Management Index and what does it say about U.S. fisheries?
To properly evaluate a fishery management system, we need a measure of the management regime as a whole: Enter the Fisheries Management Index (FMI).