Modeling future carbon emissions from global mangrove forest loss
Results show regions in need of policy actions to address emissions arising from mangrove loss, and the management drivers
The capacity of mangroves to store carbon and mitigate greenhouse gas emissions became a prominent topic a decade ago. Since then, mangroves have gained international interest for their potential to contribute to carbon mitigation strategies and for their ecosystem services that support adaptation to climate change.
Hundreds of site-scale studies have been conducted to understand the distribution and accumulation of mangrove soil carbon and aboveground biomass. These site-scale measurements have supported globally comprehensive spatial models of carbon storage. Simultaneously, global efforts to accurately map and monitor mangrove cover and health have provided unprecedented knowledge on the risks that mangrove forests face. These studies have enabled global-scale estimation of mangrove carbon storage and its historical loss across different nations and globally.
Management actions, such as avoiding deforestation or restoring hydrological connectivity, can reduce carbon dioxide (CO2) emissions from mangrove loss and enhance the sequestration potential of disturbed forests. But management actions should be guided by predictions of future emissions, not just carbon storage. Management effectiveness relies on understanding the level of emissions that can be avoided by specific actions, for instance, by reducing land conversion or increasing restoration efforts. Predictions of CO2 emissions from mangrove loss linked with specific land-use changes can underpin the selection of actions to support adequate mangrove management actions for specific loss drivers.
Recent advances in mapping mangrove areas, rates of loss, carbon storage and emission factors now enable predictions of CO2 emissions at the global scale. These predictions should overcome several critical limitations of past studies. Global estimates have treated all CO2 emissions from mangroves as occurring in the year of loss (Atwood et al., 2017). Depending on the type of land-use change and the carbon pool affected, it can take years or even decades for the carbon stored in mangroves to be emitted into the atmosphere and exported through tidal exchange.
![Ad for [Aquademia]](https://www.globalseafood.org/wp-content/uploads/2025/07/aquademia_web2025_1050x125.gif)
This article – adapted and summarized from the original publication (Adame, M.F. et al. 2021. Future carbon emissions from global mangrove forest loss. Global Change Biol. 27(1): 2856-2866) – presents the results of a study that developed a spatial model that projects emissions caused by mangrove loss, with the goal to overcome current limitations in global estimations.
Study setup
Our model synthesized information from multiple newly available global datasets, including carbon stocks, mangrove distribution, deforestation rates, drivers of land-use change and emission factors. We provide predictions of future CO2 emissions from mangrove loss, accounting for the effect of proximate drivers of land-use change, including: (a) conversion to commodities, such as agriculture or aquaculture; (b) coastal erosion; (c) clearing; (d) extreme climatic events; and (e) conversion to human settlements. Importantly, we account for the foregone opportunity of soil carbon sequestration when mangroves are lost.
Quantifying greenhouse gas emissions from global aquaculture
Our modeled emissions reflect the realistic temporal scale of emissions – not annual, but decadal. Although predictions may vary due to possible changes in future deforestation rates, we provide the business as usual (BAU) scenario to assess current management practices. For instance, the Global Mangrove Alliance’s commitment to restoring 20 percent of mangrove cover and reduce emissions from their loss. By linking emissions with specific drivers of land-use change and accounting for future removals, we present for the first time, spatially explicit information on how different drivers of mangrove loss are causing CO2 emissions. We identify and discuss potential options to reduce these emissions and the management actions that could prevent them.
For detailed information on the study design, sources of data, models and sensitivity analyses, refer to the original publication.
Results and discussion
Under a business as usual (BAU) scenario, global emissions from mangrove loss could reach 2,391 Teragrams, Tg [one million metric tons per Tg) of CO2 by the end of the century (2010–2100), or 3,392 Tg of CO2 if considering the lost opportunity for soil carbon sequestration. Previous estimates of mangrove emissions for the same period vary enormously, between 630 and 40,230 Tg CO2. Our projection lies towards the lower end of this range, and we consider it more accurate because of the inclusion of land-use drivers, time lags and foregone future sequestration that were not considered in previous studies.
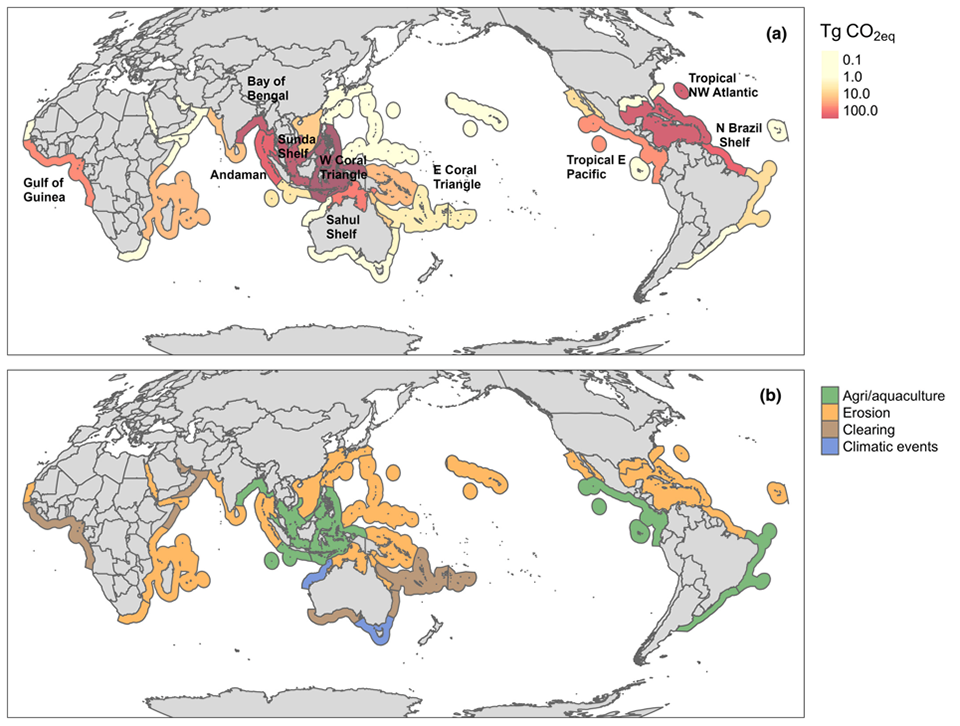
We identified six provinces that accounted for 90 percent of the projected emissions. The top emitters were the West Coral Triangle, Sunda Shelf and the Bay of Bengal, primarily due to agriculture/aquaculture conversion. These regions have been previously highlighted as a global hotspot of mangrove CO2 emissions. Within these provinces, clearing of large areas of carbon-rich mangroves has occurred for rice, oil palm, aquaculture and rubber plantations.
In Indonesia, the conversion of mangroves to aquaculture contributed almost 15 percent of their national emissions. In Myanmar, deforestation of mangroves has been driven by national policies that support the intensification of rice production to increase food security. Our predictions suggest that emissions from these regions will be the highest globally by the end of the century due to the intensity of land-use changes and large mangrove carbon stocks. These emissions can be managed through changes in agricultural practices, and the restoration of formerly converted mangrove areas, such as disused aquaculture ponds and on land where saltwater has intruded (Fig. 3a).
Erosion was an important driver of mangrove loss and was responsible for significant carbon emissions, particularly within the West Coral Triangle, Sunda Shelf, Bay of Bengal and Andaman provinces. In the Sundarbans, changes in river flows have reduced sediment inputs, which caused the loss of over 7500 ha of coastline in the last 37 years. In areas prone to high erosion rates, decreasing emissions would need to be achieved through shore stabilization and the management of rivers and dams to provide sediment inputs that support the maintenance of surface elevation and habitat area for mangroves. Landward migration of mangroves, if coastal squeeze is avoided, may also balance some losses in provinces with high levels of erosion.
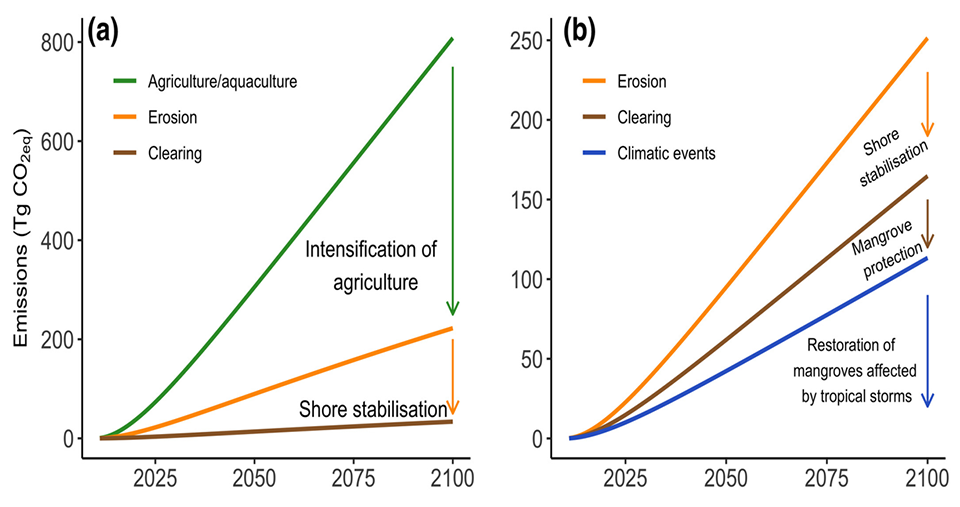
The second global hotspot for mangrove CO2 emissions was the Tropical Northwest Atlantic province, driven primarily by erosion, clearing and extreme climatic events. In the Mexican Caribbean, changes in hydrological connectivity that affect groundwater are a significant cause of unintended clearing of mangroves rich in carbon. The Tropical Northwest Atlantic is also one of the regions with the highest frequency of tropical storms in the world, which can cause large-scale mangrove mortality. Management activities to decrease CO2 emissions in the Tropical Northwest Atlantic could include coastal stabilization, reduction of illegal deforestation and improvement of hydrological connectivity, especially in sites that fail to recover after tropical storms. These activities combined could reduce the projected carbon emissions by 94 percent for this region (Fig. 3b).
Finally, provinces considered smaller hotspots, with an intermediate mangrove area and moderate carbon stocks, were North Brazil Shelf, Sahul Shelf and Gulf of Guinea. In Brazil, vegetation clearing, changes in hydrology and coastal development have increased erosion, leading to mangrove loss. Across the Sahul Shelf, northern Australia, the loss of mangroves from 2015 to 2016 was associated with an extreme El Niño event that caused fluctuating sea levels, drought and high temperatures. In Senegal, in the Gulf of Guinea, drought and hydrological changes caused the loss of large areas of mangroves and consequent large CO2 emissions. In these regions, coastal stabilization, hydrological reconnection and restoration could help reduce potential future emissions.
The sensitivity analysis demonstrated that the spatial distribution of our projected CO2 emissions hotspots is robust to different datasets of mangrove area, carbon stocks, emission factors and deforestation rates (Fig. 4).
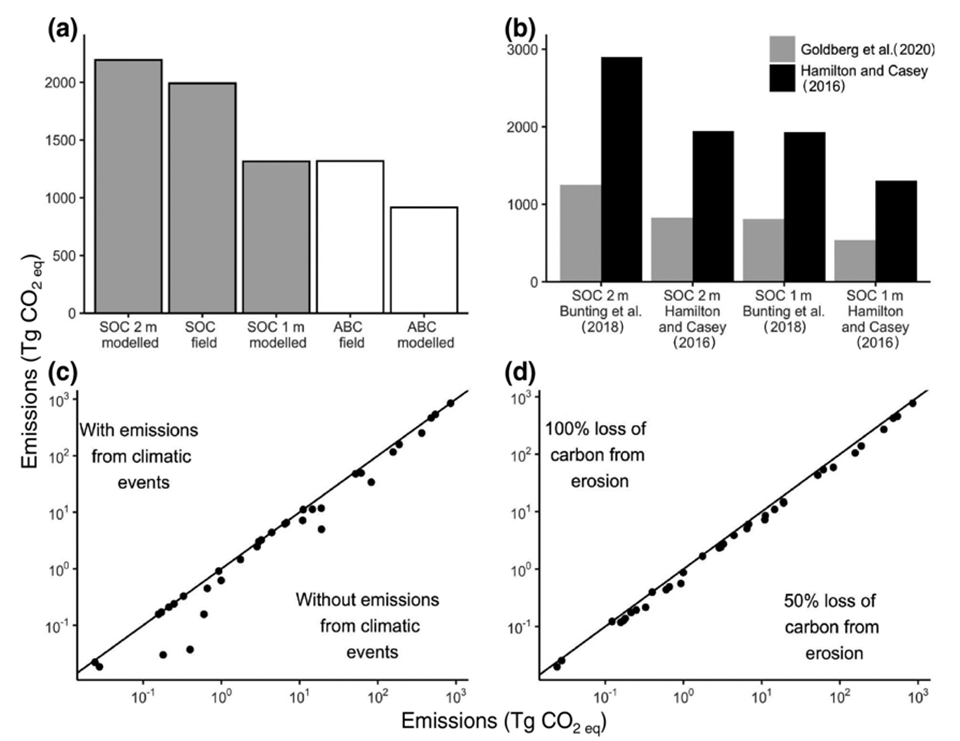
The sensitivity analysis indicated the model was most sensitive to deforestation rates, with emissions increasing linearly as the deforestation rate increased Changes in the magnitude of drivers of mangrove loss are likely to occur in the future, implying that our assumption of linearity in predictions may not happen. For example, unused agricultural land may transition to mangroves and then to urban settlements. Also, mangrove loss may accelerate because of increased frequency of extreme climatic events, but sea-level rise could compensate for some of the losses.
Future studies should incorporate scenarios where mangrove area increases due to landward or poleward migration as sea-level rises and winter freezes become less common. Importantly, a research priority is developing future mangrove loss scenarios that consider not only climatic but also social and economic drivers of mangrove loss.
Changes in mangrove area and drivers of loss also occur at different spatial scales, and in many cases, national or local datasets would be more appropriate to address management issues. Ideally, global, national and regional models would be compatible in the future when higher-resolution global models of landscape change become available. However, our model can be downscaled to account for regional differences in mangrove carbon storage, such as those caused by differences in species composition, forest structure or geomorphological setting.
A future research need is to compare local studies to global-scale studies to assess the accuracy of large-scale predictions. The models should also be updated with new global datasets as they become available. A strength of our model is that it integrates multiple “big” datasets, which are increasingly being developed to support mangrove conservation.
Perspectives
In our study, we identified hotspots of CO2 emissions due to mangrove loss associated with various drivers of loss. If these losses continue in the same trajectory, we predict emissions arising from mangrove loss will be concentrated in six provinces of the world: West Coral Triangle, Sunda Shelf, Bay of Bengal, Tropical Northwest Atlantic, Andaman and North Brazil Shelf. These regions have large areas of mangroves (>500,000 ha), relatively high rates of loss (≥0.1 percent annually) and most have high carbon densities (≥500 Mg C/ha).
By accounting for specific mangrove loss drivers and the foregone carbon sequestration potential, we updated global estimates and provide specific management actions to minimize future emissions efficiently. For instance, activities that improve agricultural practices to reduce further expansion into mangrove areas and efforts to stabilize coastlines and restore former mangrove areas should be prioritized to decrease emissions from mangrove loss by the end of the century.
Now that you've reached the end of the article ...
… please consider supporting GSA’s mission to advance responsible seafood practices through education, advocacy and third-party assurances. The Advocate aims to document the evolution of responsible seafood practices and share the expansive knowledge of our vast network of contributors.
By becoming a Global Seafood Alliance member, you’re ensuring that all of the pre-competitive work we do through member benefits, resources and events can continue. Individual membership costs just $50 a year.
Not a GSA member? Join us.
Author
-

Corresponding author
Australian Rivers Institute, Griffith University, Nathan, Qld, Australia; and
Coastal and Marine Research Centre, Australian Rivers Institute, School of Environment and Science, Griffith University, Gold Coast, Qld, Australia
Editor’s note: The original article has 16 co-authors.
Related Posts

Innovation & Investment
20 years of the Global Aquaculture Alliance
A timeline of key milestones and achievements by the Global Aquaculture Alliance and its third-party aquaculture certification scheme, Best Aquaculture Practices (BAP).
Intelligence
Europeans need a new shrimp narrative
Media coverage fuels negative perceptions of farmed shrimp among Europeans. A paper – similar to one on pangasius consumption four years ago – finds the sector is doing too little to rectify ill-founded notions.
Responsibility
Prawn farming in Bangladesh faces climate change threats
The inadequate supply of postlarvae is a bottleneck for prawn production in Bangladesh. A shortage of wild broodstock to supply the hatcheries is an ongoing concern.
Responsibility
Greenhouse gas emissions from aquaculture
To quantify the carbon dioxide and methane fluxes in tropical earthen ponds, the authors used freshwater prawn farming managed according to different strategies as a model.