Global finfish production review and forecast: Nearly doubled in a decade
Released at GOAL 2018, annual survey data forecasts level production in 2019
This is a summary of some of the findings from the Global Aquaculture Alliance’s (GAA) 2018 survey on selected finfish species. Our presentation of the production estimates was presented at the recent GOAL 2018 conference in Guayaquil, Ecuador.
(Editor’s note: GAA members have access to both the Global Shrimp and the Global Finfish Production Review and Forecast slides, presented at GOAL. Annual memberships are available for as little as $50. Click here for more information.)
The estimates are based on a global survey of many contributors undertaken by GAA and additional estimates from Kontali Analyse AS. Production figures until 2016 are significantly based on the Fisheries and Agriculture Organization of the United Nations (FAO) Fishstat database. The Norwegian Seafood Council and the U.S. National Marine Fisheries Service (NMFS) has provided data on prices for several species. Table 1 provides a summary of production volumes for the selected finfish species we cover in our annual survey, and individual species and trends are discussed in this article.
Tveteras, GOAL 2018 Finfish survey, Table 1
| Species, region | 2016 | 2017 | 2018 | 2019 | 2016-17 (%) | 2017-18 (%) | 2018-19 (%) | Average 2009-2018 (%) |
|---|---|---|---|---|---|---|---|---|
| Atlantic salmon | 2,166 | 2,290 | 2,420 | 2,547 | 5.7 | 5.7 | 5.2 | 5.2 |
| Coho salmon | 147 | 141 | 183 | 178 | -3.8 | 29.7 | -2.8 | 4.5 |
| Large rainbow trout | 280 | 261 | 262 | 283 | -6.6 | 0.5 | 8.0 | -2.2 |
| Small trout | 571 | 571 | 590 | 600 | 0.0 | 3.3 | 1.8 | 4.2 |
| Milkfish, selected countries | 1,183 | 1,120 | 1,264 | 1,317 | 1.8 | 4.9 | 4.2 | 6.5 |
| Barramundi, selected countries | 61 | 85 | 84 | 89 | 39.1 | -0.9 | 6.8 | 8.2 |
| Carps, China | 20,389 | 20,182 | 22,160 | 23,258 | -1.0 | 9.8 | 5.0 | 5.1 |
| Tilapia | 5,899 | 6,048 | 6,275 | 6,491 | 2.5 | 3.7 | 3.5 | 8.4 |
| Catfishes, selected countries | 2,442 | 2,707 | 2,995 | 3,417 | 10.8 | 10.6 | 14.1 | 12.9 |
| Pangasius, Vietnam | 1,195 | 1,121 | 1,270 | 1,311 | 1.3 | 5.0 | 3.2 | 0.4 |
| Sea bass/Sea bream, Mediterranean | 360 | 403 | 419 | 412 | 12.0 | 4.0 | -1.7 | 3.8 |
| Bluefin tuna | 49 | 56 | 63 | 72 | 14.0 | 11.8 | 14.6 | 7.3 |
| Cobia, selected countries | 43 | 44 | 45 | 46 | 2.7 | 2.6 | 2.4 | 6.5 |
| Corvina, Mediterranean | 24 | 25 | 26 | 25 | 4.2 | 5.0 | -4.0 | 35.9 |
![Ad for [BSP]](https://www.globalseafood.org/wp-content/uploads/2025/07/BSP_B2B_2025_1050x125.jpg)
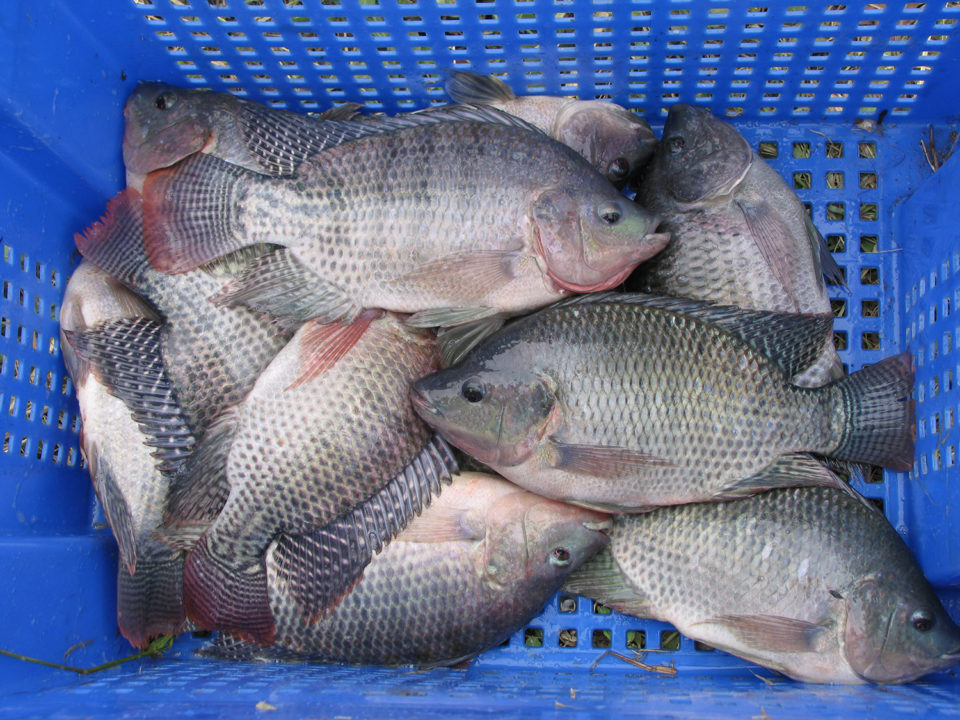
Tilapia
Tilapia has continued to increase production recently, as shown in Fig. 1. It is expected to produce 6.3 million metric tons (MT) in 2018, a 4 percent growth from 2017. Next year it is expected to grow by around 4 percent to 6.5 million MT. This is still significantly lower than the average growth rate over the 10-year period from 2009 to 2018 period, which has been 8.4 percent.
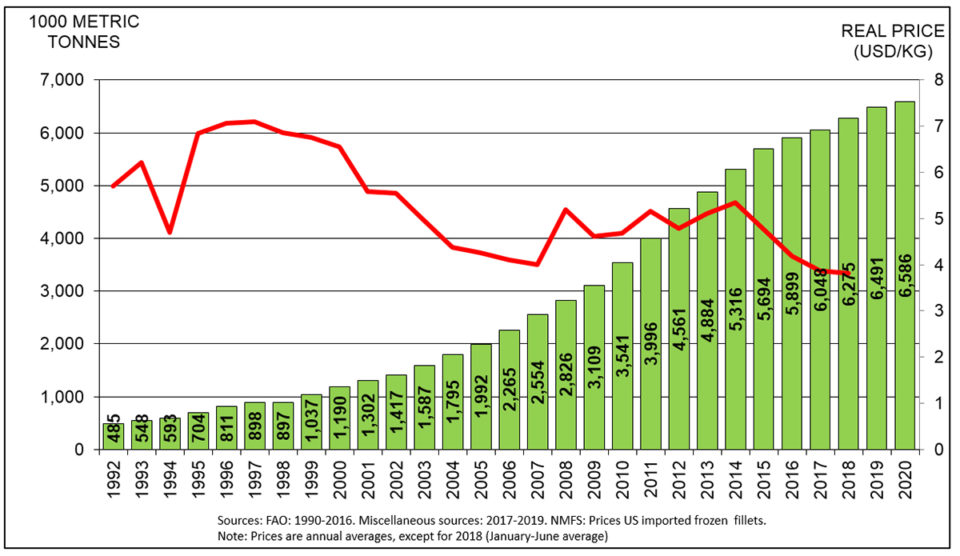
When we look at a representative price – the U.S. import price for frozen fillets – we see that real prices have fluctuated at levels around $4 to $5 per kg since 2008, but with a downward trend since 2014. It decreased last year to $3.9 per kg and has on average been $3.8 per kg during the first half of this year.
China is the leading tilapia global producer, followed by Egypt and Indonesia. This year, the average estimate from our sources is 1.7 million MT for China, around 900,000 MT for Egypt and 830,000 MT for Indonesia. For China, production is expected to be at the same level next year, while for Egypt and Indonesia production is expected to increase.
There are large discrepancies in production estimates for China from various individual sources. For 2018, the range is between 1.2 and 2.2 million MT with an average of 1.7 million MT. In 2019, the range is between 1.1 and 2.3 million MT, with an average of 1.8 million MT.
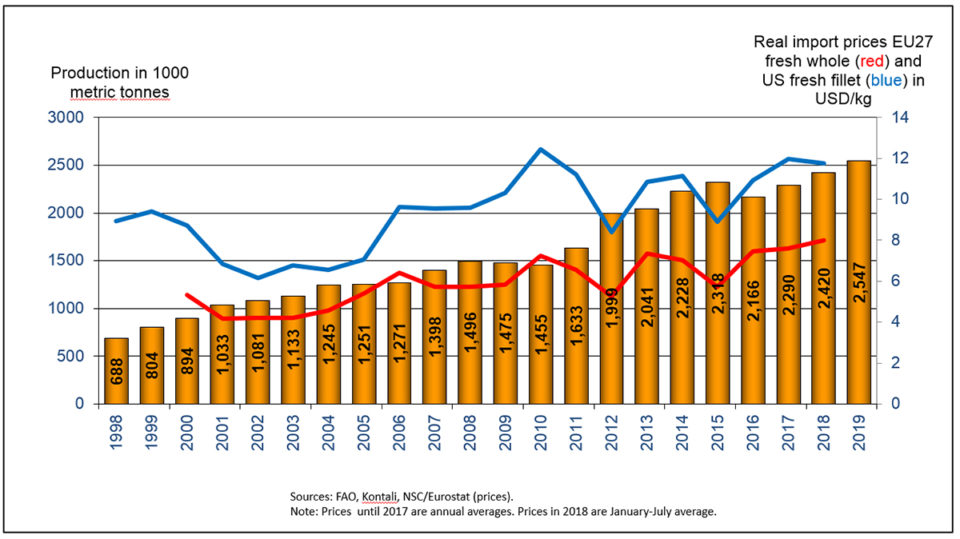
Pangasius
Pangasius is not only a species with a broad market base globally, but its farmed production is also continuing to diversify geographically, as shown in Fig. 2. Vietnam represents around 50 percent of global production among the countries reported here.
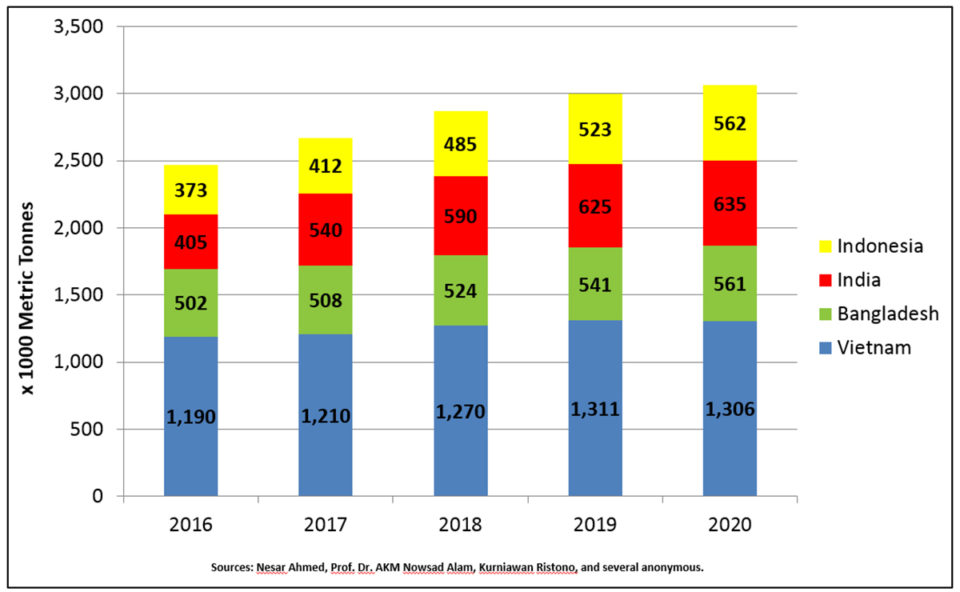
The total production from those countries reporting is around 2.9 million MT in 2018, an 8 percent increase from 2.7 million MT in 2017. Production is forecasted to go up by 5 percent in 2019 to 3 million MT.
Vietnam is estimated to experience a 5 percent increase in production from 2017 to 2018, from 1.21 to 1.27 million MT. Production is expected to increase slightly in 2019, to 1.3 million MT. For pangasius, the range of estimates from different sources is from 1.2 to 1.4 million MT in 2018.
U.S. and EU import prices have been declining since 2007 but have moved upwards recently. In the first half of this year, frozen fillet prices have on average been around $4 per kg in the United States and around $2.8 per kg in the EU.
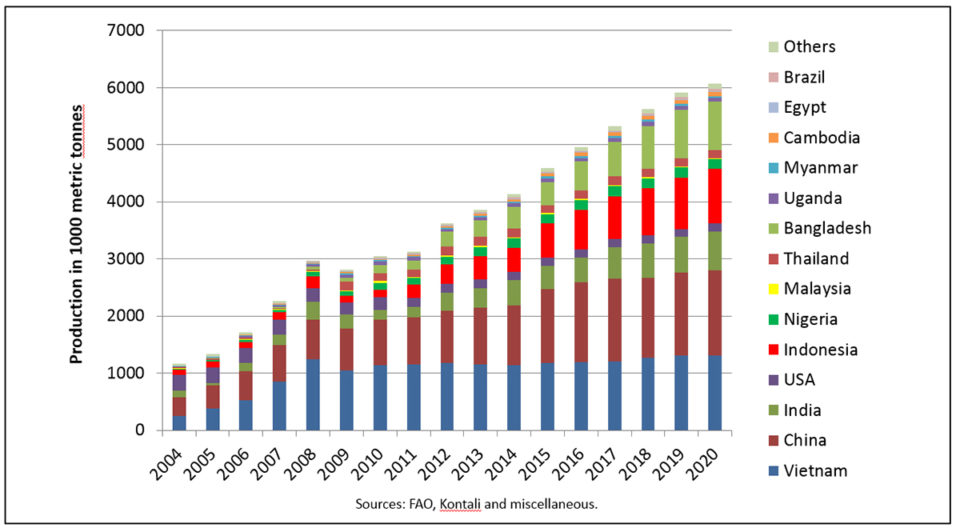
Catfish
China, Vietnam, Indonesia, Bangladesh and India are the largest producers of catfish, in that order. As shown in Fig. 3, total production in those countries we cover has reached levels of 5.6 million MT in 2018, 6 percent higher than the previous year. Production is expected to increase by 5 percent to around 5.9 million MT next year.
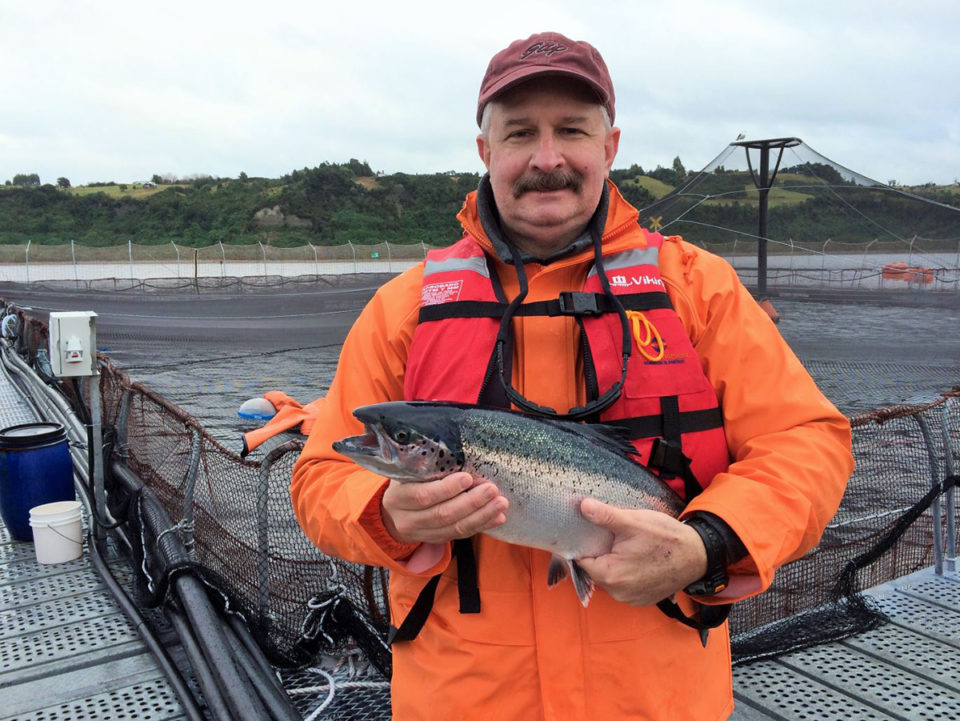
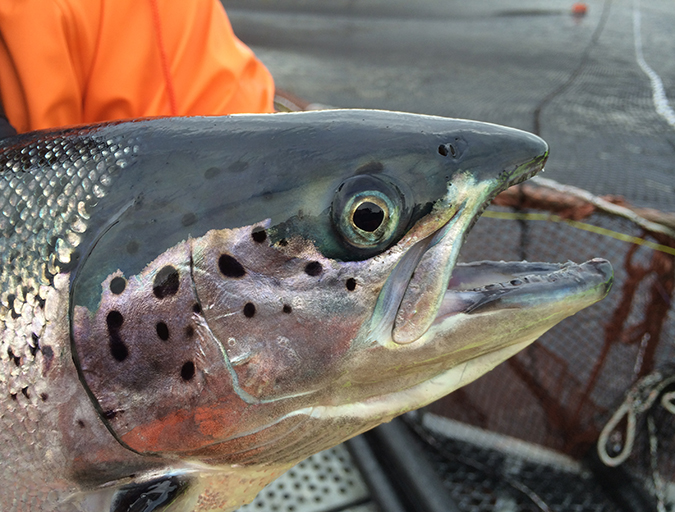
Salmonids
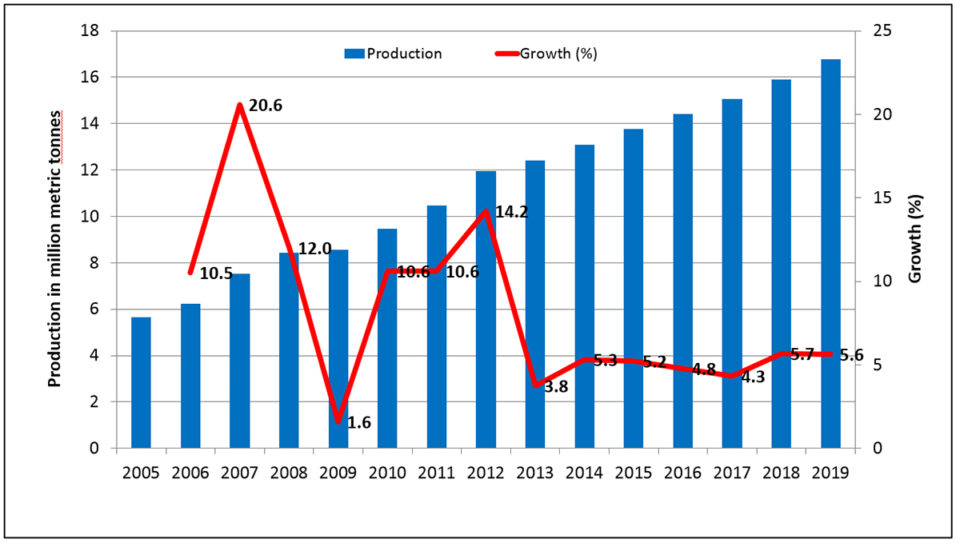
Atlantic salmon is expected to reach a production of 2.4 million MT this year, as shown in Fig. 4, up by 6 percent from 2017. Prices remain at high levels, $12 per kg for fresh fillets into the United States and around $8 per kg for whole gutted salmon into the EU. Next year, production is expected to increase by 5 percent to 2.5 million MT.
The main producer, Norway, is estimated to have a production of 1.3 million MT in 2018, 7 percent higher than last year. Chile has experienced a 14 percent increase, from 564,000 MT in 2017 to an estimated 641,000 MT this year. Norway is predicted to increase its production by 5 percent in 2019 to 1.35 million MT, while Chile is expected to increase by 3 percent to 660,000 MT.
Since 2000, production of coho salmon has experienced considerable volatility, fluctuating between 100,000 and 180,000 MT, but it seems to stabilize at higher levels now. Coho production increased this year to 183,000 MT. Next year, it is expected to be roughly the same level. The increase in production this year is accompanied by a fall in the import price of fresh farmed product, at $5.3 per kg in the first half of 2018. Chile, by far the dominant coho producer, is driving the ups and downs of production.
Production of large rainbow trout in marine waters is expected to be around 260,000 MT this year, about the same as 2017, but well below the peak 2012 levels. We observed high prices last year and the first half of this year. Chile is the main driver of the volatility in production of large rainbow trout.
The production of smaller trout, primarily farmed in freshwater, is still on an upward trend. Production is increasing by 3 percent to around 590,000 MT this year. In 2019, production is expected to increase further, by 2 percent to 600,000 MT. Many countries are involved in small trout production, but the neighboring countries of Iran and Turkey continue to account for almost 50 percent of global production of smaller trout.
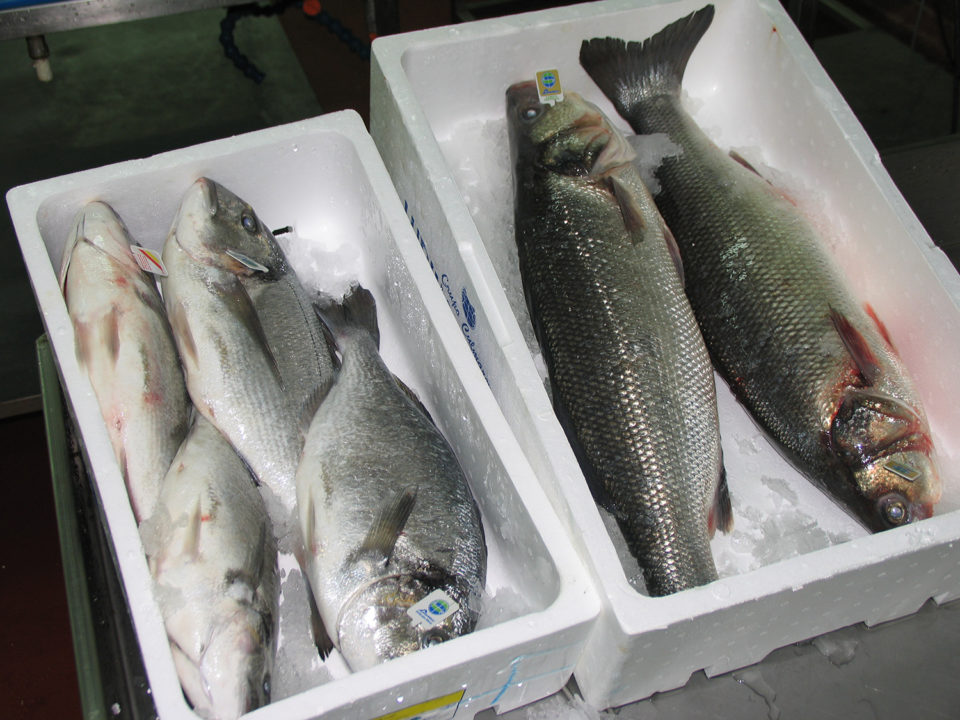
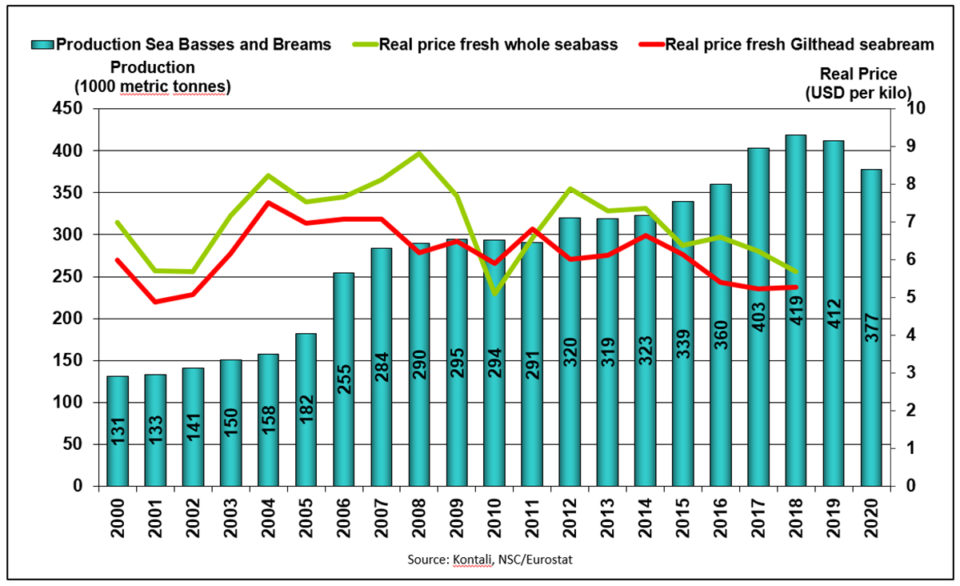
Sea bass and sea bream
Sea bass and sea bream production in the Mediterranean is estimated to increase this year by 4 percent to around 420,000 MT, as shown in Fig. 5. Next year, production is expected to decline by 2 percent. Prices have declined since 2012. In the first half of this year, prices have been between $5 and $6 per kg.
Other species
Below we briefly outline major developments for other species covered in our survey, with production figures provided in Table 1.
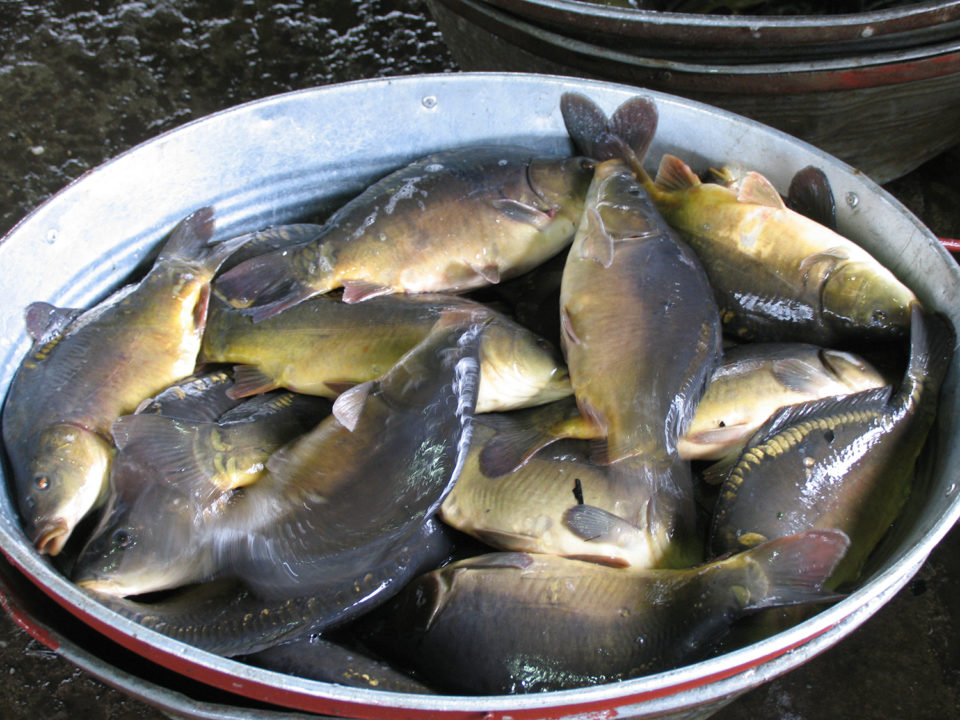
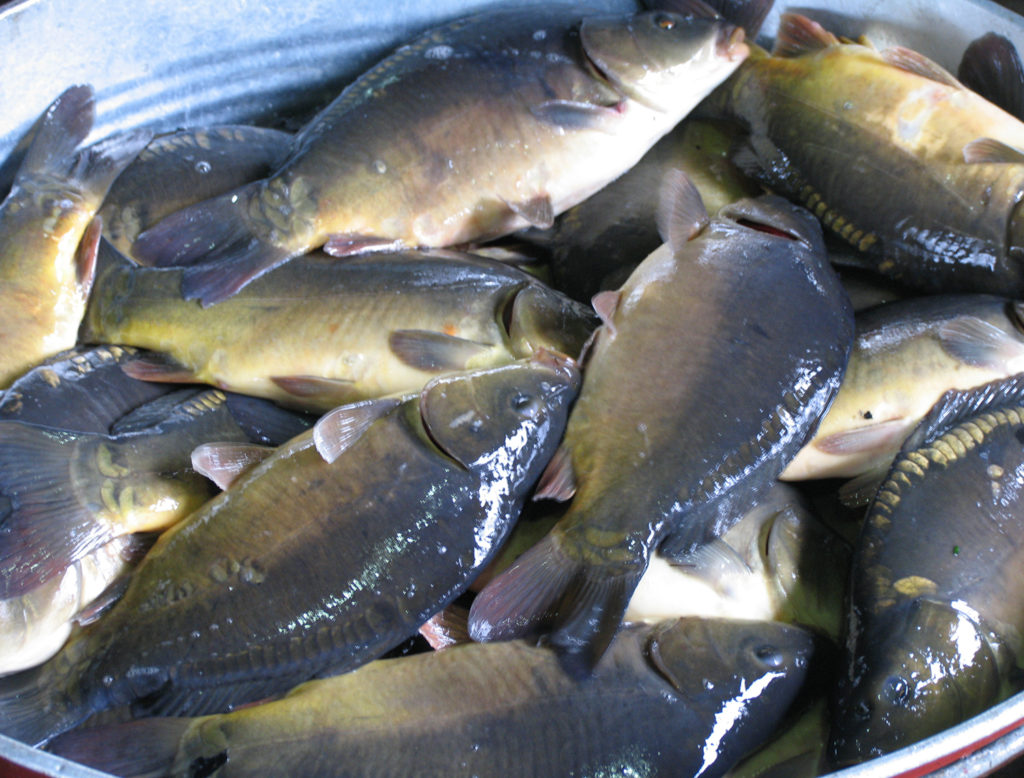
Carps are primarily produced for domestic markets. China is by far the dominant producer globally, with around 75 percent of production in 2018 among those carp species and countries covered by our survey. This year production is expected to increase by 10 percent to 22 million MT.
The total, estimated, global production of the carp sectors included in our survey is around 29 million MT in 2018, up by around 8 percent from the previous year. Next year, production is expected to increase by 4 percent to around 30 million MT.
Barramundi production for the countries covered here is estimated at 84,000 MT in 2018, more or less the same as the previous year. Next year the forecast is for an increase of 7 percent to around 90,000 MT.
Milkfish production for the countries covered here is estimated at 1.3 million MT in 2018, up by 5 percent from the previous year. Next year the prediction is a further 4 percent increase.
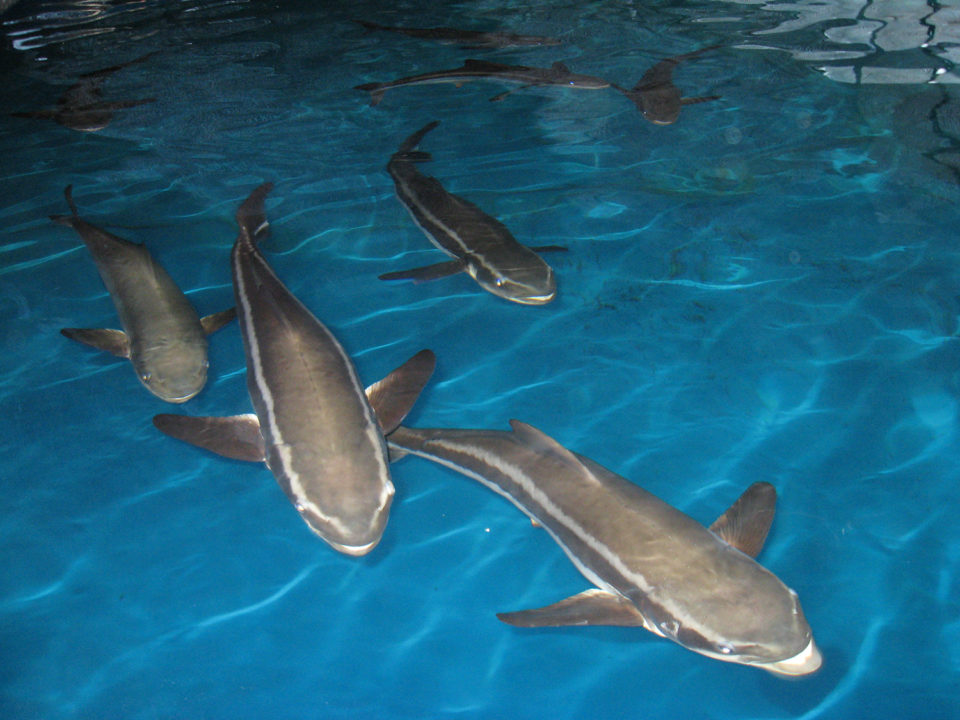
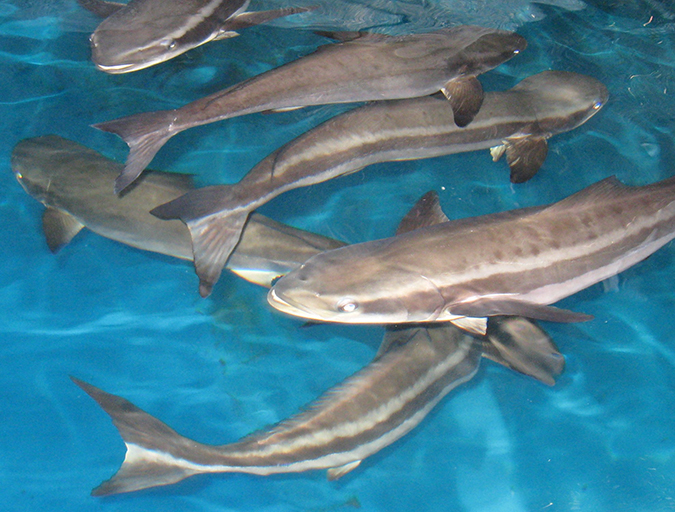
Cobia production for the countries covered here – China, Taiwan, Panama and Vietnam – is estimated to be 45,000 MT this year, a decline of 3 percent from last year. In 2019, farmed cobia production is expected to increase slightly, by 2 percent. Data show that since 2010, production in these countries has fluctuated at levels around 40,000 to 50,000 MT.
Production of bluefin tuna is expected to reach 63,000 MT this year, up 12 percent from 2017. Next year production is expected to grow further by 15 percent to 72,000 MT.
Total production including carps
The total production of species and countries covered by our surveys are shown in Fig. 6. In 2016, our surveyed sectors covered 35 millionMT of the 54 million MT globally produced, per FAO. Production has more than doubled from 17 million MT in 2005 to an expected level of 38 million MT in 2018.
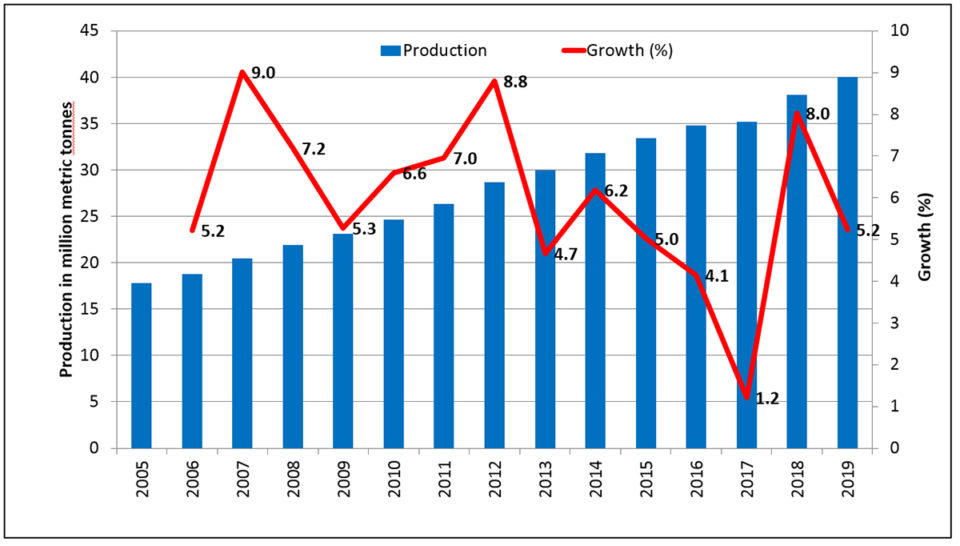
Growth rates are on the positive side. In 2016, growth was 4.1 percent, then declined to 1.2 percent in 2017, is estimated at a healthy 8 percent in 2018 and expected to be 5 percent in 2018.
Total production excluding carps
When carps are excluded, in 2016 our survey of the remaining fish species covered 14 million MT of the 54 million MT produced globally, as shown in Fig. 7. Production of the surveyed species has increased from 5.6 million MT in 2005 to 16 million MT in 2018. Since 2013, growth rates have been in the range of 4 to 6 percent, and in 2018 it is expected to be 6 percent, with a similar growth rate next year.
Double in a decade?
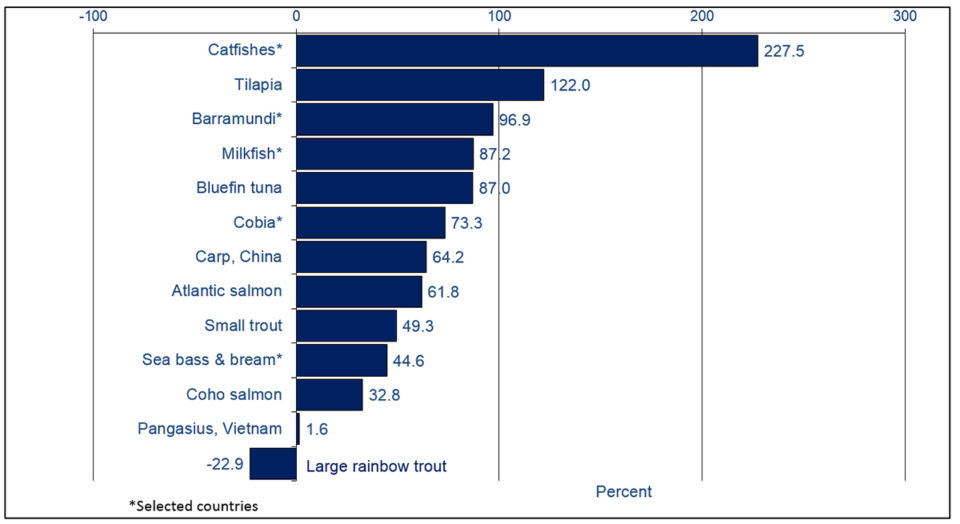
Finally, we ask if the species covered by our survey did double in a decade. Fig. 8 presents species sorted by their percentage growth from 2008 to 2018. We see that catfishes and tilapia more than doubled their production. The remaining species from turbot and downwards have growth rates below 100 percent. In other words, they have not been able to double production. But still many of these sectors have had very decent growth rates compared with other food producing sectors, and other sectors of the economy in general.
When we examine the species groups total we find a mixed picture, as shown in Fig. 9. Marine species had a growth of 57 percent from 2008 to 2018. Diadromous species were just slightly lower at 56 percent. Freshwater species increased by 111 percent when we exclude carps. If we include carps in freshwater sectors increased production by 77 percent.
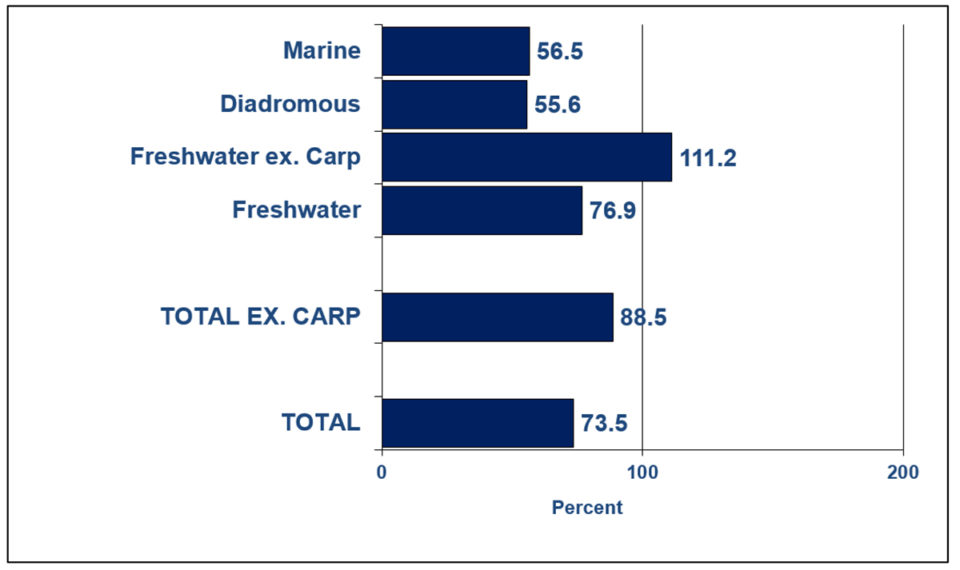
The total growth rate when we include carps is at 74 percent. When we exclude carps we see a more impressive total development, with a growth of 89 percent. So over the last 10 years our sectors have been able to maintain a fairly impressive overall growth.
Now that you've reached the end of the article ...
… please consider supporting GSA’s mission to advance responsible seafood practices through education, advocacy and third-party assurances. The Advocate aims to document the evolution of responsible seafood practices and share the expansive knowledge of our vast network of contributors.
By becoming a Global Seafood Alliance member, you’re ensuring that all of the pre-competitive work we do through member benefits, resources and events can continue. Individual membership costs just $50 a year.
Not a GSA member? Join us.
Authors
-

The University of Stavanger
4036 Stavanger, Norway -

Kontali Analyse AS
Industriveien 18, NO-6517 Kristiansund, Norway -

Editor Emeritus
Global Aquaculture Alliance
Related Posts
Intelligence
Global Farmed Finfish Production Outlook: Slower-paced growth
The GOAL 2016 survey for global production of farmed fish shows that most major finfish groups increased their farmed production in 2015. The total production of species and countries covered by the survey is forecasted to reach 42 MMT in 2016.
Intelligence
Changes in European consumer perceptions of farmed salmon
Household surveys have been carried out annually since 2012 in France, Germany and the UK on perceptions and consumption patterns for salmon and meat from agriculture. Results show that salmon is generally perceived as having more beneficial effects than chicken on brain development, bone development, certain cancer risks and coronary heart disease risk.
Intelligence
GOAL 2017: Global finfish production review and forecast
Global farmed fish production has increased from 19 million metric tons (MMT) in 2004 to an expected level of 44 MMT in 2017. Next year’s production is expected to be 46 MMT.
Intelligence
‘Spatiotemporal patterns’ indicate improving perceptions of aquaculture
A study led by University of California Santa Barbara researchers has found that public sentiment toward aquaculture improves over time, a potentially important development with growing interest in offshore aquaculture.