Effects of sand, sediment, vertical surfaces on intensive shrimp production
Study: Shrimp weight, survival significantly greater in sand/substrate treatment than in sand and no-sediment
In intensive shrimp-culture systems, sediment and other surface areas can have both positive and negative effects on shrimp production. Sediments, particularly in closed culture systems with minimal or no water exchange, can provide buffering capacity and a source of macronutrients and micronutrients. Surfaces in general support a microbial community that is distinct from plankton, and may significantly affect nutrient cycling and dominant algal type.
Studies by the authors at the Waddell Mariculture Center in Bluffton, South Carolina, USA evaluated the roles of sediment and surfaces in the production of Pacific white shrimp. The authors found that supplemental vertical surface, added to production tanks in the form of artificial substrates, yielded higher shrimp production and significant differences in water quality when compared to tank setups with no sediment or just a sandy bottom surface.
Experimental setup
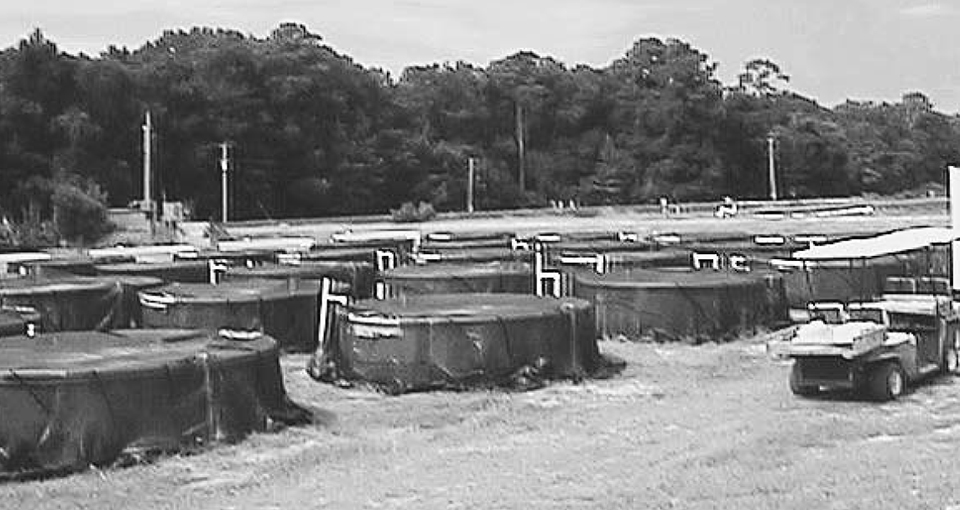
Twelve 3.35-meter-diameter polyethylene tanks were used to test three treatments: bare tank bottom, about 10 cm of sandy soil sediment on the tank bottom, and sand sediment with AquaMats® artificial substrate, which provided curtains of additional vertical surface in the water column. The substrate, installed at 1.7 meters per square meter, was trimmed to just below the water surface and arranged as the spokes of a wheel. All treatments had bare walls.
The tanks were filled with 25 ppt salinity water from the Colleton River and operated with no water exchange during a 104-day grow-out period. They received continuous aeration and water circulation via multiple air stones. A commercial inorganic fertilizer was applied once to promote algal growth.
![Ad for [Aquademia]](https://www.globalseafood.org/wp-content/uploads/2025/07/aquademia_web2025_1050x125.gif)
After initial bloom development, tanks were fitted with 63 percent shade cloth covers and stocked with PL7 Litopenaeus vannamei at a density of 130 per square meter. Commercial shrimp feed was applied twice daily in feed trays, with quantity adjusted based on apparent feed consumption. Feed protein content was 40 percent and 35 percent for the first and second half of the growing period, respectively.
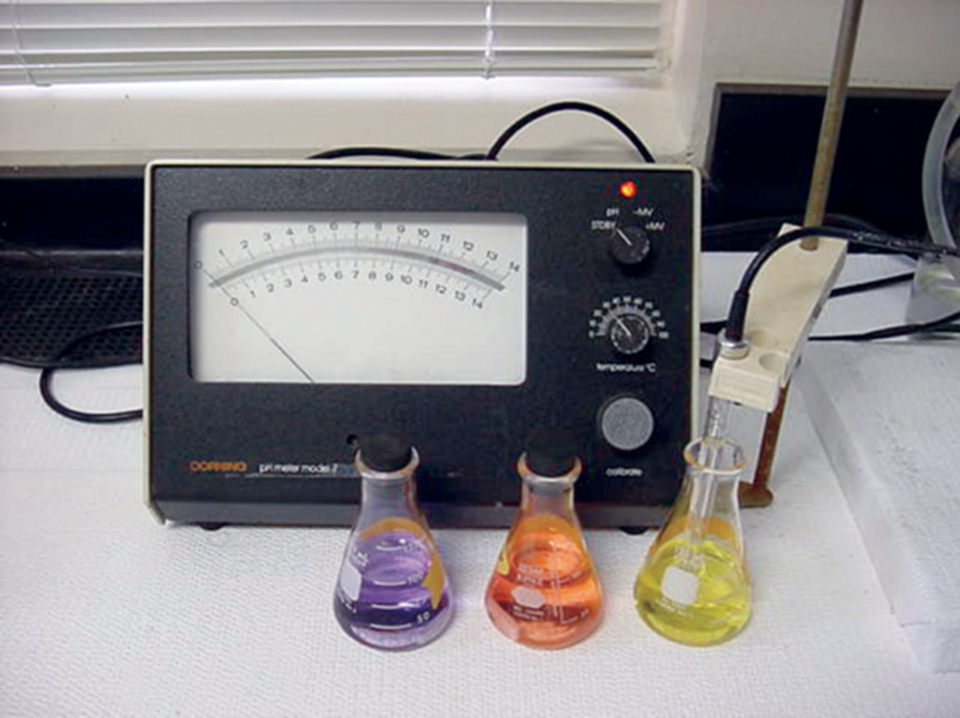
Control of pH
In response to pH measurements below 7.0 in the no-sediment tanks in the middle of the growing period, sodium carbonate was added at 17 grams per cubic meter when morning pH was lower than 7.0. This resulted in a pH increase of approximately 0.5 in less than half an hour after mixing.
Relative alkalinity prior to the addition of sodium carbonate was typically 25-50, while alkalinity in tanks that did not receive sodium carbonate was 50 to 120. Alkalinity was determined by the amount of acid required to reduce sample pH to 5.0, and thus provided only a relative measure because it did not account for buffering capacity in the full range of calcium carbonate.
Results
Average shrimp weight, survival, production, and feed conversion ratio (FCR) are shown in Table 1. The sand/substrate treatment had significantly greater shrimp weight, survival, and production than the other treatments. Similarly, the FCR was significantly lower in the sand/substrate treatment than in the sand and no-sediment tanks. There were no significant differences in any of these parameters between the sand and no-sediment treatments.
Shrimp growth
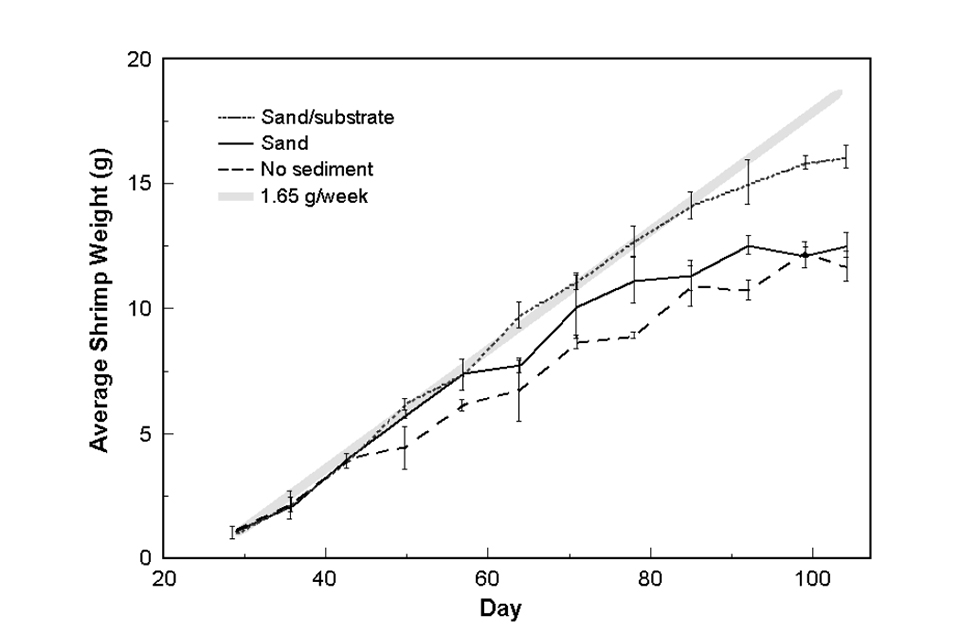
Shrimp growth rates in all treatments were approximately 1.65 grams per week (Fig. 1, broad grey line) until about day 60, after which a reduction was seen in the no-sediment and sand tanks. A growth rate decline was seen in the sand/substrate tanks beginning around day 85. There was no significant difference in the growth rates of the sand and no-sediment tanks.
pH and dissolved oxygen
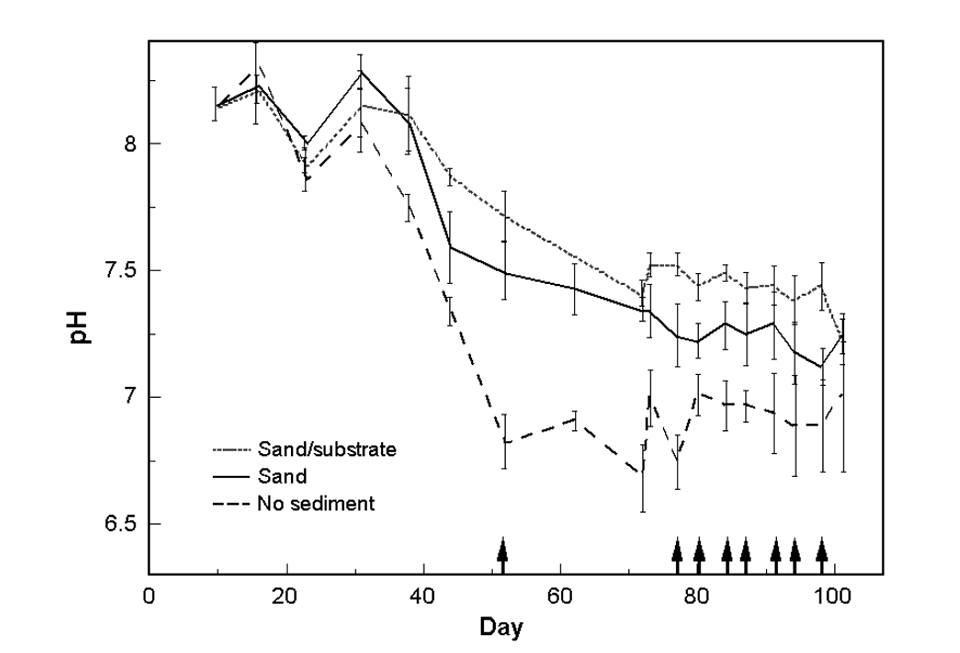
The pH of all tanks gradually decreased during grow-out (Fig. 2), and was significantly different between treatments. Average pH (based on measurements prior to the addition of sodium carbonate) was 7.30, 7.59 and 7.70 for the no-sediment, sand and sand/substrate treatments, respectively. The lowest morning dissolved-oxygen reading measured was 4.9 milligrams per liter. with average dissolved oxygen above 6.0 milligrams per liter.
Orthophosphate
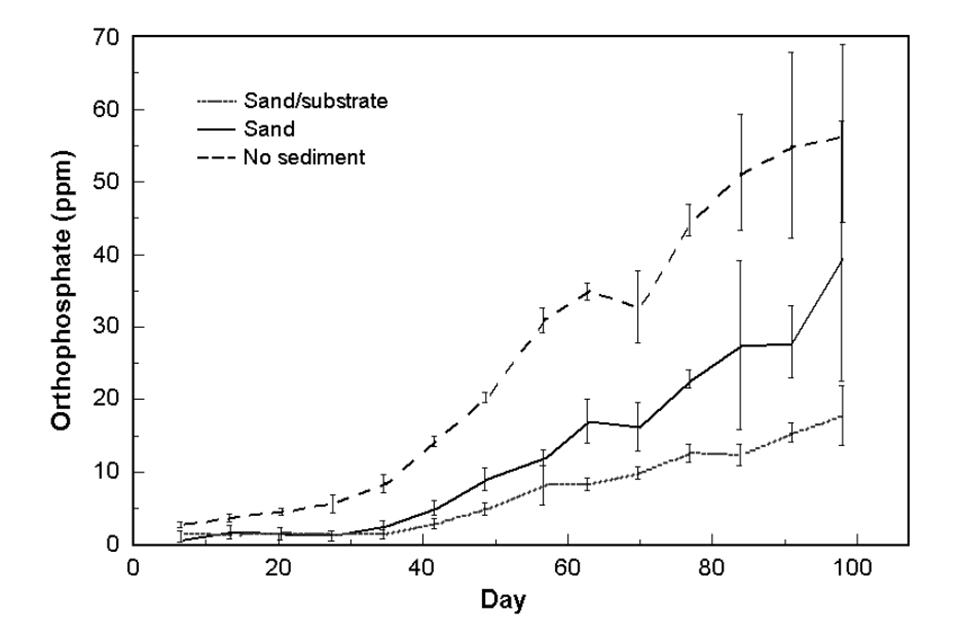
Reactive orthophosphate gradually increased in all treatments throughout the growing period (Fig. 3). Orthophosphate was significantly different between all treatments. The average values were 26, 12 and 7 ppm orthophosphate in the no-sediment, sand and sand/substrate treatments, respectively.
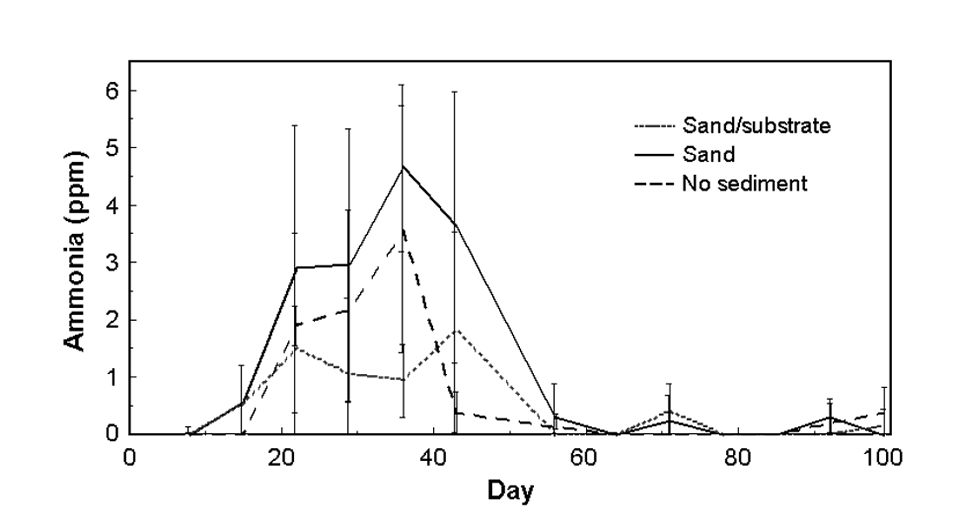
TAN
Total ammonia nitrogen (TAN) (Fig. 4a) was detectable from day 15 through day 43. During this time, TAN was significantly less in the sand/substrate tanks than the sand and no-sediment tanks, which were not significantly different from each other. From day 15 through day 43, TAN averages were 1.60, 2.92 and 1.17, with maximums of 6.69, 6.71 and 4.37 in the no-sediment, sand and sand/substrate treatments, respectively. After this period, mean TAN fell below 0.5 ppm in all treatments, and was not significantly different between treatments.
Nitrate and nitrite
Nitrate (Fig. 4b) was significantly different in all treatments. Mean nitrate levels were 29.2, 20.0 and 9.2 ppm, and maximum measurements were 109.3, 68.0 and 108.8 in the no-sediment, sand and sand/substrate tanks, respectively.

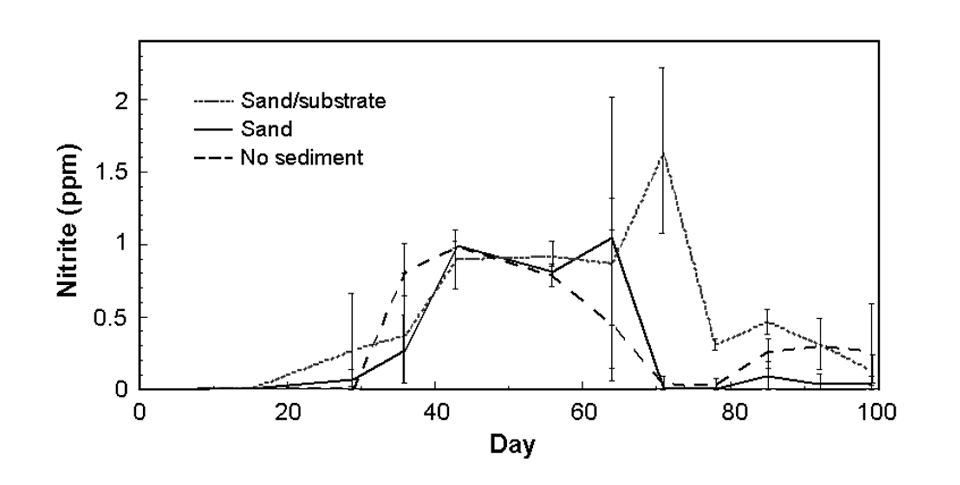
Nitrite levels (Fig. 4c) were similar in all treatments for the first 65 days. After this, nitrite in the no-sediment and sand tanks fell to undetectable levels, while nitrite in the sand/substrate tanks reached a peak. For the season overall, nitrite was significantly greater in the sand/substrate treatment than the other treatments. The maximum measured nitrite levels were 1.5, 1.9, and 2.3 ppm in the no-sediment, sand, and sand/substrate treatments, respectively.
Microbial activity
Plankton nitrification rates were similar in the sand and no-sediment treatments, but greater in the sand/substrate treatment. However, there was no significant treatment affect on plankton respiration rates.
Lower bacterial and algal plankton concentrations in the sand/substrate system, in conjunction with plankton respiration rates similar to the other treatments, suggested a greater rate of activity per cell by the sand/substrate plankton. Furthermore, greater total water column oxygen consumption in the sand/substrate than the sand communities suggested greater nutrient cycling in the sand/substrate system, likely underestimated by the oxygen-measuring method.
The combination of higher pH with lower TAN and orthophosphate in the sand/substrate tanks further pointed to greater overall algal activity in this treatment. Thus, the increased vertical surface area in the sand/mat treatment may allow both more attached algal development and more photosynthesis overall.
Sulfidic sediment
At harvest, the sand/substrate tanks had a considerable deposit of black, sulfidic sediment overlaying the sand sediment, whereas the sand and no-sediment treatments had relatively little black sediment. Based on measurements of carbon and nitrogen flux from the sediment and pelagic turnover rates, systems with benthic algal sediment communities may produce more biodegradable dissolved organic carbon than sand systems, thereby stimulating bacterial production and temporary immobilization of nitrogen in the bacterial and algal biomass.
Substrates and natural production
While this study was not designed to assess the effects of natural production on L. vannamei growth, similar initial growth rates and feed tray consumption in all treatments suggested similar benefits from natural production during early growth stages, presumably prior to large reductions in natural production commonly seen in intensive culture systems.
This suggests that as supplemental feed for the target crop, the greater quantity of natural production in the system with additional vertical surfaces may have been more important than qualitative differences. Alternatively, the physical presence of vertical curtains may have delayed the onset of other overcrowding effects such as stress. The relatively high density of additional vertical surfaces applied in this study had both positive water-quality effects (i.e., higher pH, and lower ammonia and nitrate) and potentially negative water-quality effects (i.e., higher nitrite).
Conclusion
Shrimp weight, survival and production were significantly greater in the sand/substrate treatment than in the sand and no-sediment treatments in this study. From a production standpoint, the primary difference in the no-sediment and sand treatments was the need for proactive management of pH in the no-sediment tanks.
Higher pH, in conjunction with lower phytoplankton biomass and ammonia in the sand/substrate treatment than the sand treatment, suggested greater carbon fixation by the attached algal community of the sand/substrate treatment. The added vertical surface yielded higher shrimp production in conjunction with significant differences in water quality and indicators of general activity, suggesting a high volume of additional surface can significantly affect aquaculture production systems.
(Editor’s Note: This article was originally published in the December 2001 print edition of the Global Aquaculture Advocate.)
Now that you've reached the end of the article ...
… please consider supporting GSA’s mission to advance responsible seafood practices through education, advocacy and third-party assurances. The Advocate aims to document the evolution of responsible seafood practices and share the expansive knowledge of our vast network of contributors.
By becoming a Global Seafood Alliance member, you’re ensuring that all of the pre-competitive work we do through member benefits, resources and events can continue. Individual membership costs just $50 a year.
Not a GSA member? Join us.
Authors
-

Waddell Mariculture Center
South Carolina Department of Natural Resources
P.O. Box 809
Bluffton, South Carolina 29910 USA -
Marine Resources Research Institute
South Carolina Department of Natural Resources
Charleston, South Carolina, USA
Related Posts
Responsibility
Assessing groundwater quality in aquaculture
Those interested in using groundwater for aquaculture should perform a thorough chemical analysis of the water. Several problems related to groundwater use in hatcheries and holding or transport vessels can be alleviated by degassing or aeration.
Responsibility
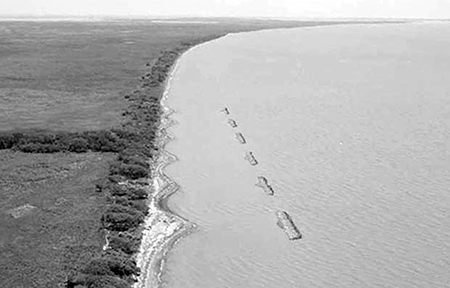
Lightweight oyster reefs reduce coastal erosion
A technique to stimulate oyster growth in the form of an oyster reef breakwater is being developed at Louisiana State University in Baton Rouge.
Responsibility
Pond bottom soil analyses
Limit pond soil analyses to soil particle size for use in pond construction decisions, initial analysis of total sulfur, occasional analyses of total nitrogen, and routine analyses of pH and soil organic carbon.
Responsibility
Water quality standards: Total suspended solids
Solids in water are either in true solution or suspended. Suspended solids remain in suspension because they are so small and light.