Climate researchers color-code stages of ocean acidification to illustrate changes
ETH Zurich bases its system on four decades of observations

To illustrate how ocean acidification has changed the ocean’s pH over the years, climate researchers from ETH Zurich developed a color-coded stripe system to help people better understand the concept.
Anthropogenic carbon dioxide emissions are acidifying the ocean, ETH says, and its online visualization tool shows how, via color-coded stripes, using data collected over 40 years. The Ocean Acidification Stripes tool also shows how ocean acidification has changed the chemistry of oceanic regions.
“Despite these profound changes, many people are not aware of what is happening to our oceans,” said Nicolas Gruber, a marine researcher and professor of environmental physics at ETH Zurich (Eidgenössische Technische Hochschule Zürich).
![Ad for [BSP]](https://www.globalseafood.org/wp-content/uploads/2025/07/BSP_B2B_2025_1050x125.jpg)
The ocean absorbs a large part of the extra heat that the increased concentration of greenhouse gases generated in the atmosphere and they also absorb about one-third of man-made carbon emissions from the atmosphere.
The graphic tool – inspired by the “temperature stripes” or “climate stripes” by the British climate scientist Ed Hawkins – depicts ocean acidification in different ocean regions over time in an intuitive manner.
“We aim to make ocean acidification more visible and raise awareness that this environmental change is another major consequence of anthropogenic CO2 emissions alongside atmospheric warming,” explains Gruber.
The scientific basis for the visualization is an observation-based dataset on ocean acidification called OceanSODA-ETHZ. It covers almost all ocean regions over the last forty years (1982 to 2021). OceanSODA-ETHZ was created in 2021 by Gruber’s postdoctoral researcher Luke Gregor, who combined ship measurements and satellite data using machine learning.
Now that you've reached the end of the article ...
… please consider supporting GSA’s mission to advance responsible seafood practices through education, advocacy and third-party assurances. The Advocate aims to document the evolution of responsible seafood practices and share the expansive knowledge of our vast network of contributors.
By becoming a Global Seafood Alliance member, you’re ensuring that all of the pre-competitive work we do through member benefits, resources and events can continue. Individual membership costs just $50 a year.
Not a GSA member? Join us.
Author
Related Posts
Responsibility
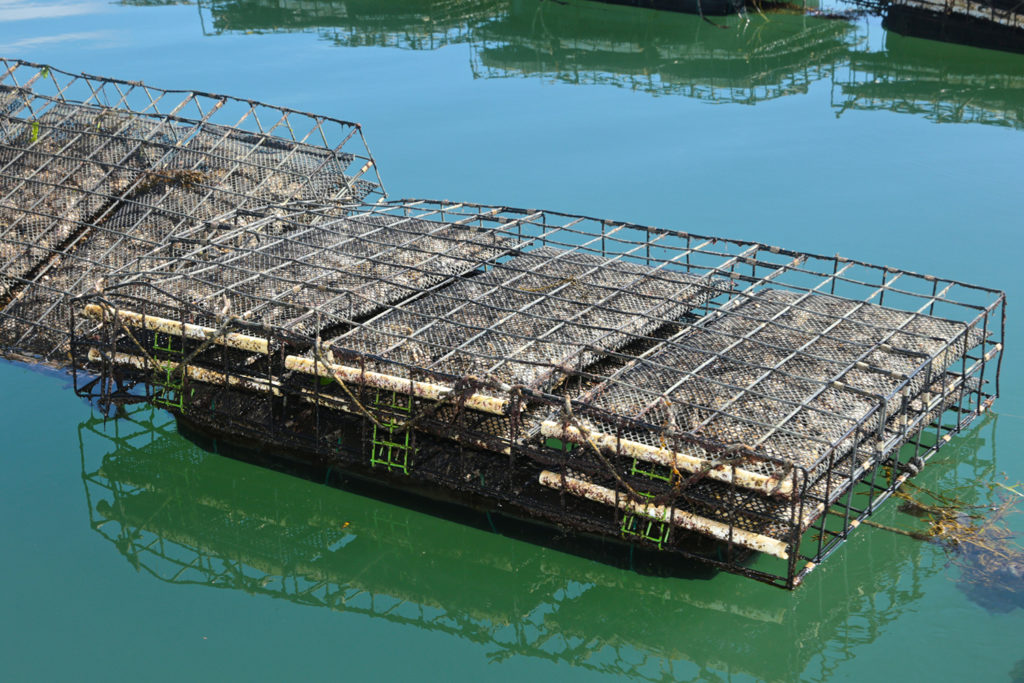
As ocean acidification threatens the shellfish industry, this California oyster farm is raising oysters resistant to climate change
Despite the dangers to shellfish posed by ocean acidification, a forward-thinking California oyster farm is producing oysters resistant to climate change.

Intelligence
Can seagrass and mangrove restoration help mitigate ocean acidification and climate change?
Researchers suggest seagrass and mangrove restoration could also remove carbon through a novel pathway while combating ocean acidification.
Innovation & Investment
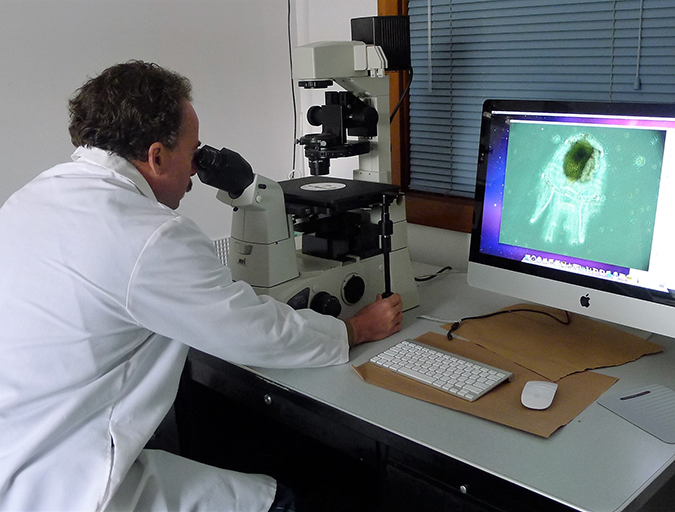
Better together: Partnerships drive innovation at leading labs
Laboratories with industry partnerships are making aquaculture more innovative, efficient and responsible. These collaborations offer access to expertise, facilities and funding to further the industry and improve global food security.
Responsibility
Climate change impacts unite U.S. shellfish farmers
The Shellfish Growers Climate Coalition, an initiative of seven founding U.S. aquaculture farmers, last week launched a partnership with The Nature Conservancy (TNC) to spread public awareness about climate change and its impact on their businesses.