Water quality impacts on health and performance of fish and shrimp, Part 2: pH, carbon dioxide, alkalinity, hardness and the water buffering system
Although there is a general consensus on the importance of water quality, many farmers still underestimate the negative impacts of marginal water conditions on aquaculture outcomes
This second of two parts addresses the relationships among pH, carbon dioxide, alkalinity, and hardness, and the effect of these parameters on performance and health of farmed fish and shrimp.
Hardness and alkalinity are the main components of the water buffering system (WBS). The WBS works to minimize daily variation in pH and carbon dioxide (CO2) due to microalgae photosynthesis and the respiration of aquatic organisms. The pH regulates the toxicity of harmful compounds, notably ammonia. CO2 is the main fuel for photosynthesis and the development of microalgae populations, which produce oxygen, remove ammonia, and are the base of pond food chains for fish and shrimp. Marginal conditions of these parameters can harm the overall well-being, health, and performance of fish and shrimp. The effects of dissolved oxygen and CO2 on performance and health of fish and shrimp were discussed in Part 1 of this series.

Definitions of pH, alkalinity, hardness, and carbon dioxide
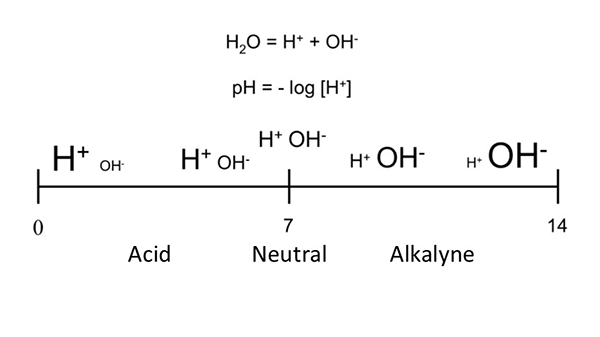
The pH shows whether water is acidic or alkaline, based on the balance between H⁺ (acid) and OH⁻ (base) ions (Fig. 1). Neutral water has a pH of 7.0; values below 7.0 indicate acidity, while those above 7.0 indicate alkalinity. Most fish and shrimp cannot survive in water with pH below 4.0 or above 11.0. In aquaculture, near-neutral pH suits most freshwater species, while slightly alkaline water (pH 7.5 to 8.5) is better for marine fish and shrimp.
Total alkalinity (TA) measures the titratable bases in water, mainly bicarbonate (HCO₃⁻), carbonate (CO₃²⁻), and hydroxide (OH⁻) ions. Total hardness (TH) reflects the concentration of metallic ions, primarily calcium (Ca²⁺) and magnesium (Mg²⁺). Together, TA and TH form the Water Buffering System (WBS), which works to minimize changes in pH and CO₂ concentration caused by microalgae photosynthesis and respiration, as well as, respiration of fish, shrimp, microbials and other aquatic organisms. The higher the TH and TA, the stronger the WBS. TA and TH are expressed in mg CaCO₃/L and can vary widely in natural waters. Seawater (≈35 ppt salinity) typically has TA of 120–150 mg CaCO₃/L and TH of 6,000–7,000 mg CaCO₃/L. In freshwater, TA and TH are invariably below 100 mg CaCO₃/L. In acidic rivers and groundwater in Amazonian regions, TA and TH are often near zero.
Agricultural limestone raises TA and TH but levels seldom exceed 50 mg CaCO3/L. Hydrated lime [CaMg(OH)4] and quicklime (CaMgO2) are more soluble and reactive, and can be used to raise TA and TH above 50 mg CaCO3/L. Sodium bicarbonate increases only alkalinity, while agricultural gypsum (calcium sulfate) increases only hardness. In intensive systems (RAS and BFT), hydrated or quicklime is commonly used to boost both parameters. Where hardness is already high, sodium bicarbonate or potassium hydroxide can selectively raise alkalinity.
Bicarbonate (HCO₃⁻) is required by autotrophic bacteria to oxidize ammonia and nitrites to nitrate and is a main source of carbon for microalgal photosynthesis. Calcium is highly demanded by shrimp due to the frequent molting necessary for their growth and is essential for egg hatching and the development of microcrustaceans fed on by fish and shrimp larvae. Farmers should maintain alkalinity and hardness above 40 mg CaCO₃/L in freshwater ponds and above 70 mg CaCO₃/L for marine shrimp culture.
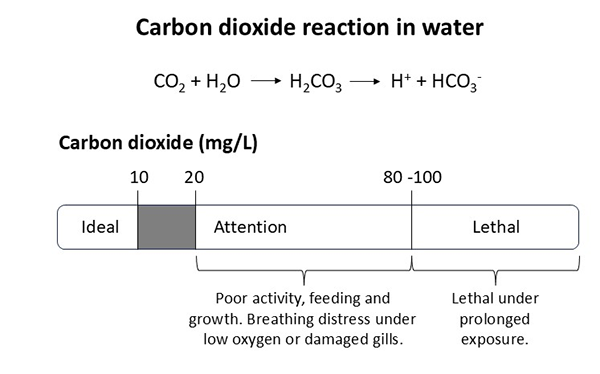
Carbon dioxide (CO₂): the main source in intensive ponds is the respiration of microalgae. Respiration of fish, shrimp and zooplankton, plus the microbes decomposing organic matter on pond sediments, are also important sources of CO₂. In BFT systems, CO2 originates mainly from the respiration of bacteria on organic flocs, then fish or shrimp. Bicarbonate ions (HCO₃⁻) are an important inorganic carbon source for microalgae photosynthesis.
Free CO₂ dissolves in water to form carbonic acid (H₂CO₃), a weak acid that partially dissociates into hydrogen ions (H⁺) and bicarbonate ions (HCO₃⁻). The release of H⁺ lowers the pH, making the water more acidic. Thus, CO₂ contributes to the acidity of water. As the concentration of dissolved CO₂ increases, more H⁺ is released, leading to a further decrease in pH.
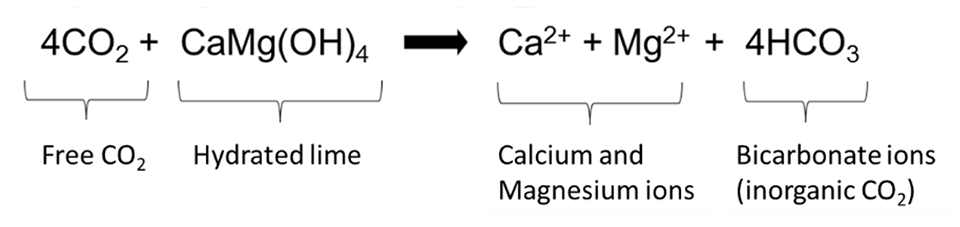
Night-time aeration helps to dissipate excess CO₂ to the atmosphere. However, liming – particularly with hydrated lime [CaMg(OH)₄] – is a more efficient practice to control CO2 in intensive ponds. Hydrated lime is readily soluble and reactive in water, and rapidly releases calcium, magnesium and hydroxide ions (OH–). Hydroxide ions immediately react with free CO2 to form bicarbonate, increasing both hardness and alkalinity and restoring the water buffering system (WBS), as shown in the equation in Fig. 3.
Hydrated lime should be applied in the early morning to ponds in split doses of 100–150 kg/ha/day in order to prevent a sudden pH rise. When CO₂ returns to acceptable concentrations (<10 mg/L) or TA reaches the desirable values, lime application can be reduced or discontinued. Farmers should be alert to total ammonia concentration and water pH increases when applying hydrated lime, especially in BFT and RAS tanks. High pH increases the risk of ammonia toxicity.
How the WBS works
The pH and CO₂ levels in pond water fluctuate daily, driven by the balance between photosynthesis and respiration. In green-water ponds, photosynthesis by microalgae from the morning to mid-afternoon consumes CO₂, raising the water pH. At night, photosynthesis stops and respiration predominates, increasing CO₂ levels to a maximum level at early morning and lowering the water pH.
The Water Buffering System (WBS) helps stabilize pH by maintaining equilibrium among CO₂, HCO₃⁻, and carbonate (CO₃²⁻) (Fig. 4). At night, CO₂ rises in pond waters and H₂CO₃ forms and releases H⁺, lowering the pH. This acidification dissolves carbonate minerals (e.g., CaCO₃, MgCO₃), releasing Ca²⁺, Mg²⁺, and CO₃²⁻. The CO₃²⁻ reacts with water to form HCO₃⁻ and hydroxide (OH⁻), which neutralizes excess H⁺ and helps buffer the pH.
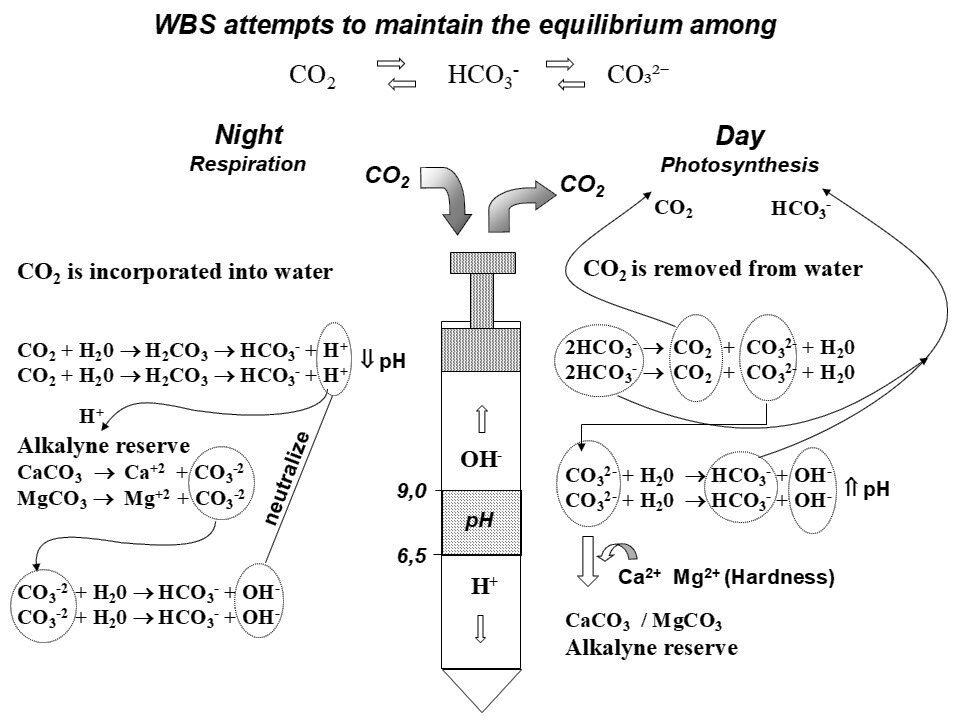
During daytime, microalgae photosynthesis removes CO2 from water. Photosynthetic CO₂ uptake is partly compensated by the conversion of HCO₃⁻ into CO₂, generating CO₃²⁻ in the process. Microalgae can also directly use HCO₃⁻ when CO₂ becomes limited. As CO₃²⁻ accumulates, it reacts with water to regenerate HCO₃⁻ and produce OH⁻, which could raise water pH levels. However, in the presence of free Ca²⁺ and Mg²⁺, CO₃²⁻ precipitates as CaCO₃ or MgCO₃, limiting OH⁻ accumulation and moderating pH increases. Thus, the WBS buffers daily pH and CO2 changes by regulating the chemical interactions between CO₂, HCO₃⁻ and CO₃²⁻, helping to maintain pH stability and low CO2 concentrations in pond waters.
Effect of pH on fish performance
Water pH has a direct effect on the performance and health of fish and shrimp. Additionally, it can enhance the toxicity of compounds such as ammonia, nitrite, and hydrogen sulfide. Optimum pH values may vary depending on the cultured species and the chemical composition of the water. For most farmed fish species, the best performance is usually observed in waters with pH between 6.0 and 8.0.
A water pH tolerance study with Nile tilapia 2g (fingerlings), 19g (juveniles) and 300g (adults) reported 100 percent mortality for all groups at pH 3.0 after 14 days of exposure. At pH 6.0 mortality was reduced to 42, 12 and 14 percent, respectively, per Mustapha and Atolagbe. Tilapia in acidic waters exhibited erratic swimming, gasping, mucus secretion, skin erosion, bleeding fins, feeding impairment, and lethargy attributed to acid stress, blood acidosis, epidermal damage, and osmoregulatory failure.
In contrast, Rebouças et al. (2015; 2016) found high survival for tilapia fingerlings (1.4 to 20 g) raised in water at pH 4.0 and 5.5 (Table 1). These researchers found that tilapia in acid or slightly acidic waters (pH 4.0 to 7.0) grew better and had improved feed conversions than in alkaline water (pH 8.0-9,5). In Egypt, a study by El-Sherif and El-Feky [2009. International Journal of Agriculture & Biology, 11(3), 297–300] found better weight gain in juvenile tilapia in water with pH 7.0 or 8.0 compared to pH 6.0 or 9.0 (Table 1). These authors made no mention of fish survival or water temperatures in the study. The poor growth rates and feed efficiency in this study, compared to the ones reported by Rebouças et al. in Brazil may be due to feed quality, lower water temperature, fish stress and other water quality parameters or experimental particularities.
Kubitza, water quality impacts, part 2, Table 1
| El-Sherif & El-Feky (2009) | Water pH in the experimental tanks | |||
|---|---|---|---|---|
| (Egypt - 60 days) | 6 | 7 | 8 | 9 |
| Initial weight (g) | 19 | 19 | 19 | 19 |
| Final weight (g) | 23.3 | 36.1 | 35.1 | 30.8 |
| WG (g/fish) | 4.3 | 17.1 | 16.1 | 11.8 |
| Relative WG | 100% | 398% | 374% | 274% |
| FCR | 8.8 | 3 | 3.1 | 3.9 |
| Rebouças et al. (2015) | Water pH in the experimental tanks | |||
| (Brazil - 56 days) | 4 | 5 | 6 | 8 |
| Survival (%) | 97.5 | 96 | 96.5 | 96.5 |
| Initial weight (g) | 1.61 | 1.61 | 1.61 | 1.61 |
| Final weight (g) | 22.78 | 23.22 | 21.08 | 18.25 |
| WG (g/fish) | 21.17 | 21.61 | 19.47 | 16.64 |
| Relative WG | 127% | 130% | 117% | 100% |
| FCR | 0.79 | 0.8 | 0.83 | 0.97 |
| Rebouças et al. (2016) | Water pH in the experimental tanks | |||
| (Brazil - 56 days) | 5.0 – 5.5 | 6.0 – 7.0 | 7.7 – 8.5 | 8.5 – 9.5 |
| Survival (%) | 97,1 | 97,1 | 94,3 | 91,4 |
| Initial weight (g) | 1.39 | 1.36 | 1.36 | 1.36 |
| Final weight (g) | 20.5 | 23.4 | 20.5 | 19.8 |
| WG (g/fish) | 19.1 | 22 | 19.1 | 18.4 |
| Relative WG | 104% | 120% | 104% | 100% |
| FCR | 1.09 | 1.03 | 1.12 | 1.13 |
Effect of hardness and alkalinity on Nile tilapia performance
There are few studies on the direct effects of hardness and total alkalinity on fish performance. Cavalcante et al. observed that Nile tilapia fingerlings grew 30 percent faster and had 17 percent better feed conversion ratio when raised in water with a calcium hardness (CH) to total alkalinity (TA) ratio close to 1:1, compared to fingerlings raised in water with low or excess calcium (CH/TA ratio of 0.5 or above 4; Table 2). Total alkalinity levels of 50 or 100 mg CaCO₃/L do not appear to have a direct effect on weight gain or feed conversion of tilapia fingerlings. However, at high calcium concentrations (230 to 480 mg/L) fish performance was impaired.
Kubitza, water quality impacts, part 2, Table 2
| Total alkalinity (TA) | 53 | 56 | 55 | 105 | 105 | 104 |
|---|---|---|---|---|---|---|
| Total Hardness (TH) | 58 | 97 | 277 | 94 | 147 | 529 |
| Ca2+ Hardness (CH) | 28 | 48 | 231 | 50 | 99 | 482 |
| Ration CH/TA | 0.5 | 0.9 | 4.2 | 0.5 | 0.9 | 4.6 |
| Initial weight (g) | 0.47 | 0.47 | 0.47 | 0.47 | 0.47 | 0.47 |
| Final weight (g) | 11.02 | 12.62 | 9.95 | 11.15 | 12.88 | 9.81 |
| Weight gain (g/fish) | 10.55 | 12.15 | 9.48 | 10.68 | 12.41 | 9.34 |
| Relative WG (%) | 113% | 130% | 101% | 114% | 133% | 100% |
| FCR | 1.49 | 1.27 | 1.51 | 1.48 | 1.26 | 1.55 |
Effect of pH and alkalinity on marine shrimp performance and health
Water pH directly affects shrimp growth. Vijayan and Diwan reported that Indian white shrimp postlarvae grew better at pH 8.0 than at pH 7.0 or 9.0 (Table 3). PLs raised at pH 9.0 had only 25 percent of the weight gain compared to those raised at pH 8.0.
Kubitza, water quality impacts, part 2, Table 3.xlsx
| Water pH | Growth (mg/PL) | Relative growth | Feed intake |
|---|---|---|---|
| 7 | 155.5 | 80% | Normal |
| 8 | 194.9 | 100% | Normal |
| 9 | 48.7 | 25% | Poor |
The tolerance of 10-g Litopenaeus vannamei to extreme water pH was evaluated by Furtado et al. Survival declined significantly under highly acid (pH ≤ 4.0) and highly basic (pH ≥ 9,6) conditions. Survival above 90 percent was observed after 96 h of exposure to pH between 4.5 and 9.5. Both acid and basic pH stress caused imbalances in antioxidant enzyme activities in the shrimp. Total antioxidant capacity also dropped significantly at pH 4.5 after 36 hrs.
Pan et al. conducted a 96-hour study on 18-day-old Litopenaeus vannamei postlarvae transferred from water at pH 8.1 to pH 7.1, 7.6, 8.1 (control), 8.6, and 9.1. Survival rates were similar across all treatments, but weight gain was significantly higher at pH 8.1 and 8.6 compared to 7.1, 7.6, and 9.1. Transfers to lower pH (7.6 and 7.1) increased the activity of V-ATPase and HCO₃⁻-ATPase (enzymes critical for acid-base regulation) with peak activity at 24–36 hrs. and stabilization afterwards.
Lin and Chen found that transferring shrimp from pH 8.2 to pH 6.5 or 10.1 caused a sharp decline in phenol oxidase (PO), superoxide dismutase (SOD), phagocytic activity, and respiratory burst – all key components of the immune response, compared to shrimp kept in water with pH 8.2. Normal immune response was restored only 5 days after transferring. Shrimp maintained at pH 8.2 were then challenged with Vibrio alginolyticus and immediately transferred to water at pH 6.5 or 10.1. Accumulated mortality 7 days after challenge was higher in shrimp transferred to water of pH 6.5 or 10.1, compared to shrimp kept in water of pH 8.2 (Table 4).
Kubitza, water quality impacts, part 2, Table 4
| Water pH | |||
|---|---|---|---|
| Immune responses | 6.5 | 8.2 | 10.1 |
| Relative PO activity (%) | 67% | 100% | 57% |
| Relative SOD activity | 83% | 100% | 70% |
| Relative Phagocytic activity (%) | 33% | 100% | 22% |
| Relative Respiratory Burst (%) | 80% | 100% | 69% |
| Mortality 7 days after challenge | 80% | 63% | 80% |
Piérri et al. evaluated the performance of L. vannamei on BFT experimental systems (165 shrimp/m3; salinity 32 ppt; initial weight 5,6 g; 45 days of culture), with TA of 40, 80, 120 or 160 mg CaCO3/L. No differences in growth, survival and FCR of shrimp were observed among the different TA (Table 5). In this study the lowest water pH range (6.9 to 7.2) was observed in the experimental BFT system with the lowest TA (40 ppm), and this caused a small reduction on shrimp survival.
Kubitza, water quality impacts, part 2, Table 5
| pH on the last 30 days | 6.9 – 7.2 | 7.3 -7.5 | 7.4 – 7.7 | 7.6-7.8 |
|---|---|---|---|---|
| TA (mg CaCO3/L) | 40 | 80 | 120 | 160 |
| Survival (%) | 94.8 | 96.2 | 99.7 | 96.8 |
| Initial weight (g) | 5.6 | 5.6 | 5.6 | 5.6 |
| Final weight (g) | 15.3 | 15.2 | 14.4 | 14.8 |
| FCR | 1.95 | 1.95 | 2 | 1.94 |
Furtado et al. evaluated the effect of total alkalinity (TA) levels –75, 150, 225, and 300 mg CaCO₃/L – on water quality and the performance of L. vannamei in a BFT system. Higher TA promoted biofloc development and nitrifying bacteria activity, improving water quality and shrimp performance, with optimal results at 300 mg CaCO₃/L.
In contrast, Gopalakrishnan et al. (2011. Journal of Environmental Biology, 32(3), 283–287) reported reduced survival, growth, and feed conversion ratio (FCR) in Penaeus monodon cultured in well water with TA of 200–320 mg CaCO₃/L, compared to shrimp raised in water with TA below 50 mg CaCO₃/L. After 185 days at 7 shrimp/m², the high-TA pond yielded survival, FCR and shrimp biomass of 70 percent, 3.19 and 1,020 kg/ha, respectively, compared to 95 percent, 2.82 and 1,635 kg/ha in the low-TA ponds. Calcium deposits appeared on shrimp shells from day 75 in the high-TA pond, affecting 43 percent of the shrimp by the end of the cycle. No calcium deposits were found in shrimp on the low-TA pond.
Similar results were observed by Sakthivel et al. in L. vannamei cultured in ponds with TA of 276–399 mg CaCO₃/L. Mineral deposits on the shell, eyes, and gills – known as rough shell disease – impaired physiological functions, reduced growth, and increased mortality. Shrimp raised in high-TA ponds had 79 percent survival and a final weight of 26 g, compared to 92 percent survival and 34 g in ponds supplied with estuarine water (TA 120–152 mg CaCO₃/L).
These results demonstrate that extreme pH disrupts the shrimp’s oxidative stress defenses, leading to physiological imbalances and potential growth impairment. Maintaining stable, optimal pH levels is therefore essential in aquaculture systems to ensure the health, performance, and survival of L. vannamei. Water pH between 7.5 and 8.5 are considered most suitable for marine shrimp farming. For alkalinity, the recommendation is to maintain at least 70 mg CaCO₃/L in conventional pond systems. However, in intensive biofloc systems – where CO₂ levels and acidity generation tend to be much higher (due to higher stocking densities, feeding rates, bacterial populations, and added carbon sources) – the alkalinity should be maintained at a minimum of 100 mg CaCO₃/L.
Final remarks
Although not an immediate threat to fish and shrimp, like oxygen shortages, the daily variations in pH and carbon dioxide in ponds – especially intensified in the final stages of cultivation due to excessive phytoplankton growth – can affect fish and shrimp wellbeing and health. Phytoplankton density must be controlled to minimize DO, CO2 and pH daily variation. Alkalinity and hardness should always be corrected through liming as needed to maintain an efficient WBS. Aquafarmers should include these parameters in their regular water quality monitoring and adopt corrective measures to ensure they remain within acceptable limits for the species being cultured.
Now that you've reached the end of the article ...
… please consider supporting GSA’s mission to advance responsible seafood practices through education, advocacy and third-party assurances. The Advocate aims to document the evolution of responsible seafood practices and share the expansive knowledge of our vast network of contributors.
By becoming a Global Seafood Alliance member, you’re ensuring that all of the pre-competitive work we do through member benefits, resources and events can continue. Individual membership costs just $50 a year.
Not a GSA member? Join us.
Author
-

Jundiaí, São Paulo, Brazil
Dr. Fernando Kubitza is a Brazilian aquaculture specialist, founder and director of Acqua Imagem Services in Aquaculture (www.acquaimagem.com.br), a 26-years old company leading on aquaculture projects, training and technical support in Brazil.
Related Posts
Responsibility
Green or muddy water in high-density tilapia ponds: Comparing performance, water quality and off-flavor intensity
Low water use and effluent discharge supports the sustainable growth of high-density fish ponds for aquaculture in water-limited regions.
Innovation & Investment
U.S. catfish industry seeking ‘tangential expertise’ to tackle off-flavors
A HeroX challenge has fielded ideas for preventing or eliminating off-flavors in farmed catfish, with potential solutions coming from unexpected places.
Health & Welfare
Advances in tilapia nutrition, part 1
This two-part review brings together scientific and field advances in tilapia nutrition and feeding to better support the formulation of feeds for better production performance.
Health & Welfare
The oft-overlooked water quality parameter: pH
Attention to pH, a numeric scale used to specify the acid or alkaline condition of an aqueous solution, is very important. Reducing biomass and feeding rates together with phytoplankton control and liming can often keep pH at desirable values.