Nonintrusive methods for fish biomass estimation in aquaculture, part 2
Review of acoustic, environmental DNA and resistivity counter methods
With the development of new information technologies, aquaculture researchers and producers have explored various methods to quantify fish biomass in cages or ponds without manual intervention. The number and types of these methods including machine vision, acoustics, environmental DNA and resistivity counter have been developed rapidly over the past three decades. These methods as a fast, noninvasive, objective and repeatable alternative provide possibility for remotely monitoring fish biomass in aquaculture. Machine vision methods were discussed in part 1 of this article; and acoustics, environmental DNA and resistivity counter methods are covered in this part 2.
This article – adapted and summarized from the original publication (Daoliang L. et al. 2020. Nonintrusive methods for biomass estimation in aquaculture with emphasis on fish: a review. Reviews in Aquaculture (2020) 12, 1390–1411.) – summarizes the development of various non-invasive methods that have been used for mass measurement, counting or direct fish biomass estimation over the past three decades.
Acoustics‐based methods
Compared with light waves, acoustic waves can travel long distances through water, making it the best way to remotely detect and identify objects in waters. With the development of acoustics technologies, the application of acoustics as a remote sensing tool has rapidly increased, particularly in protection zones. Recently, acoustics has been widely used in spatio-temporal distribution behaviors, species detection and fish stock assessment without causing stress to fishes. Based on their data acquisition methods for fish biomass estimation, acoustics can be divided into active acoustics and passive acoustics.
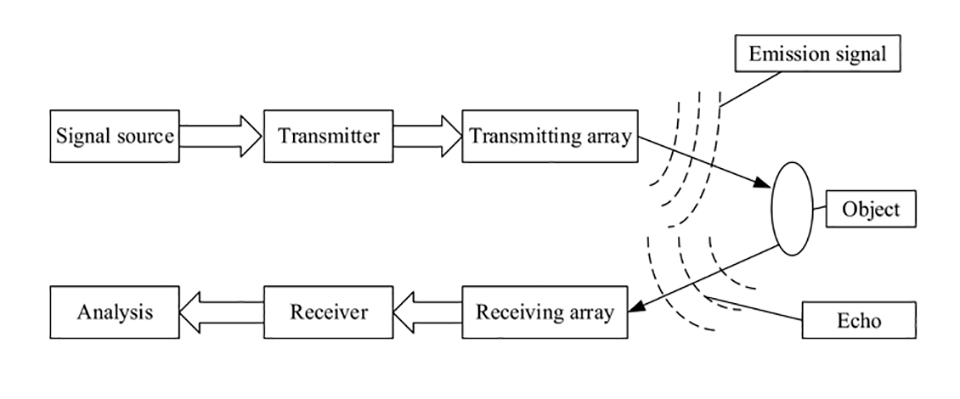
The principle of active acoustics is that the transmitter unit emits sound waves at a certain frequency into the waters to remotely detect targets. Active acoustics allows to rapidly sample large water volumes. In addition, it can non-intrusively work in dark and turbid waters. Active acoustics technology has been widely used in the investigation and assessment of fishery resources, and the main instruments can be mainly divided into echosounder and sonar camera.
Echosounder technology can be used to detect targets in waters through the physical characteristics of the target and the water medium. The acoustic waves emitted by the transducer of echosounder propagate in waters. When these waves encounter targets whose density is different from that of environments during transmission, they will be reflected and returns to the receiving array, which is called echo signal. These echo signals scattered back to the transducer are converted back into voltage parameter recorded for analysis, as shown in Fig. 3. The echosounder has been widely used in fisheries, especially for fish density estimation. By physical characteristic that echo-signal strength is proportional to fish number, the number of the fish can be estimated by some techniques such as echo-counting and echo-integration.
Commonly cited advantages of echosounder technology include that it can rapidly and non-invasively sample large water volumes. However, vessel avoidance and seasonal distribution can contribute to biased density estimates. There is a need to sample by small vessels at the appropriate time to limit the potential biases. Sampling intensity is needed to achieve reasonable levels of precision. In addition, there is a need to filter out the noise of the original acoustic image by effective data processing algorithms, and professional trained personnel is required to interpret acoustic data.
Sonar camera – also known as imaging sonar – is a recent adaption to convert sound into video images by acoustic sensors. Imaging sonar has the advantage that images can be obtained in dark or turbid waters. Acoustic signals from imaging sonar data are processed to show shapes and outlines of fish by image processing while also providing information on swimming speed or direction. Sonar cameras – such as dual-frequency identification sonar (DIDSON) and adaptive resolution imaging sonar (ARIS) – have been widely used in behavior monitoring, size measurement and counting. The area or volume density method is commonly used for fish counting.
https://www.aquaculturealliance.org/advocate/nonintrusive-methods-for-fish-biomass-estimation-in-aquaculture-part-1/
The DIDSON operates at two discrete frequencies consisted of a higher frequency that can produce higher resolution images of objects from close ranges and a lower frequency that detect targets from further ranges with lower resolution images. Sonar camera could work in almost zero-visibility conditions, which has recently attracted increasing attention. Several researchers have used DIDSON systems to assess fish, including to automatically count and size free-swimming farmed fish with error of 0 to 2.4 cm, and to assess behavior and length of cultured Chinese sturgeon in cages. The ARIS system was adopted by researchers to count successfully large free-swimming fishes with precision rate of no less than 94 percent.
The sonar cameras can obtain images whose quality approximates that of images obtained by optical cameras, even in dark or turbid waters, and without injury to the fish. These images are sufficient to show shapes and outlines of fish in their habitats. However, the side scan range of the DIDSON is limited and the fish inclination angle in vertical direction may lead to reductions for length measurement. And environment conditions like waves and bubbles can affect the quality of the video images. It is preferable for the sonar camera to operate during good weather days, or to stay as stationary as possible.
Overall, the extreme complexity of acoustic-based procedures, expensive software and processing large data remain major challenges for these technologies. Therefore, special image processing software – such as deep learning [a part of a broader family of machine learning methods] can be used to address these challenges. If paired with optical video camera systems, the sonar camera identifications could be verified by video images.
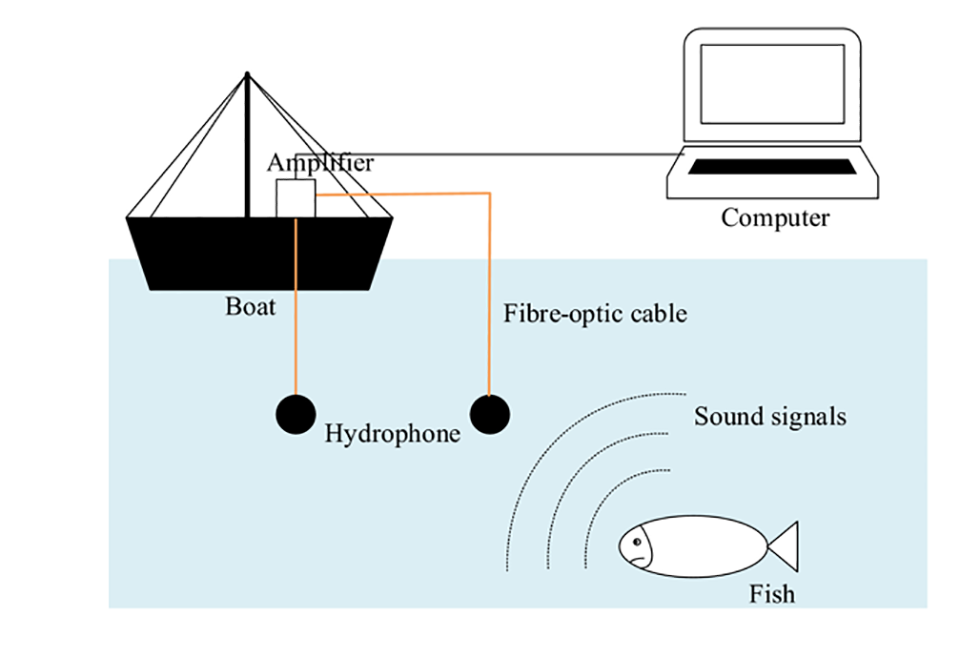
Passive acoustics is a technology that can be used to listen to sounds by hydrophones that do not emit acoustic signals into waters (Fig. 2). The technology takes advantage of the fact that many species of fishes can naturally produce various, diverse sounds in several conditions. Generally, low-frequency hydrophones that typically convert sound pressure into electrical signals recorded by data acquisition system are utilized to detect and monitor sounds. Passive acoustics is an active field in the study and surveys of many fishes. The sounds produced by fishes are used to analyze fish behaviors and quantify fish abundance by specific algorithms.
Passive acoustics can be an attractive alternative or supplement to count fishes and has the ability to collect data remotely and inexpensively over long periods of time. However, the sounds of most species are not produced continuously but produced more commonly at night or during periods of specific behavioral activities such as feeding. At what distance these sounds could be detected is dependent on sound source levels and environmental sound levels. These challenges make interpretation of the results more difficult than those derived from active acoustic. The potential of passive acoustics has been hampered by a widespread lack of familiarity with the technique and methodologies.
Therefore, new developments of hardware and software are needed to further improve or advance management of fish populations. In addition, in a realistic environment, the environmental noise is mostly periodic noise, but fish sounds are random signals. Removing environmental noise using supervised and unsupervised approaches is necessary to improve the accuracy of passive acoustics method.
Environmental DNA (eDNA)-based methods
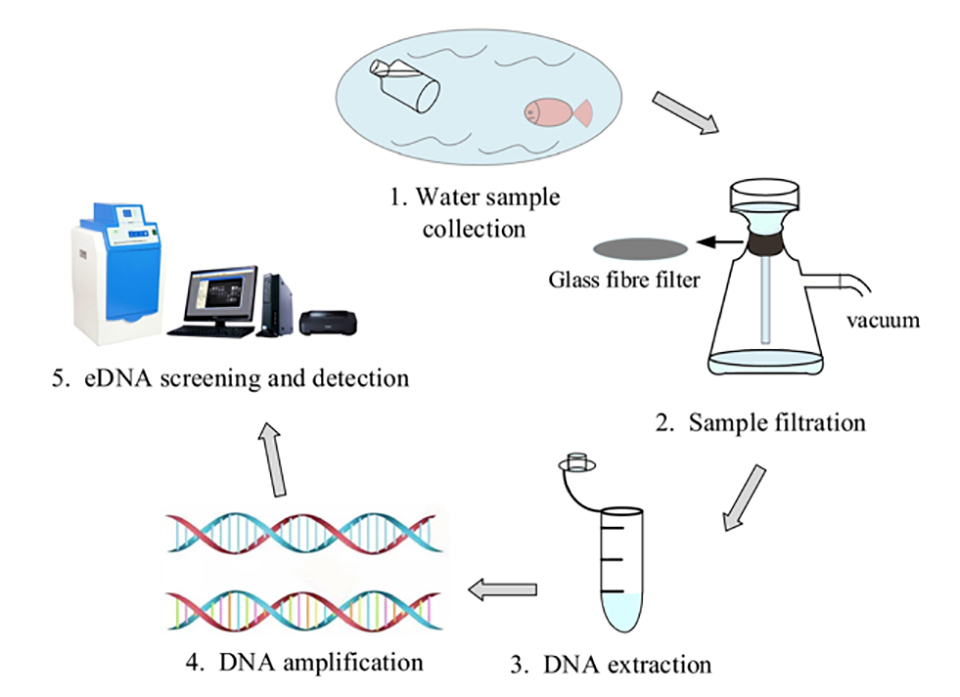
The Environmental DNA (eDNA) method involves the extraction of Deoxyribonucleic Acid, DNA [the chemical name for the molecule that carries genetic instructions in all living things] from environmental samples without the need to first isolate any interested organism. It includes the DNA of environmental microorganisms, feces, urine, mucus, extracellular DNA resulting from the natural death of organisms, subsequent destruction of cellular structure and others. The eDNA technology mainly refers to methods of sequencing analysis [determining the order of nucleotides, the components of DNA, in a sample] with DNA from environmental samples using a set of species‐specific equipment and inputs.
Some advances in quantitative real-time polymerase chain reaction, qPCR [laboratory technique of molecular biology based on the polymerase chain reaction, PCR, which monitors the amplification of a targeted DNA molecule during the PCR in real time] and next-generation high-throughput sequencing technology [several different modern sequencing technologies for sequencing of DNA much more quickly and cheaply than previously used methods] further expand application of eDNA technology from the microbiological field to other fields, including aquaculture.
So far, there are relatively few studies on aquatic biomass assessment, mostly because aquatic animals are mobile, easy to hide and hard to catch in situ. However, the eDNA technology certainly provides an interesting opportunity for aquatic biomass assessment. The steps for fish biomass assessment from water samples are shown in Fig. 3. The eDNA technique can also be used to investigate the presence or absence of aquatic animals inhabiting lakes and ponds, rivers, and marine habitats and estimate aquatic distribution and biodiversity.
The eDNA technology for fish biomass assessment was proposed by researchers that assumed that biomass of aquatic vertebrates is proportional to the quantity of eDNA released by vertebrates into waters at a rate. With statistical procedures they demonstrated that fish biomass could be estimated by concentrations of eDNA copies, and that the fish biomass was positively correlated with the concentration of eDNA. Other researchers have used the concentration of eDNA for fish abundance and biomass evaluate fish size and behavior.
These and other studies indicate the great potential of eDNA technology as a useful and cost-effective tool for fish biomass estimation. However, the limiting factor may be the ‘knowledge gap’ about how environmental conditions such as water chemistry and temperature affect eDNA concentration. Further study should elucidate how fish biomass and environmental conditions influence eDNA dispersion and degradation. In addition, there are some disadvantages such as PCR inhibition for eDNA analysis and false positives of eDNA from wastewater contamination. In future applications, such disadvantages of eDNA technology should be considered. From a technical standpoint, the choice of filters to capture eDNA is also important. At present, the research about the eDNA is still in its infancy, the future development and applications of the eDNA can make significant impact on cost-effective fish biomass estimation.
Resistivity counter‐based methods
Resistivity counters have been used as a non-invasive tool to monitor migratory fish populations in waters, which can provide essential information for abundance or biomass. If there is an electric potential between two electrodes in fresh water, a small current is passed through these electrodes. But the small current is affected by the presence of fish because the fish’s resistance is lower than water resistance near the electrodes. The resistivity measurement can be carried out by placing two face-to-face conductive plates underwater. When the fish pass through these electrodes, the resistance between two plates will be recorded.
The electrical resistivity counter was developed to count fishes automatically. When fish pass through one or more pairs of electrodes in surrounding water, the characteristic changes in electrical resistance will be detected and recorded. Electrical resistivity counters have been extensively applied to monitor fishes at specific points like rivers or fish passage areas. The information that the resistivity counters provide has been widely used to monitor long-term trends in fish abundance, and these counters have also been used to monitor the various environmental impacts on fish migration, and to evaluate fishway utilization and performance.
Resistivity counters have some disadvantages – such as missed, false and multiple counts – and also can count many fish that pass simultaneously through the electrodes as a single fish. Resistivity counters could be combined with optical sensors to improve their accuracy. In addition, the conductivity of fish is relatively stable, while the conductivity of waters varies greatly with discharge. Therefore, the amplitude of signal produced by a fish of a given size at a certain distance above the electrode varies with the conductivity of waters, and it becomes smaller as water conductivity increases. For this case, automatic compensation for conductivity variation is necessary so that the detected electrical resistance of fish remains constant regardless of the conductivity of waters.
Challenges and future perspectives
The information on fish biomass during different growth periods is critical because it allows managers to optimize feeding demands and make effective decisions. However, the acquisition of fish biomass information is very difficult and challenging. One of the major reasons is that fishes are sensitive and freely move in an environment where lighting, visibility and stability are not controllable. Another reason is that estimating fish biomass should not disturb fish growth or cause the stress to fish, which limits the application of some technologies. Manually sampling is usually time-consuming, laborious, invasive and inaccurate. Therefore, using rapid, cost-effective and noninvasive methods for fish biomass estimation is imperative for intensive aquaculture.
With new information technology such as advanced sensors and big data, machine vision, acoustics, environmental DNA and resistivity counters have been developed to improve the automation level in precision fish farming. These non-invasive methods have been applied for fish biomass estimation. However, special limitations of each method still exist. There are currently several different trends in fish biomass estimation to further improve the level of precision farming, including:
- Combining machine vision with acoustics technique – Machine vision has been widely used as an alternative to measure fish size, especially in dead zones where acoustic equipment is inaccessible. However, acoustics techniques being independent of light intensity can be used to count fishes. Therefore, the combination of acoustics technique with machine vision can non-invasively provide information on fish biomass.
- Using remote satellite image and geographic information systems, GIS [framework that provides the ability to capture and analyze spatial and geographic data] – Remote sensing information is often accompanied by the development of prediction models. Remote sensing satellites are used to estimate chlorophyll [photosynthetic green pigments in algae, blue-green bacteria and plants] in oceans or freshwater, and positive linkages between chlorophyll and fish productivity have been demonstrated by researchers. Therefore, remote sensing satellite combined with other information derived from GIS could be further used for fish biomass estimation.
- Improving the effectiveness of object recognition using information fusion technique – The information fusion technique based on color and thermal images has been used to address the problem about similar colors of objects and backgrounds. To some extent, fish detection is difficult because their colors often resemble the background in which they live in. Therefore, a multimodal imaging platform consisting of color and thermal cameras with advanced deep learning algorithms could be developed to detect fishes and achieve more accurate biomass estimates.
- Expanding and improving the capabilities of underwater acoustic sensors – For example, a set of underwater sonar sensors can count fish number in a wide area. In future studies, the simulator can be extended to measure fish size for the total weight estimation, which can be useful for biomass estimation in aquaculture.
We have reviewed the current development in different noninvasive methods including machine vision, acoustics, environmental DNA and resistivity counters for fish biomass estimation. With the in-depth integration of information technology and aquaculture, the fusion of optical technology combined with other techniques, some new improved algorithms and special processing software will be developed for more accurately and non-invasively estimations of fish biomass to meet the automation level of precision breeding.
References available in original publication.
Now that you've reached the end of the article ...
… please consider supporting GSA’s mission to advance responsible seafood practices through education, advocacy and third-party assurances. The Advocate aims to document the evolution of responsible seafood practices and share the expansive knowledge of our vast network of contributors.
By becoming a Global Seafood Alliance member, you’re ensuring that all of the pre-competitive work we do through member benefits, resources and events can continue. Individual membership costs just $50 a year.
Not a GSA member? Join us.
Authors
-

Corresponding author
College of Information and Electrical Engineering
China Agricultural University
Beijing, China -
College of Information and Electrical Engineering
China Agricultural University
Beijing, China -
University of Bedfordshire Business School
Luton, UK
Related Posts
Health & Welfare
Nonintrusive methods for fish biomass estimation in aquaculture, part 1
Article summarizes various noninvasive methods for mass measurement, counting or direct fish biomass estimation over 30 years. Part 1: machine vision.
Innovation & Investment
Acoustic control improves feeding productivity at shrimp farms
In systems recently developed for shrimp farms, passive acoustic-based technology enables sensor-based control of multiple automatic feeders. Improved growth and feed conversion have been recorded at commercial farms using the technology.
Health & Welfare
Barcoding, nucleic acid sequencing are powerful resources for aquaculture
DNA barcoding and nucleic acid sequencing technologies are important tools to build and maintain an identification library of aquacultured and other aquatic species that is accessible online for the scientific, commercial and regulatory communities.
Health & Welfare
Predicting parasite outbreaks in fish farms through environmental DNA
This article presents the results of a study using environmental DNA methodology for the early detection and quantification of various pathogens in farmed barramundi, where the technique showed to be a powerful and novel tool to predict fish mortalities.