Mapping global declines in human-driven mangrove forest loss
Human activity was a dominant cause of deforestation, but its impact has lessened since 2000

Mangrove forests are globally recognized as highly carbon-rich tropical ecosystems that provide a range of critical economic and ecological services to surrounding coastal populations. However, mangroves have been heavily impacted by degradation and deforestation, with 20 to 35 percent of global mangrove loss over the last 50 years.
Twentieth-century mangrove losses were largely dominated by forest clearing and exploitation for timber production and raw materials, as well as rapid coastal population growth and urban expansion. Economic and political emphasis on aquaculture development has led to large-scale conversion of mangroves to shrimp and rice aquaculture ponds to take advantage of the growth in global aquaculture demand. Climate change and oceanic warming are expected to increase global sea levels, wave energy and the intensity and frequency of extreme weather events (EWE) such as droughts and tropical cyclones, exacerbating these large-scale losses from land-use change. Measuring the impacts of humans and natural processes on these ecosystems will be critical to the advancement of “blue carbon” science and policy.
Understanding the causes of mangrove loss is important for establishing opportunities for blue carbon projects. In particular, quantifying the reasons for mangrove loss is critical for the estimation of carbon emissions, and the opportunities for enhancing “blue carbon” through management.
This article – summarized from the original publication (Goldberg, L. et al. 2020. Global declines in human-driven mangrove loss. Global Change Biology 26(10): pp. 5844-5855) – presents the results of the first global, high-resolution, mangrove-specific land use change models, capturing the broad range of human-driven stressors and natural disturbances that occur along the coastal margin.
![Ad for [BSP]](https://www.globalseafood.org/wp-content/uploads/2025/07/BSP_B2B_2025_1050x125.jpg)
Study setup
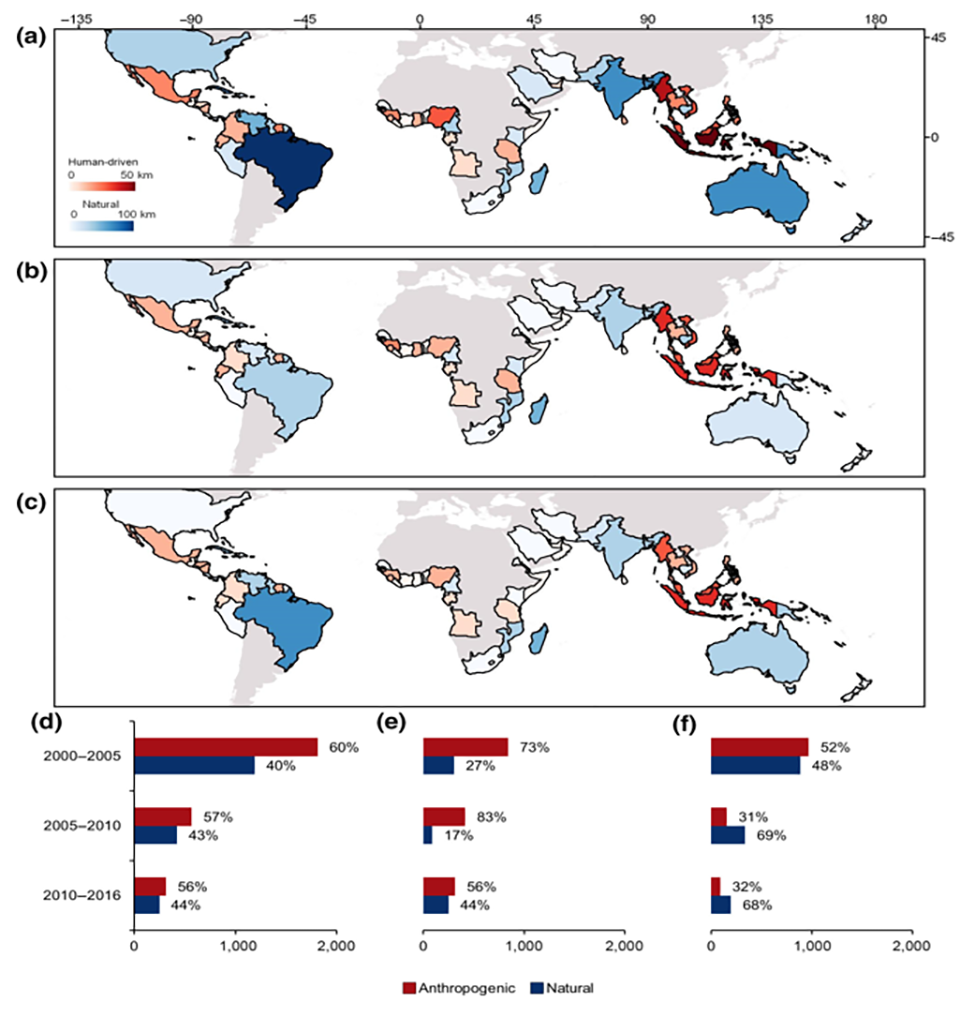
We used a Random Forest-based analysis of over one million Landsat images, producing the first 30m resolution global maps of the drivers of mangrove loss from 2000 to 2016, capturing both human-driven and natural stressors. Then, machine learning algorithms were employed to classify mangrove land cover changes using a pixel-based approach that quantified wet pixels, dry pixels, and water pixels. Lastly, the land cover maps were passed through a series of decision trees to separate anthropogenic and natural losses. We ultimately produced global 30 m resolution loss extent, land cover change, and loss driver maps with uncertainties for all mangrove-holding nations from 2000 to 2005, 2005 to 2010, and 2010 to 2016. For detailed information on materials and methods used, consult the original publication.
Results and discussion
Overall, 3,363 km2 (2.1 percent) of global mangrove area was lost between 2000 and 2016, at an average annual rate of 0.13 percent. Human activity persisted as the dominant agent of mangrove loss but was unevenly distributed around the world. From 2000 to 2016, anthropogenic causes accounted for 62 percent of total global mangrove loss area (Fig. 1). Commodities (CM), a combination of rice, shrimp, and oil palm cultivation, served as the primary global driver of mangrove loss, constituting 47 percent (1,596 ± 42 km2) of global losses from 2000 to 2016. Non-productive conversions (NPC) caused 12 percent (398 ± 29 km2) of global losses, with reclaimed lands for human settlements (ST) only representing 3 percent (96 ± 15 km2). The remaining 38 percent of total mangrove loss was attributed to natural causes. Shoreline erosion (ER) represented the second highest percentage of global losses at 27 percent (912 ± 41 km2) and extreme weather events (EWE) contributed 11 percent of losses (361 ± 31 km2).
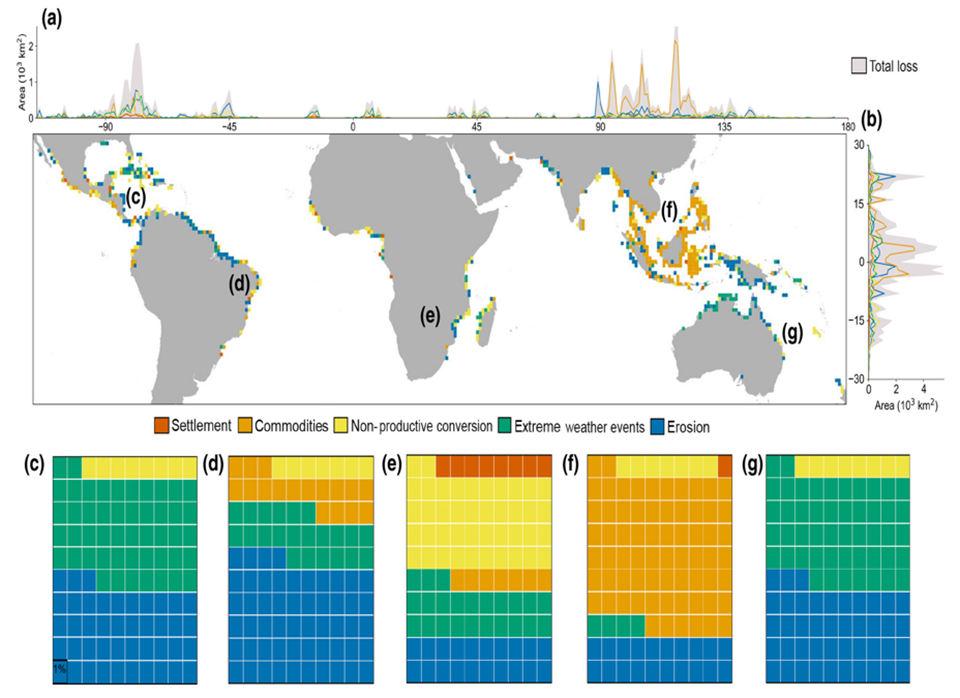
We report that the majority of mangrove losses (62 percent) around the world since the start of the 21st century is a result of human impact along the coast. Moreover, nearly half of all global mangrove losses were attributed to commodity-based land use changes based on commodities (CM) – a combination of rice, shrimp, and oil palm and other cultivation. Across each epoch, CM remained the primary proximate driver of mangrove change, but we measured a significant decline in the rate of direct anthropogenic loss from CM, ST and NPC over the study period. As previous regional studies have shown, Southeast Asia contributes disproportionately to global anthropogenic losses, particularly as a result of conversion to CM (Fig. 2a). Our data show that those regional CM hotspots account for 92 percent of all CM losses occurring in mangroves around the world and that these hotspots can occur within countries regardless of national mangrove inventory (Fig. 2b).
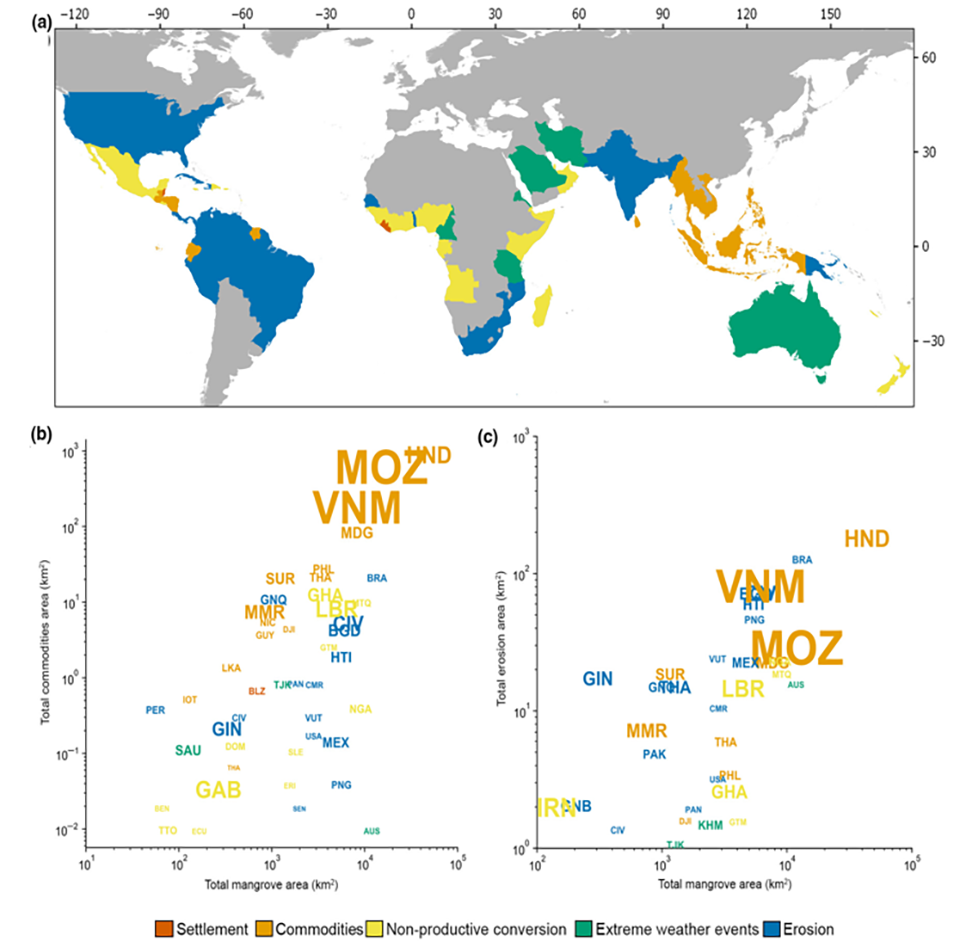
Natural losses also remained a significant factor contributing to global mangrove change. ER served as the second largest cause of mangrove loss, representing 27 percent of all losses. The total area of ER increased correspondingly with national mangrove inventory, remaining a prominent driver in even the primarily CM-threatened nations of Southeast Asia (Fig. 3c). However, excluding the six Southeast Asian nations with extensive CM-driven loss, natural threats contribute the greatest area of global mangrove loss. Shoreline ER then becomes the primary global loss driver, accounting for 43 percent of total (non-Southeast Asia) losses. With the exception of several anthropogenic hotspots, we identify that the majority of the world’s mangroves are under the influence of ER and EWE.
Worldwide, the observed decline in human-driven conversions may reflect a combination of site-specific mangrove ecosystem service valuations and recent increase in interest for large-scale restoration and conservation efforts. The value of mangrove ecosystem services has been known for centuries, but until the early 21st century, mangrove restoration projects saw no significant changes in objectives, with silviculture as the dominant goal.
Observed declines in many of the CM hotspots of the 21st century could be a consequence of a lack of remaining mangroves viable for conversion to aquaculture or infrastructure. Mangrove areas were therefore facing widespread clearing for aquaculture in particular far before our study period, suggesting that the CM hotspots and declines in CM loss recorded here could be reaching local ecological capacity. With the observed historic losses and continued fragmentation, the decline in human exploitation is therefore expected within CM hotspots. Given their current status under observed decades of loss, knowledge on localized tipping points where insufficient forest area remains for conversion, as well as the location of viable areas that should be protected, is a critical area of future study.
The emergence of extreme weather-driven mangrove losses is expected to continue in the future irrespective of land-use policy, as stressors such as extreme events and sea level rise cause large-scale disturbances regardless of protection status. Short-term mangrove protection in regions immediately adjacent to eroding shorelines is necessary, but long-term plans that account for coastal squeeze impacts, as well as the effects of a changing climate, are critical for maintaining mangrove ecosystem services.
Pathogen filtration is an untapped coastal ecosystem service
Previous works at the regional scale have disaggregated mangrove loss into their proximate drivers of change. These efforts have largely centered on the intersection of various earlier datasets. Our study improves on these estimates by correcting for known alignment issues throughout certain regions within the MFW map. Similarly, we overcome the water masking issues with the GFC loss layer to better capture ER along the seaward margin and other flooding conditions. The GFC dataset also captures considerable temporary loss in regions that could recover quickly after cyclones and other EWE. Differences in methodology, classification types, and time period make a direct comparison difficult, but ultimately the data presented here support previous findings on the dominance of commodity-driven loss in Southeast Asia. We now show that these commodity-driven losses are, in fact, the majority cause of mangrove loss worldwide.
In a recent global analysis of drivers of mangrove loss, ER was identified as a major influence on mangrove forests. Indeed, ER was among the dominant drivers of mangrove loss across all continents as measured by the single occurrence of each driver within 1°×1° geographic grid cells. Here we support these findings by quantifying the continued prevalence of ER as a substantial global threat. We show that ER losses contribute 27 percent of global losses and occur in nearly all mangrove-holding nations. Moreover, we estimate that without the dominant influence of CM in select regions, ER would be the primary cause of global mangrove loss.
Though this study provides the first global quantitative estimates of natural and anthropogenic mangrove loss drivers, the use of previously established datasets such as global agriculture or settlement layers propagates error into the disaggregation of each driver class. The use of sea level rise and land subsidence estimates and projections would enable the identification of pixels of ER influenced directly by changing sea levels, moving toward a quantitative global estimate of the impact of climate change on mangrove loss. Our current mangrove loss maps are based solely on proximal-based anthropogenic and natural threats.
Perspectives
Global initiatives have set the goal of increasing global mangrove area by 20 percent by 2030, inspiring widespread restoration and rehabilitation projects worldwide. In developing high-resolution and thus locally relevant loss driver maps, we enable conservation and restoration plans to modify their adaptive management strategies based on the intersections of various stressors. Our study’s global-scale quantification of the proximate drivers of mangrove loss will be coordinated with other global-scale mangrove studies, providing mangrove stakeholders around the world with transparent and open data to in order to increase the update and impact of large-scale mangrove research and conservation. Conservation and restoration plans will differ significantly based on the type of mangrove loss.
Our findings suggest that human activity has been a dominant cause of mangrove forest loss, but its impact has decreased since 2000. We observe the emergence of natural drivers as the primary causes of modern mangrove loss, as a consequence of both a lack of available viable mangrove forest and the emergence of effective conservation initiatives. The future sustainability of mangrove forests must consider the severity and intensification of extreme weather and ocean processes as increasingly important drivers of global losses. By disaggregating individual loss drivers, this work can aid restoration efforts by revealing ongoing stressors past and present within a specified region, making management efforts more informed and effective.
Regardless of the current level of direct human intervention in the forest, the intersection of existing anthropogenic and future climatic losses must be considered when enacting future ecosystem valuation and conservation on an increasingly human-dominated planet.
Now that you've reached the end of the article ...
… please consider supporting GSA’s mission to advance responsible seafood practices through education, advocacy and third-party assurances. The Advocate aims to document the evolution of responsible seafood practices and share the expansive knowledge of our vast network of contributors.
By becoming a Global Seafood Alliance member, you’re ensuring that all of the pre-competitive work we do through member benefits, resources and events can continue. Individual membership costs just $50 a year.
Not a GSA member? Join us.
Authors
-

Corresponding author
Biospheric Sciences Laboratory, NASA Goddard Space Flight Center, Greenbelt, MD, USA -
Biospheric Sciences Laboratory, NASA Goddard Space Flight Center, Greenbelt, MD, USA
-
Biospheric Sciences Laboratory, NASA Goddard Space Flight Center, Greenbelt, MD, USA
-
Biospheric Sciences Laboratory, NASA Goddard Space Flight Center, Greenbelt, MD, USA
Related Posts
Responsibility
Assessment of restored mangrove forests in abandoned aquaculture ponds in Perancak, Indonesia
Restored mangroves had significantly higher plant litterfall production than intact mangroves, but no significant difference in leaf litter decomposition.

Responsibility
A wider view: Consensus on seafood’s planetary and human health benefits
Several recent reports echo the message that eating sustainable seafood can help save the planet while making significant gains in public health.
Intelligence
Evolution of shrimp farming in Bangladesh
The social and environmental improvements – in combination with job-generating foreign investment – have led to wide acceptance of shrimp farming in Bangladesh.

Responsibility
Give and take: Aquaculture in a future of rising sea levels
With rising sea levels inevitable, aquaculture faces existential uncertainties and confronts its own contributions to the problem.