How commercial probiotics impact the production and health of Pacific white shrimp postlarvae
Trial results showed improved production and survival to AHPND challenge
This article presents the results of research carried out at the ShrimpVet Hatchery in Ninh Thuan Province, Vietnam. The purpose of this trial was to assess the effectiveness of the application of a treatment protocol involving two commercial probiotics (BiOWiSH® AquaFarm and BiOWiSH® MultiBio 3PS) in the hatchery production of Pacific white shrimp (Litopenaeus vannamei) postlarvae (PL), compared to a PL production protocol that relies on water exchange only to control inorganic nitrogen, waste organics and pathogens.
Experimental setup
In the trial, there were two treatments with three replicate tanks for each treatment. Treatment 1 (T1) was the control and involved following the established hatchery biosecurity practices without any type of probiotics. Water exchange was performed to maintain water quality in the larval rearing tanks, at a daily exchange rate of 15 to 20 percent of treated seawater. The hatchery biosecurity included water treatment, hatchery disinfection, personnel sanitation and disinfection of live and fresh feeds.
Treatment 2 (T2) used two commercial probiotics: BiOWiSH® AquaFarm was used to control inorganic nitrogen and to inhibit Vibrio in the water column, and BiOWiSH® MultiBio 3PS was applied to the feed to improve gut health. The water exchange protocol in T2 was identical to T1, and the only difference between the treatments was the application of the probiotics in T2.
The L. vannamei nauplii used in the trial were provided by ShrimpVet, previously screened for various shrimp diseases including White Spot Syndrome Virus (WSSV), Taura Syndrome Virus (TSV), Infectious Myonecrosis Virus (IMNV), Acute Hepatopancreatic Necrosis Disease (AHPND), and Enterocytozoon hepatopenaei (EHP) using polymerase chain reaction (PCR) techniques.

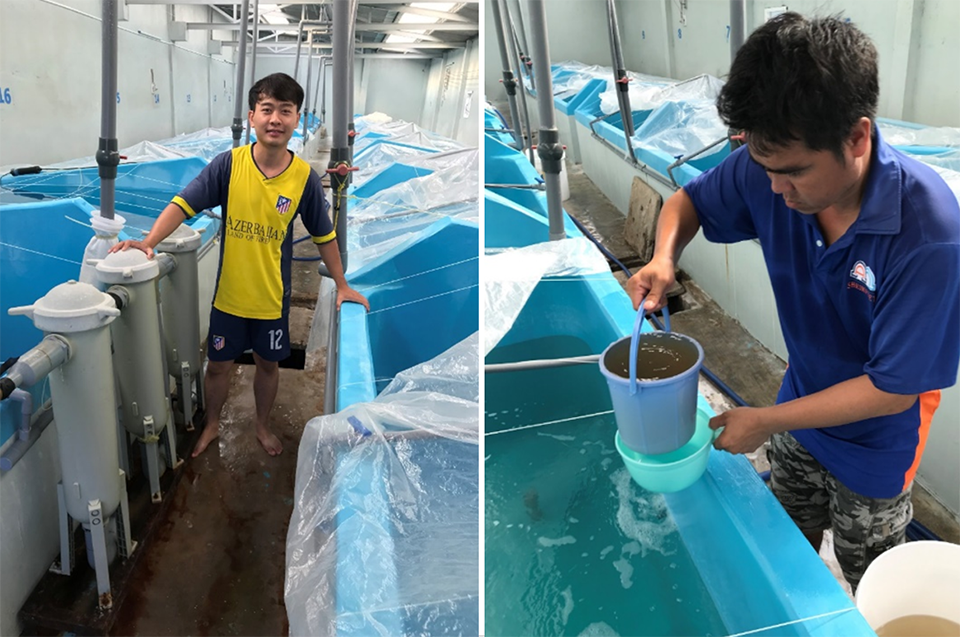
Six (2.25 x 2.25 x 1.58 meters = 8 cubic meters each) concrete tanks were first filled with 4.5 cubic meters of water and stocked with 450,000 nauplii 5 (N5) were stocked per tank, with all tanks stocked from the same source. The tanks were then topped off to 7 cubic meters as algae were added, were randomly selected for both treatments, and used the same source of seawater. The initial salinity was 30 PPT, which was gradually reduced to 15 ppt before harvest. Water exchange and tank siphoning were identical for both treatments.
The seawater used in the tanks was filtered through sand filters and mesh bag filters (1.0 μm) before being pumped into a reservoir pond for primary disinfection by chlorination (30 ppm sodium hypochlorite for 24 hours). After chlorination and particulate settling the water was filtered through a filter cartridge (0.5 μm), then disinfected using ultraviolet light (UV), and pumped to the treated seawater reservoir. Before using the seawater, the residual chlorine was checked: If chlorine was still present, sodium thiosulfate was applied, at a ratio of 1 ppm of thiosulfate for each ppm of residual chlorine.
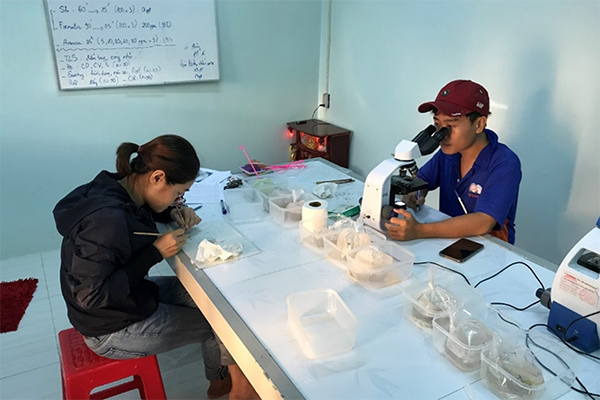
Water quality parameters including temperature, dissolved oxygen (D.O.), pH, salinity, total ammonia nitrogen (TAN) and nitrite nitrogen (NO2-N) were maintained at optimal ranges for shrimp normal growth (Van Wyk et al., 1999). Water quality analysis equipment included, dissolved oxygen with an electronic meter, pH with a handheld sensor, salinity with a refractometer, total ammonia nitrogen and nitrite nitrogen with colorimetric test kits. Water samples were collected for bacterial analysis on tryptone soy agar (TSA), plate count agar (PCA), and thiosulfate citrate bile salts sucrose agar (TCBS).
In T2, the AquaFarm probiotic was applied to the water every day. One gram of fermented product per cubic meter of tank volume was applied from Nauplii to Zoea3 (Z3). Because accumulated feed produces both ammonia and nutrients available for Vibrio, 2 grams of fermented product per cubic meter tank volume were applied from the mysis1 (M1) to the postlarvae10 (PL10) stages.
For the procedure to ferment the BiOWiSH® AquaFarm probiotic, consult the corresponding author. Fermentation was carried out so that spores germinate to become vegetative cells and can immediately start acting when applied. A new batch was started every day for use the following day.
Live microalgae (Thalassiosira pseudonana) and live artemia nauplii were produced at the hatchery under biosecure conditions. Artemia were sterilized with formic acid before feeding.
Microalgae was offered to the larvae from the last nauplii stages, so that upon metamorphosis to the first feeding stage (Zoea1-2, Z1-2), the larvae were able to begin feeding immediately. The targeted algae concentration was 5,000 to 10,000 cells per mL. Consumed algae was replaced daily.
In T2 for each 100 grams of artificial feed, 7 grams of BiOWiSH® MultiBio 3PS were applied to the feed (7 percent); the amount of feed used was identical for each treatment.
All prepared feeds were kept in properly-identified air-tight containers, set in room temperature (~ 22 to 25 degrees-C) until use. For the zoea3 (Z3) larval stage 10–80 μm particle size artificial feed and live Artemia nauplii were fed at up to eight times per 24-hour period, to satiation. For mysis stages, artificial feed of 50–150 μm-sized particles and artemia were fed in the same manner.
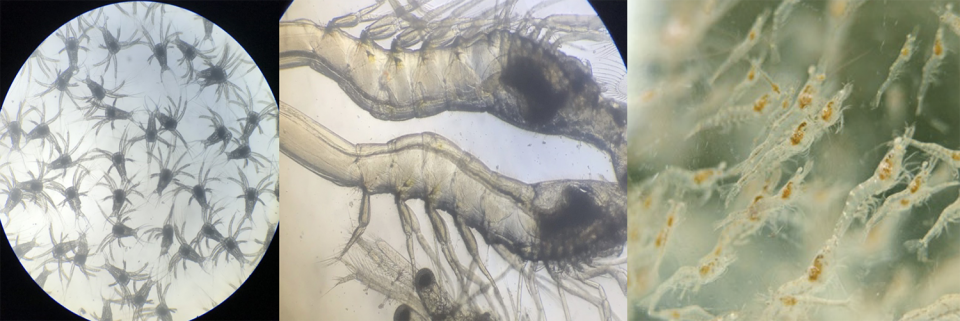
Postlarvae were fed artificial diets having 200–300 μm sized particle size for PL1-8, and 300–500 μm particle size from PL9-10. Feed was applied often in small quantities, once every three hours (eight times per day) over each 24-hour period. The postlarvae were harvested when they reached PL10 on day 17, and samples collected for analysis of PL health per FAO Fisheries Technical Paper No. 450 (2003).
Upon termination of the hatchery trial, a group of shrimp from the six hatchery tanks was transferred to a challenge facility and subjected to a challenge trial against Acute Hepatopancreatic Necrosis Disease (AHPND).
Results and discussion
Water quality parameters monitored during the trial were within acceptable levels for L. vannamei culture. For the T1 (control) group, mean values (and range) were as follows: water temperature 30.4 degrees-C (29.8–33 degrees-C); dissolved oxygen 6.5 mg/L (6.2–7.1 mg/L); pH 8.0 (7.9–8.1); total ammonia nitrogen, TAN 1.8 mg/L (0.0–2.0 mg/L); and nitrite 0.0 mg/L.
For the T2 BiOWiSH group: temperature 30.3 degrees-C (29.8–33.4 degrees-C); dissolved oxygen 6.7 mg/L (6.1–7.0 mg/L); pH 8.0 (7.7–8.2); TAN 1.4 mg/L (0.0–2.0 mg/L); and nitrite 0.0 mg/L. It should be noted that mean TAN was 22.2 percent lower for the T2 BiOWiSH® treatment than for the T1 Control.
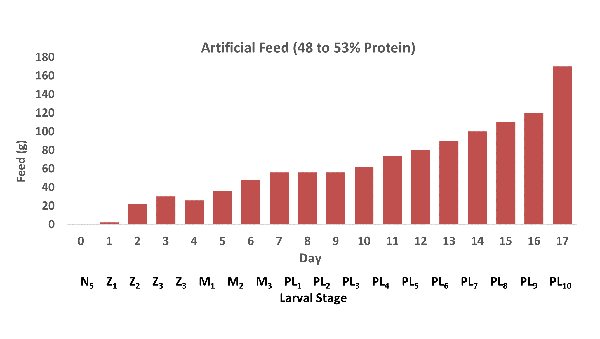
Fig. 1 shows the amount of feed applied to each tank on a daily basis for the developing larval stages, from nauplius 5 (N5) to postlarvae 10 (PL10). Larval stage is detailed below each day. Feed was continually increased during the trial, and approximately 20 percent water exchange was carried out daily from day 8 through day 17. The application of the probiotic Activated BiOWiSH® AquaFarm application was increased from 1 gram to 2 grams per cubic meter on day 5.
Regarding the bacterial analyses we carried out during the trial, Fig. 2 shows the results for both treatments on TSA and PCA agars. Bacterial counts on both agars were higher for T2 than for T1. Daily application of probiotics more than likely increased bacterial counts in T2. PCA counts may be lower than TSA counts because PCA agar was lacking nutrients required by fastidious bacteria. The considerable differences between treatments on PCA agar implies each had a distinct bacterial population.
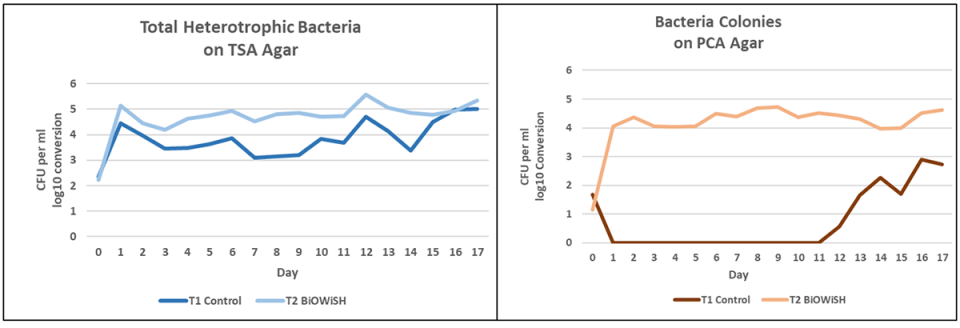
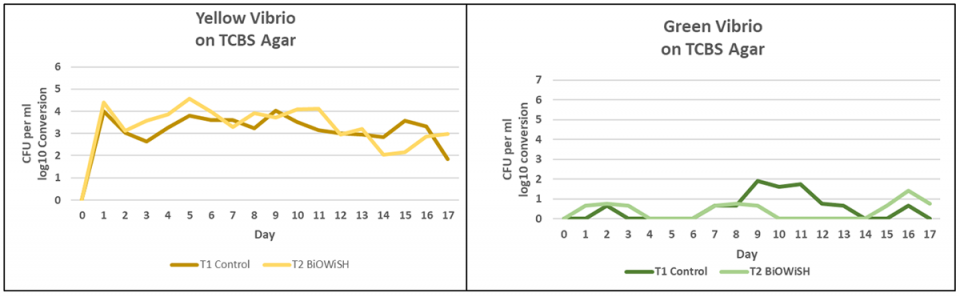
Fig. 3 shows yellow and green Vibrio counts for both treatments. Yellow Vibrio counts are similar. In general, yellow Vibrio are not pathogenic. Green Vibrio counts are greater in T1 than T2. Many green vibrios can be pathogenic.
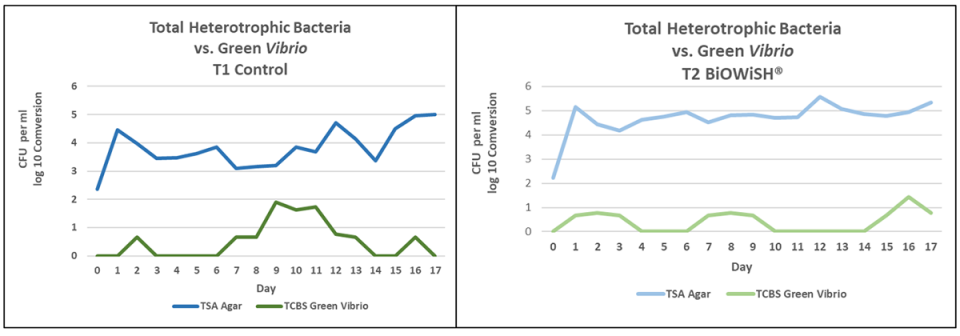
The graphs in Fig. 4 compare total heterotrophic bacteria counts to green Vibrio counts. In T1 there is about a 2-log difference between total heterotrophic bacteria and green Vibrio. For several days there was only a 1-log difference. In T2 there is about a 3-log difference between total heterotrophic bacteria and green Vibrio for most of the trial. This implies green Vibrio were inhibited by heterotrophic bacteria in T2.
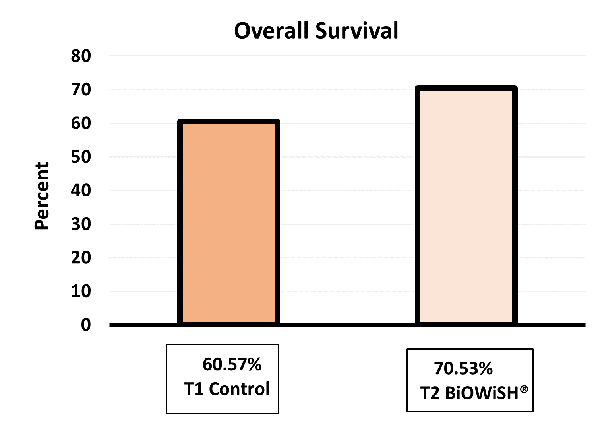
During hatchery production, the survival for treatment 1 was 60.57 percent, while survival for treatment 2 was 70.53 percent. Based on current hatchery production, this survival increase would be equivalent to an additional 148 million PLs per year.
Crockett, probiotics, Table 1
| Health Category | Scoring T1 (control) | Scoring (T2 BiOWISH) |
|---|---|---|
| Lipid Vacuole Count | 4.44 | 6.81 |
| Intestinal Content | 3.72 | 6.34 |
| Hepatopancreas Color | 4.94 | 7.5 |
| Muscle to Gut Ratio | 4.22 | 7.33 |
| Hepatopancreas Condition | 5.17 | 7.4 |
| Size Variation | 10 | 10 |
| Total Score | 32.49 | 45.38 |
When the hatchery tanks were harvested, postlarval health was evaluated with a sample of 30 PLs scored per tank for various health categories. Scoring ranged from 0 to 10 (higher value better), and results are shown in Table 1. Treatment 2 scored higher in every category except size variation, which was identical for both treatments. Improved health in treatment 2 could probably be attributed to increased survival.
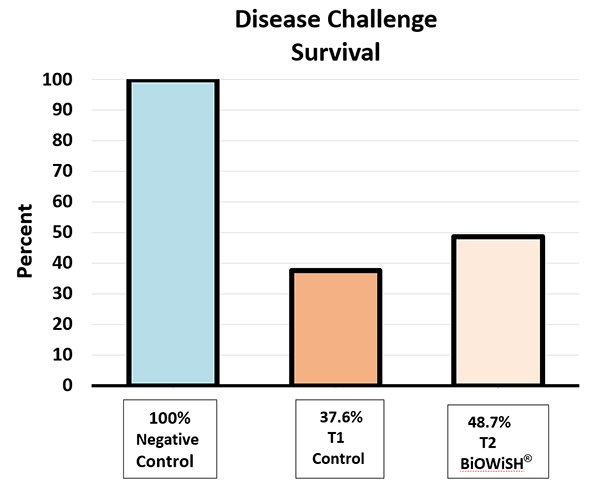
The AHPND disease challenge trial was carried out at the ShrimpVet laboratory in Ho Chi Minh City, Vietnam. The postlarvae were challenged in 8-liter tanks with zero water exchange over a 14-day period, and results are presented in Fig. 6. Negative control survival was 100 percent, indicating conditions in the challenge tanks, other than the presence of Vibrio parahaemolyticus, were not causing mortality. T1 survival was 37.6 percent as compared to T2 survival of 48.7 percent. Improved health probably influenced disease resistance.
Conclusions
Health analysis scoring was 39.7 percent higher in T2. The AHPND disease challenge survival was 29.6 percent greater for T2, indicating increased disease resistance. Overall shrimp survival was 16.4 percent greater in T2. These results indicate that the BiOWiSH® probiotics used in this trial increased shrimp hatchery production and improved the quality and disease resistance of postlarvae, much the same as has already been observed in shrimp and fish nursery and grow-out systems.
References are available from the corresponding author.
Now that you've reached the end of the article ...
… please consider supporting GSA’s mission to advance responsible seafood practices through education, advocacy and third-party assurances. The Advocate aims to document the evolution of responsible seafood practices and share the expansive knowledge of our vast network of contributors.
By becoming a Global Seafood Alliance member, you’re ensuring that all of the pre-competitive work we do through member benefits, resources and events can continue. Individual membership costs just $50 a year.
Not a GSA member? Join us.
Authors
-

Corresponding author
BiOWISH Technologies Inc.
Cincinnati, Ohio 45208 USA -
ShrimpVet Laboratory
Nong Lam University, Thu Duc City, HCMC Vietnam -
BiOWISH Technologies Inc.
Cincinnati, Ohio 45208 USA -
BiOWISH Technologies Inc.
Cincinnati, Ohio 45208 USA -
BiOWISH Technologies Inc.
Cincinnati, Ohio 45208 USA
Related Posts
Responsibility
Aquaculture and the microbial world
Microorganisms reside in the sediment and other substrates, and in the water of aquaculture facilities, as well as in and on the cultured animals.
Health & Welfare
Do probiotics work in aquaculture?
Probiotics administered in feeds provide competitive exclusion of pathogenic bacteria, create conditions unfavorable for pathogens and modulate intestinal immune responses.
Aquafeeds
Functional ingredients driving shrimp feed innovation
Functional ingredients and additives promote growth, improve health of farmed shrimp, and bolster immune response and other physiological needs.
Aquafeeds
Is a ‘baby food’ bottleneck looming for aquaculture?
Global aquaculture, particularly farmed shrimp, depends on artemia for hatchery feeds. Supplies meet current needs, but growth will require alternatives.