Green water meal has potential as aquafeed ingredient
Current research looking at nutritional value and use in shrimp diets
Microalgae – also known as phytoplankton – represent the largest group of photosynthetic microorganisms on earth. These simple, unicellular organisms can potentially yield large amounts of biomass within a short time, year-round.
In recent decades, microalgae have received much attention because of their fast growth rates, photosynthetic efficiency and higher biomass produced when compared to terrestrial crops. In the aquaculture industry, microalgae production is done under intensive or extensive monoculture, and various microalgae are commonly used as starter or grow-out feeds for shrimp, fish and bivalves. They can also be used to enrich other larval feeds like rotifers or artemia.
In addition to providing food for aquacultured organisms, microalgae also help improve the water quality. Introduction of microalgae into rearing tanks of a variety of freshwater and seawater animals – known as “green water systems” – typically result in improved survival rates and growth performance when compared to more traditional “clear water” systems. This is likely due to the water quality enhancement through higher oxygen production and more stable pH in the culture environment. Microalgae are also used as formulated aquafeed ingredients, as a source of protein or lipids, to improve animal growth and survival, to enhance pigmentation and also to reduce culture time.
Production of green water meal and its nutritional value
Production of green water in tilapia culture tanks is carried out continuously at our hatchery in the Borneo Marine Research Institute (Universiti Malaysia Sabah, Malaysia) as part of the facility’s culture of freshwater fish such as tilapia and catfish. Here we summarize results of a study (Journal of Applied Phycology; doi:10.1007/s10811-014-0383-6) of production of green water, the nutritional value of the microalgae and the meal produced, and an experiment to replace fishmeal in diets for Pacific white shrimp (Litopenaeus vannamei).
![Ad for [membership]](https://www.globalseafood.org/wp-content/uploads/2025/07/membership_web2025_1050x125.gif)
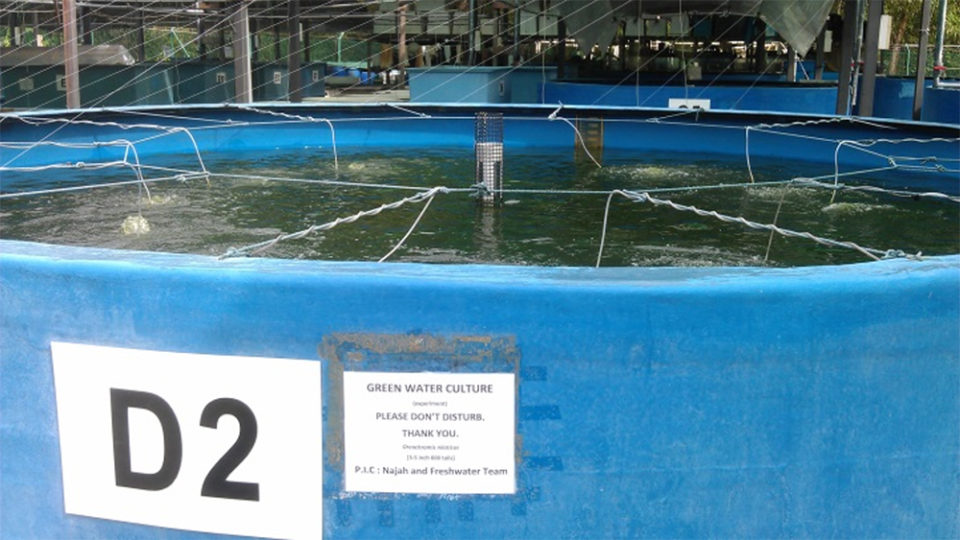
A starter stock was prepared using about 1,000 liters of green water from another tilapia culture tank culture and 14,000 liters of freshwater, transferred to a production tank (20,000-L capacity). This 15,000-liter green water starter stock contained approximately 250,000 cells/mL of phytoplankton. Seven-hundred red tilapia (Oreochromis sp.) juveniles were stocked in the production tank and fed a commercial tilapia pellet (32 percent crude protein and 4 percent crude lipid, from Cargill, Malaysia) twice daily at 1 percent of their body mass to support a long and continuous culture period and produce a high density of microalgae in the tank.
Bloomed microalgae from the tank were harvested by pump and filtration, harvesting only particles in the sizer range of 0.1 to 60 μm, which were used as the green water meal. The green water was harvested at its mid to late-logarithmic growth phase, based on the microalgae cell density.
At each harvest, about 10 percent (1,500 liters) of the green water volume in the tank was pumped out through the filter, which produced approximately 20 to 30 liters of concentrated green water. The harvest frequency was dependent on the microalgae cell density in the culture tank. For example, the green water was harvested only once a week in the heavy raining season, but in most cases, it could be harvested twice per week. The concentrated green water was stored in a cold room (minus-5 degrees-C) for about 3 to 4 days to allow it to sediment, and then the supernatant (about 70 percent) was eliminated and the microalgae biomass was collected and spray-dried.
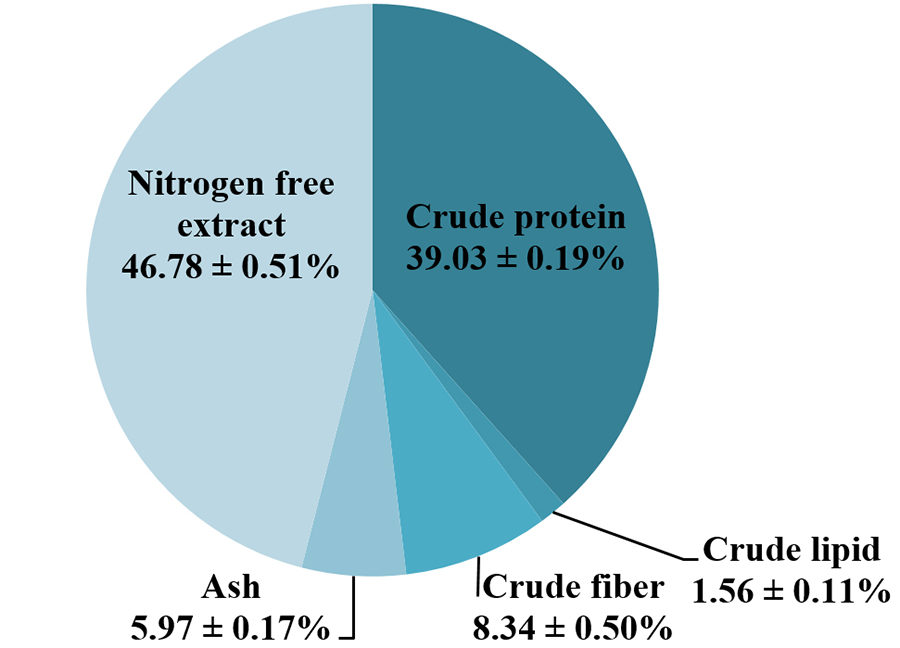
The green water meal produced in our facilities contained 99.76 ± 0.05 percent dry matter, 39.03 ± 0.19 percent crude protein, 1.56 ± 0.11 percent crude lipid, 8.34 ± 0.50 percent crude fiber and 5.97 ± 0.17 percent ash. In general, the green water meal produced in tilapia culture tanks is characterized by high protein, low lipid and moderate fiber and ash contents.
The nutritional value of microalgae may vary significantly in particular species, depending on the culture conditions. The phytonutrients of the microalgae produced included particular types of polyunsaturated fatty acids (PUFAs) such as eicosapentaenoic acid (EPA), arachidonic acid (AA) and docosahexaenoic acid (DHA). Typically, microalgae harvested in the late-logarithmic growth phase contain 30 to 40 percent protein, 10 to 20 percent lipids and 5 to 15 percent carbohydrates, but these values may differ significantly when cultivated at different phase. In general, most microalgal species contain moderate to high percentage of EPA (7 to 34 percent). Pavlova spp., Isochrysis sp. and other cryptomonads are mostly rich in DHA (0.2 to 11 percent), whereas Nannochloropsis spp. and diatoms have the highest percentages of AA (up to 4 percent).
Several species of microalgae can be found in green water systems, mostly from the Chlorophyta division. Because Chlorophyte microalgae typically lack PUFAs, they are considered unsuitable as single species for use in aquaculture diets. Instead, a mixture of microalgae species should be given to the cultured organisms to provide better nutritional value and thus effectively improve the growth performance. The gross chemical composition of some common microalgae species used in aquaculture industry is listed in Table 1.
Shapawi, Green water meal, Table 1
| Microalgae species | % dry matter: M | % dry matter: CP | % dry matter: CL | % dry matter: CF | % dry matter: Ash | % dry matter: NFE | R |
|---|---|---|---|---|---|---|---|
| Chaetoceros calcitrans | – | 36.4 | 15.5 | – | 14 | – | A |
| Chlorella sp. | – | 30.7 | 17.9 | – | 7.9 | – | B |
| Chlorella spp. | 5.99 | 46.78 | 14.83 | 8.32 | 18.75 | 11.32 | C |
| Chlorella vulgaris | – | 55.0 | 10.2 | 5.8 | 5.8 | 23.2 | D |
| Chlorella vulgaris | 3.6 | 52.8 | 8.1 | 20.8 | 9.13 | 5.57 | E |
| Chlorella vulgaris | – | 38 | 5 | – | – | – | F |
| Cladophora glomerata | 1.6 | 31.6 | 5.2 | 11.2 | 23.6 | 28.4 | G |
| Dunaliella salina | – | 40.3 | 28.1 | – | 9.0 | – | B |
| Dunaliella salina | – | 40.21 | 18.02 | 2.1 | 15.89 | – | H |
| Hydrodictyon reticulatum | 5.7 | 27.7 | 1.9 | 14.9 | 32.6 | 22.9 | I |
| Isochrysis galbana | – | 47.9 | 14.5 | – | 6.0 | – | A |
| Nannochloropsis oculata | – | 52.6 | 25.7 | 8.0 | 7.7 | 6.0 | D |
| Scenedesmus spp. | 4.8 | 51.7 | 12.29 | 6.91 | 19.63 | 10 | C |
| Skeletonema sp. | – | 37.0 | 20.0 | – | 9.4 | – | J |
| Spirulina maxima | 10.2 | 73.7 | 0.7 | 2.1 | 10.5 | 13.0 | K |
| Spirulina sp. | 3-6 | 60.0 | 5.0 | 7.0 | 7.0 | 21.0 | L |
M= moisture, CP= crude protein, CL= crude lipid, CF= crude fiber, NFE= nitrogen free extract (100-CP-CL-CF-Ash), R= references (available from first author).
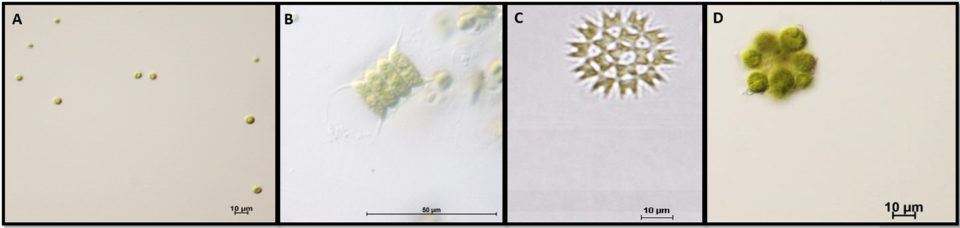
The microalgae species identified in our green water system include Chlorella sp., Scenedesmus sp., Pediastrum sp. and Coelastrum sp. The proportion of microalgae species in the green water is not constant and can vary slightly between days of production. However, Chlorella sp. was the dominant microalgae species found in our green water production system.
Fishmeal replacement for Pacific white shrimp
We carried out an experiment with various levels of inclusion of green water meal as fishmeal replacement in experimental diets for Pacific white shrimp. Table 2 shows the growth performance of shrimp fed the experimental diets. The weight gain was significantly influenced by the inclusion level of green water meal in the diets.
In general, shrimp growth decreased with increasing level of green water meal substitution. The control diet (GWM0) resulted in the highest weight gain (292.56 ± 25.63 percent), followed by GWM10 (247.22 ± 11.97 percent), GWM20 (212.82 ± 12.69 percent), GWM30 (186.16 ± 10.04 percent), and GWM40 (112.51 ± 11.09 percent). Unlike weight gain, the specific weight gain (SGR) of GWM10 was not significantly different from the control diet. However, other diets yielded significantly lower SGR than the control diet. Except for GWM40, the dry feed intake of GWM-based diets was not significantly different from the control diet.
Shapawi, Green water meal, Table 2
| Diets | Initial weight (g) | Final weight (g) | Weight gain (%) | SGR (%/day) |
|---|---|---|---|---|
| GWM0 | 1.74 ± 0.01a | 6.81 ± 0.25d | 292.56 ± 14.80d | 3.03 ± 0.06d |
| GWM10 | 1.73 ± 0.03a | 5.99 ± 0.21c | 247.22 ± 6.91c | 2.75 ± 0.08cd |
| GWM20 | 1.72 ± 0.02a | 5.37 ± 0.12bc | 212.82 ± 7.33bc | 2.47 ± 0.02bc |
| GWM30 | 1.73 ± 0.01a | 4.93 ± 0.07b | 186.16 ± 5.8b | 2.31 ± 0.03b |
| GWM40 | 1.73 ± 0.01a | 3.69 ± 0.10a | 112.51 ± 6.4a | 1.67 ± 0.08a |
Table 3 shows the feed utilization of shrimp fed the experimental diets. Feed conversion ratio (FCR) followed the SGR trend where FCR of GWM10 (1.87) was not significantly different from the control diet (1.59). Meanwhile, FCR values in other diets were above 2.1, and these values were significantly poorer than the FCR of the control diet. Protein efficiency ratio (PER) and apparent net protein utilization (ANPU) were ranged from 0.63 to 1.51 and 10.60 to 24.51, respectively. The values of PER and ANPU decreased as the inclusion of green water meal in the diets increased. The survival rate of the shrimp fed with experimental diet was above 95 percent.
Shapawi, Green water meal, Table 3
| Diets | DFI (g/shrimp) | FCR | PER | ANPU (%) |
|---|---|---|---|---|
| GWM0 | 8.05 ± 0.09b | 1.59 ± 0.06a | 1.51 ± 0.06d | 24.51 ± 1.15d |
| GWM10 | 7.92 ± 0.12ab | 1.87 ± 0.10ab | 1.30 ± 0.07cd | 23.29 ± 1.15cd |
| GWM20 | 7.98 ± 0.19ab | 2.19 ± 0.06b | 1.10 ± 0.03bc | 19.66 ± 0.62c |
| GWM30 | 7.68 ± 0.04ab | 2.40 ± 0.05b | 1.00 ± 0.02b | 15.55 ± 0.34b |
| GWM40 | 7.44 ± 0.13a | 3.82 ± 0.22c | 0.63 ± 0.04a | 10.60 ± 0.66a |
Mean values with different superscript within a column are significantly different (p<0.05).
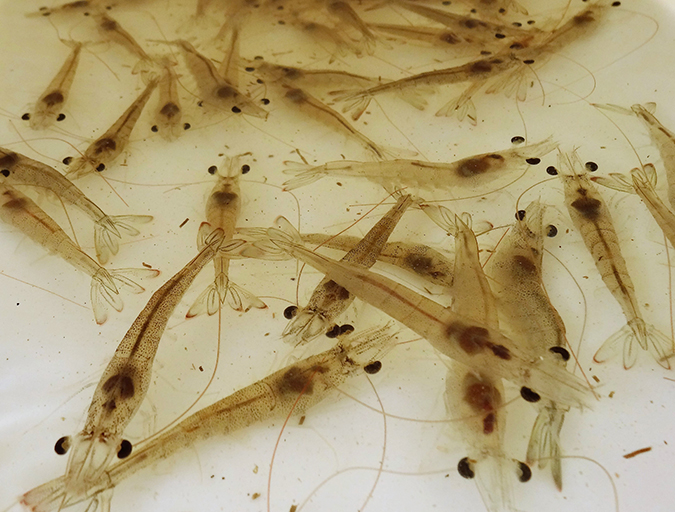
A distinct difference in intense red/orange coloration of the shrimps fed with the experimental diets is shown in Fig. 2.
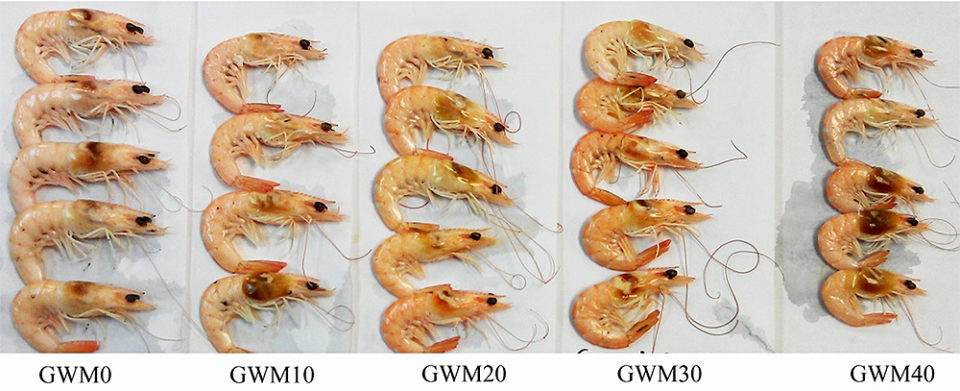
Shrimp fed with GWM-based diets appeared to be redder/more orange when compared to the control diet. This is supported by the significantly higher (p<0.05) carotenoid concentrations in GWM-based diets than in the control diet (GWM0), as shown in Fig. 3.
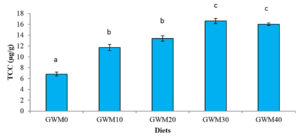
Shrimp fed with GWM0 diet only contents 6.81 ± 0.36 µg/g of total carotenoid concentration. While shrimp fed with the GWM30 diet contains the highest total carotenoid concentration (16.60 ± 0.48 µg/g). Feeding shrimp with GWM-based diets increased the carotenoid contents of the shrimp by about 72 percent (GWM10), or 11.71 – 16.6 µg/g in GWM-based diets compared to 6.81µg/g in the control diet.
Perspectives
Green water production systems provide food for aquacultured organisms and also improve overall water quality. Microalgae from these systems can be used to produce green water meal, an aquafeed ingredient that has shown potential in experiments to partially replace fishmeal in practical diets for Pacific white shrimp, and also to enhance desirable shrimp pigmentation.
References available from the first author.
Now that you've reached the end of the article ...
… please consider supporting GSA’s mission to advance responsible seafood practices through education, advocacy and third-party assurances. The Advocate aims to document the evolution of responsible seafood practices and share the expansive knowledge of our vast network of contributors.
By becoming a Global Seafood Alliance member, you’re ensuring that all of the pre-competitive work we do through member benefits, resources and events can continue. Individual membership costs just $50 a year.
Not a GSA member? Join us.
Authors
-

Director
Borneo Marine Research Institute
Universiti Malaysia Sabah
Jalan UMS, 88400 Kota Kinabalu, Sabah, Malaysia -
Research Officer
Borneo Marine Research Institute
Universiti Malaysia Sabah
Jalan UMS, 88400 Kota Kinabalu, Sabah, Malaysia -
Assoc. Professor
Borneo Marine Research Institute
Universiti Malaysia Sabah
Jalan UMS, 88400 Kota Kinabalu, Sabah, Malaysia
Related Posts
Aquafeeds
A look at phospholipids in aquafeeds
Phospholipids are the major constituents of cell membranes and are vital to the normal function of every cell and organ. The inclusion of phospholipids in aquafeeds ensures increased growth, better survival and stress resistance, and prevention of skeletal deformities of larval and juvenile stages of fish and shellfish species.
Aquafeeds
Biofloc consumption by Pacific white shrimp postlarvae
The stable isotopes technique with δ13C and δ15N can be used to determine the relevance of different food sources to shrimp feeding during the pre-nursery phase of Litopenaeus vannamei culture. During this trial, different types of commercial feed, microalgae, Artemia sp. nauplii and bioflocs were used as food sources.
Health & Welfare
Effect of dietary methionine on Pacific white shrimp juveniles
This study tested five diets formulated with increasing levels of methionine (Met) and Met + cysteine (Cys) and their effect on growth performance of juvenile Pacific white shrimp stocked at 50, 75 or 100 animals/m2 in a green water system.
Aquafeeds
Analyzing the hydrostability of shrimp feeds
The physical integrity and nutrient leaching of shrimp aquafeeds are important aspects in their quality control. The water stability of shrimp aquafeeds is often evaluated in various subjective manners. This analytical procedure provides a baseline for the aquafeed manufacturer to assess product quality.