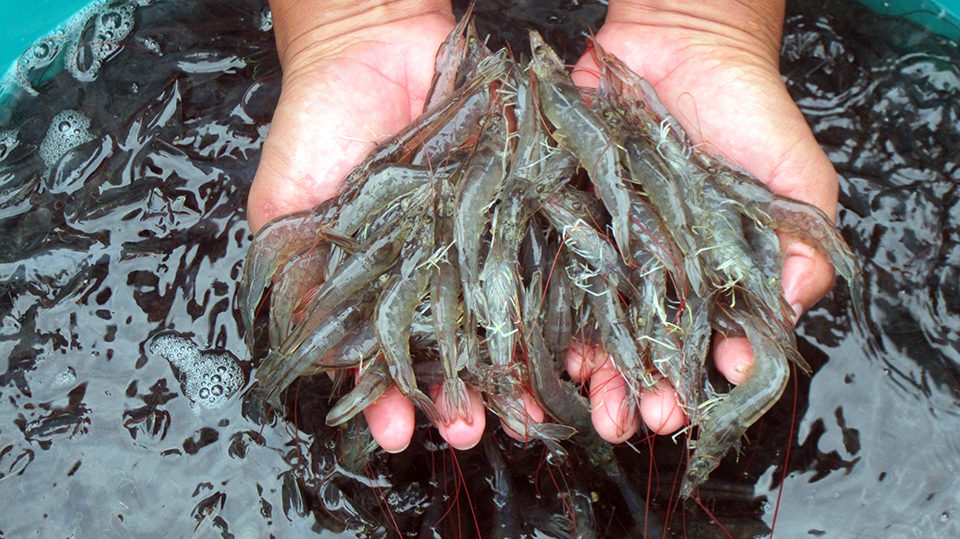
Genetic markers help track soy protein utilization in shrimp
Pacific white shrimp families prefer either high levels of dietary soybean meal or dietary soy
Annual global fishmeal production has been relatively stable at around 5 mmt for several decades, but aquaculture has grown rapidly over the same period. While aquaculture only consumed 32 percent of the global fishmeal supply in 1999, consumption increased to 73 percent in 2010. Crustacean feeds alone consumed 21 percent of the global fishmeal supply in 2010. Continued use of high levels of fishmeal in crustacean feeds is not sustainable.
Research with rainbow trout by geneticist Kenneth Overturf in 2013 showed that genetic variations exist for utilization of plant protein. A strain of rainbow trout developed by the United States Department of Agriculture’s Agricultural Research Service for improved utilization of plant-based diets was compared to two other strains of trout. The selected strain outgrew the other two strains on plant-based feed and was found to grow better on the plant-based feed than on fishmeal feed.
In recent research sponsored by the Soy Aquaculture Alliance, the authors discovered genetic markers for the identification of shrimp with enhanced capability to convert soy protein when fed a ration that contains little or no fishmeal and high levels of dietary soybean meal.
Methods
At Integrated Aquaculture International in Hawaii, USA, 20 full-sib families were produced from broodstock maintained in the IAI breeding program. From fertilization through hatching, each family was kept in an individual 40-liter (L) aquarium. After hatching and until the families reached the P.L.10 stage, approximately 21 days post-spawning, they were maintained in individual 100-L tanks. At P.L.10, 500 postlarvae from each family were divided between two, 700-L round fiberglass tanks with automatic feeders and self-cleaning bottoms.
![Ad for [Aquademia]](https://www.globalseafood.org/wp-content/uploads/2025/07/aquademia_web2025_1050x125.gif)
From stocking to a weight of 1 gram, the shrimp were fed a standard fishmeal-based diet at a rate approximately equal to 7 percent of the biomass. When that average weight was reached, all animals were marked with colored elastomer tags on their abdomens to differentiate families and redistributed with four animals from every family in each tank, making 80 animals/tank. This experimental design allocated 20 replicates for each diet and 20 replicates for each family to enable discrimination of family differences in growth rate between diets.
A fishmeal-based control diet was fed in 20 tanks, and a soy protein diet was given to shrimp in the other 20 tanks (Table 1). The diets were formulated to contain approximately 38 percent crude protein and 7 percent fat. Soybean meal and other plant proteins were the primary replacements for fishmeal. The fishmeal diet contained approximately 20 percent fishmeal, a common inclusion level currently found in commercial shrimp feeds. The fishmeal diet also contained soybean meal and wheat. The high-soy diet substituted all of the fishmeal with soybean meal and other plant ingredients.
Towner, Composition of experimental diets, Table 1
| Ingredient | Fishmeal Diet (%) | High-Soy Diet (%) |
|---|---|---|
| Fishmeal, Peruvian sardine | 20.05 | – |
| Soybean meal, 48% | 35.00 | 64.44 |
| Wheat | 36.89 | 23.00 |
| Krill meal | 3.00 | 5.16 |
| Lecithin | 1.29 | 1.87 |
| Monocalcium phosphate | 1.05 | 1.64 |
| Vitamin/mineral premix | 0.25 | 0.25 |
| Fish oil | 2.41 | 3.30 |
| Cholesterol | 0.06 | 0.13 |
| D.L.-methionine | – | 0.10 |
| L-lysine | – | 0.10 |
| Proximate Composition Dry matter | 91.00 | 91.00 |
| Crude protein | 37.50 | 37.50 |
| Crude fat | 7.00 | 7.00 |
| Ash | 8.00 | 6.20 |
| Crude fiber | 2.20 | 2.84 |
| Nutrient Composition Arginine | 2.30 | 2.40 |
| Lysine | 2.30 | 2.30 |
| Methionine + cystine | 1.40 | 1.40 |
| Threonine | 1.37 | 1.33 |
| Total phosphorus | 1.12 | 1.02 |
| Eicosapentaenoic acid | 0.42 | 0.41 |
| Docosahexaenoic acid | 0.46 | 0.44 |
| Cholesterol | 0.15 | 0.15 |
| Phospholipids | 1.50 | 1.50 |
After eight weeks, each animal was individually weighed and its sex was recorded. The families were ranked according to their growth rates on each diet. In addition, tissue samples were taken for DNA analysis from the six largest males, six largest females, six smallest males and six smallest females from the five fastest-growing families and five slowest-growing families fed the soy protein diet.
Feeding trial
Immediately following the first phase of the study, animals from the five top-performing families were combined into 4 tanks/family on the fishmeal control diet and 4 tanks/family on the soy protein diet. A six-week feeding trial was conducted to determine the performance of the families fed either the fishmeal or high-soy diets.
Performance, feed conversion and survival were analyzed for differences among diets, families and tanks within families, with family and diet as main factors and initial weight as covariate. The objective was to identify single nucleotide polymorphisms (SNPs) that showed a large positive or negative correlation with the growth rate of shrimp fed a high-soy-protein diet.
The results of the data collected will determine the feasibility of using a traditional selection program or a marker-assisted selection program to improve the utilization of soy protein in a strain of L. vannamei shrimp.
Results
The data from phase 1 indicated that both family and diet significantly affected the performance of shrimp. In general, shrimp fed the high-soy diet outperformed shrimp fed the fishmeal diet (Table 2), suggesting a high tolerance for high inclusion levels (approximately 60 percent of the diet) of soybean meal in the families of Pacific white shrimp evaluated.
Towner, Performance across 20 families of Pacific white shrimp, Table 2
| Response | Fishmeal Diet | High-Soy Diet |
|---|---|---|
| Survival (%) | 93.50 ± 0.80 | 95.10 ± 1.02 |
| Initial weight (g) | 1.03 ± 0.02 | 1.02 ± 0.02 |
| Final weight (g) | 11.94 ± 0.21 | 14.89 ± 0.28** |
| Weight gain (g) | 10.91 ± 0.20 | 13.86 ± 0.27** |
| Weight gain (%) | 1,065.50 ± 20.4 | 1,355.90 ± 23.50** |
| Growth rate (g/week) | 1.36 ± 0.02 | 1.73 ± 0.03** |
| Feed-conversion ratio | 1.29 ± 0.02 | 1.22 ± 0.02* |
Table 2. Performance across 20 families of Pacific white shrimp fed diets based on fishmeal or soymeal for eight weeks in the first phase of the study.
There were also differences in final weights among different families fed the high-soy diet, indicating that some families were more capable of utilizing and tolerating soybean meal than others. The average animal weight within families ranged 11.9 to 15.3 grams (Table 3), and there was a highly significant diet x family interaction. This was due to families changing rank in growth response when fed the fishmeal and high-soy diets. Some families had the ability to grow better on the soy diet than on the fishmeal diet, while other families grew better on the fishmeal diet. However, the three fastest-growing families performed well on both the fishmeal and high-soy diets (Table 4).
Towner, Average final weights across 20 families of Pacific white shrimp, Table 3
| Family | Fishmeal Diet (g) | High-Soy Diet (g) | Average (g) |
|---|---|---|---|
| 1 | 11.07 | 14.62 | 12.84 |
| 2 | 10.81 | 14.48 | 12.65 |
| 3 | 10.42 | 13.30 | 11.86 |
| 4 | 10.97 | 14.36 | 12.66 |
| 5 | 11.66 | 15.18 | 13.42 |
| 6 | 12.04 | 14.09 | 13.07 |
| 7 | 13.15 | 15.43 | 14.29 |
| 8 | 12.57 | 15.17 | 13.87 |
| 9 | 11.75 | 13.63 | 12.69 |
| 10 | 11.27 | 15.14 | 13.20 |
| 11 | 12.04 | 14.76 | 13.40 |
| 12 | 12.25 | 14.39 | 13.32 |
| 13 | 11.93 | 16.32 | 14.13 |
| 14 | 12.42 | 15.30 | 13.86 |
| 15 | 13.69 | 16.97 | 15.33 |
| 16 | 12.29 | 15.59 | 13.94 |
| 17 | 12.62 | 15.60 | 14.11 |
| 18 | 12.35 | 14.77 | 13.56 |
| 19 | 12.51 | 14.64 | 13.58 |
| 20 | 11.70 | 14.31 | 13.00 |
Towner, Mean performance of the five top-performing families from phase 1, Table 4
| Family | High-Soy Diet Weight Gain (g) | High-Soy Diet Growth Rate (g/week) | Fishmeal Diet Weight Gain (g) | Fishmeal Diet Growth Rate (g/week) |
|---|---|---|---|---|
| 17 | 12.78 ± 0.60 | 2.13 ± 0.10 | 13.18 ± 0.58 | 2.20 ± 0.10 |
| 13 | 14.75 ± 0.99 | 2.46 ± 0.17 | 12.46 ± 0.71 | 2.08 ± 0.12 |
| 15 | 12.98 ± 1.28 | 2.16 ± 0.21 | 12.62 ± 1.20 | 2.10 ± 0.20 |
| 7 | 15.10 ± 0.70 | 2.52 ± 0.12 | 13.48 ± 1.02 | 2.25 ± 0.17 |
| 16 | 14.27 ± 0.47 | 2.38 ± 0.08 | 11.73 ± 0.91 | 1.96 ± 0.15 |
were detected among families (P < 0.05).
Perspectives
These findings indicated that Pacific white shrimp are capable of utilizing and tolerating relatively high levels of dietary soybean meal and that some families are more capable than others of utilizing higher levels of dietary soy.
Although these results need to be corroborated, they suggested that selection of families of shrimp with higher tolerance for soy could result in an increased use of soy and other plant proteins that could ultimately result in decreased dependence on fishmeal in dietary formulations for shrimp. Further work is needed to evaluate these findings in longer-term commercial production trials. There is also a need to assess the effects on gut morphology, immune function, flavor and texture of shrimp.
Fifty-three percent of the 5,405 SNPs discovered in this population had significant differences in allele frequency and genotype frequency between the fast- and slow-growing families. The dissimilarity in genotypic frequency of some of the SNPs was related to significant differences in weight between the fast- and slow-growing families. Considering the effects of two or more SNPs on weight simultaneously increases the accuracy of predicting weight from the SNP genotypes. The combined use of six SNPs to predict weight was equal in accuracy to traditional quantitative genetics methods. An additional study is needed to confirm the relationship between the important SNPs and weight in the next generation of L. vannamei.
(Editor’s Note: This article was originally published in the September/October 2014 print edition of the Global Aquaculture Advocate.)
Now that you've reached the end of the article ...
… please consider supporting GSA’s mission to advance responsible seafood practices through education, advocacy and third-party assurances. The Advocate aims to document the evolution of responsible seafood practices and share the expansive knowledge of our vast network of contributors.
By becoming a Global Seafood Alliance member, you’re ensuring that all of the pre-competitive work we do through member benefits, resources and events can continue. Individual membership costs just $50 a year.
Not a GSA member? Join us.
Authors
-

GenTec Consulting
Boise, Idaho, USA -
Integrated Aquaculture International
4111 Telegraph Road, Suite 302
St. Louis, Missouri 63129 USA -

Integrated Aquaculture International
-
Integrated Aquaculture International
Related Posts
Health & Welfare
Barcoding, nucleic acid sequencing are powerful resources for aquaculture
DNA barcoding and nucleic acid sequencing technologies are important tools to build and maintain an identification library of aquacultured and other aquatic species that is accessible online for the scientific, commercial and regulatory communities.
Responsibility
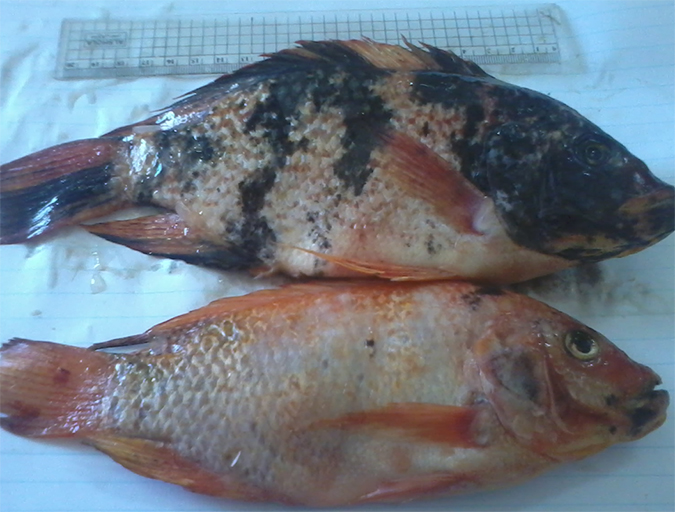
Genetic improvement aids red tilapia growth in Egypt
A new breeding program for genetic improvement of red tilapia was established at the Fish Research Center (FRC), Suez Canal University, in Ismailia, Egypt. It aims to improve the growth rate of the fish and to provide significant benefits to tilapia farmers.
Innovation & Investment
Unleashing the genetic potential of black tiger shrimp
The black tiger shrimp is the second most important, farmed shrimp species globally. Because of its importance in Australia, the new ARC Hub for Advanced Prawn Breeding will develop a scalable, advanced breeding program for the species as well as bring its genetic knowledge to a level comparable to that of livestock.
Aquafeeds
Breaking the 20 percent soy barrier in fish feed
Reduced performance in fish fed high-soy feeds has been blamed on antinutrients, low methionine content and palatability issues. Pretreatment to inactivate anti-nutritional compounds and supplementation with amino acids improves soy-based feed performance, but not to control levels.