Estimating surface copepod concentrations using satellite imagery
Calanus finmarchicus concentrations estimated at between 80,000 and 150,000 individuals per cubic meter within the area studied
Satellite-derived ocean color data are routinely used to identify optically important constituents in the water column, usually defined as chlorophyll (CHL), other non-algal particles (NAP) and colored dissolved organic material (CDOM). There has been a historic focus on the remote sensing of phytoplankton due to their importance in the global carbon cycle and marine food webs. While phytoplankton are a taxonomically diverse group of organisms, all contain the photosynthetic pigment chlorophyll a, through which energy from sunlight is synthesized. It is primarily the effect of absorption from this pigment that can be detected through ocean color remote sensing and is typically used as a proxy for phytoplankton biomass.
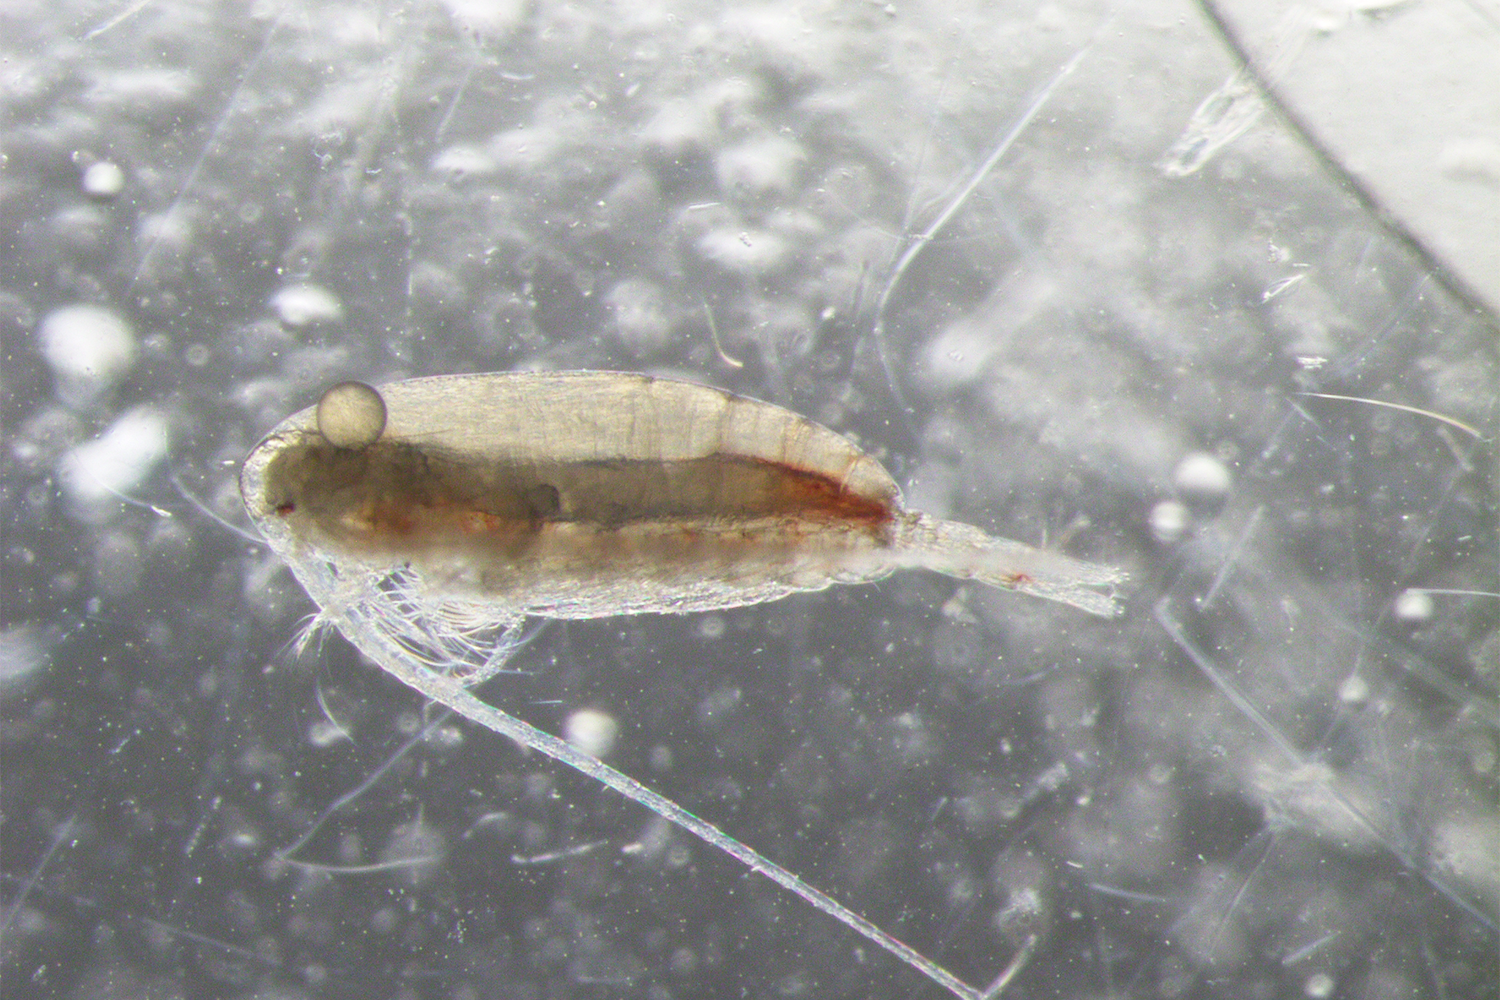
Phytoplankton are grazed on in surface waters by several herbivorous zooplankton species, including the copepod Calanus finmarchicus. This copepod is a keystone species of the North Atlantic and Sub-Arctic ecosystems, serving as a nutritional food source for higher-order predators in the region, as well as playing an important role in biogeochemical cycling. These copepods are also commercially harvested for their high content of omega-3-rich oil, applications of which include incorporation into fish food for aquaculture and the preparation of health supplements for human consumption. In this context, there is considerable interest in establishing robust stock estimates in order to support the sustainable management of this fishery.
This article – summarized from the original publication (McCarry, C.L. et al. 2023. Estimating Surface Concentrations of Calanus finmarchicus Using Standardised Satellite-Derived Enhanced RGB Imagery. Remote Sens. 2023, 15(12), 2987) – assessed the extent to which C. finmarchicus absorption impacts ocean color signals and copepod surface concentrations.
Study setup
This study involved the use of a combined approach of standardized ocean color imagery and radiative transfer modeling to identify reflectance anomalies potentially caused by surface swarms of C. finmarchicus in the northern Norwegian Sea.
![Ad for [BSP]](https://www.globalseafood.org/wp-content/uploads/2025/07/BSP_B2B_2025_1050x125.jpg)
In situ data were collected during the Sea Patches cruise on the R/V Helmer Hanssen off the coast of northern Norway. CDOM absorption, chlorophyll a concentration, phytoplankton abundance, vertical distribution, species identification and the pigment absorption of C. finmarchicus were measured at eight stations within the study area.
For detailed information on the study setup; field data; satellite data and eRGB image processing, and other analytical procedures, refer to the original publication.
Results and discussion
Satellite-derived RGB (additive color model in which the red, green and blue primary colors of light are added together in various ways to reproduce a broad array of colors) imagery is routinely used to identify environmental phenomena and observe changes in the state of marine ecosystems over large spatio-temporal scales. Enhanced RGB (eRGB) imagery can be a useful tool when looking at the ocean, as it increases the contrast of optical constituents in the water by using a green waveband (555 nm in this study) as the “red” component in the image. However, these images can be processed in a variety of ways.
One method of applying contrast stretching to RGB imagery that is widely used is to exclude 5 percent of pixels in each band (the percentile stretching technique). This method relies upon the information contained within the image to calculate the band ranges and, thus, produces visually inconsistent imagery that proves to be of limited use when attempting to identify features over multiple images. In this study, a contrast stretch range for each band was developed using a global dataset which provided visual consistency between the images processed. By applying the same stretch range, variance due to the processing method is removed and more quantitative information can be gained from the eRGB imagery.
Although the dataset used to determine the ranges in this study nominally had global coverage, it is likely that these ranges may need to be further adapted for other areas. The range in this study was selected to provide the best visual output for the Norwegian Sea region, and for this, the upper 90th percentile was set as the limit. In clear blue waters, for example, it is likely that the 443 nm and 488 nm wavebands would have high reflectance relative to the Norwegian Sea and would exceed the ranges applied in this study. Therefore, the range needs to be altered when applying the general method to different waters.
The C. finmarchicus concentration maps indicate surface concentrations of between 80,000 and 200,000 individuals per cubic meter within the extent of the red patch. These concentrations are an order of magnitude greater than those measured in a previous, 2017 cruise, during which the maximum reached was 16,000 individuals per cubic meter at the surface. There are two potential reasons for this apparent mismatch. Firstly, the zooplankton abundance estimates during the 2017 cruise were derived from samples of the top 5 meters of the water column. Abundances are calculated over these 5 meters, but it is not possible to tell where in the water column these organisms were distributed. If they were concentrated in the top surface meter, for example, the surface abundance would be 80,000 individuals per cubic meter, which correlates more closely with the concentration maps derived from satellite data.
Another possible reason for the mismatch between satellite concentration estimates and in situ samples is animal evasion. Traditional zooplankton sampling techniques (i.e., net sampling or trawls) are invasive and likely to disturb the community that they are attempting to sample. Unlike phytoplankton, C. finmarchicus have the ability to swim, and as a result, may evade capture. A recent study conducted on fish and zooplankton populations in the Arctic during polar night found that a normal working light from a ship could disrupt populations down to 200 meters depth and up to 0.125 square kilometers around the ship.
Researchers examine the impact of climate change on zooplankton
Also, the possibility that ship engine noise and disturbance from net sampling will also result in animal evasion must be considered. Taken together, all these results point to a potential problem with the underestimation of population densities for these mobile copepods using traditional shipboard sampling techniques, which could have significant implications for both management strategies and ecological modeling.
It is important to note that satellite data only have the ability to resolve surface populations of C. finmarchicus, and no information on populations at significant depths can be retrieved. The optical depth is primarily determined by the constituents in the water column and is typically between 5 and 10 meters. Although we cannot resolve populations at depth, these results are useful for providing a non-invasive method to identify and quantify surface populations, as well as track the spatiotemporal variation of these large-scale features. Additionally, the optical characterization of C. finmarchicus in this study is limited to absorption alone, as no data are currently available on backscattering effects.
Something to consider when applying this method for the identification of zooplankton aggregations is the similarity in spectral signature between CDOM and C. finmarchicus absorption. Although their spectral shape is different, both have broadly the same effect of reducing reflectance in the blue/green part of the spectrum. Although it is clear that this method has the ability to discern somewhat between CDOM and C. finmarchicus, it is possible that there is still a degree of underestimation of C. finmarchicus populations due to limited ability to distinguish their optical signal from that of CDOM using only three wavebands.
A potential solution to this problem is a full spectral matching approach of the current multispectral data available, extendable in the future to hyperspectral (imaging narrow spectral bands over a continuous spectral range, producing the spectra of all pixels in the scene) data. The use of all the spectral information available may aid in resolving finer-scale optical features and will form the subject of further work in this area. With the advent of NASA’s PACE mission (Plankton, Aerosol, Cloud, ocean Ecosystem, PACE, is a NASA Earth-observing satellite mission that will continue and advance observations of global ocean color, biogeochemistry, and ecology, as well as the carbon cycle, aerosols and clouds), global satellite-derived hyperspectral data will become accessible. Better resolution of surface zooplankton swarm formations and concentrations may benefit from the new capabilities that PACE will offer.
Perspectives
Through the use of a novel eRGB color matching technique, this study demonstrated the ability to identify and characterize dense surface aggregations of the zooplankton species Calanus finmarchicus from satellite-derived ocean color imagery. Concentration estimates of the patch in the northern Norwegian Sea were an order of magnitude greater than those measured in situ during the time period and point to a potential animal evasion issue, due to the invasive nature of traditional ship-based sampling techniques. This could lead to significant population underestimations and, therefore, more work is required to both characterize potential evasion behavior and develop less invasive sampling methods that will reduce population disturbance for ground truthing.
Furthermore, this study demonstrated that C. finmarchicus absorption can lead to an overestimation of chlorophyll and CDOM retrievals, which should be considered in regions where these organisms are present in surface waters. The methodology described in this study is derived from a global in situ dataset and, therefore, there is scope for this method to be used to detect optical anomaly elsewhere.
However, more work on the adaptability of this method for clear blue case 1 waters is required, where the blue signal is much larger than in this study region. In any case, it is clear that larger particles, such as zooplankton, can influence ocean color signals and need to be taken into consideration when characterizing the optical properties of oceanic environments.
Now that you've reached the end of the article ...
… please consider supporting GSA’s mission to advance responsible seafood practices through education, advocacy and third-party assurances. The Advocate aims to document the evolution of responsible seafood practices and share the expansive knowledge of our vast network of contributors.
By becoming a Global Seafood Alliance member, you’re ensuring that all of the pre-competitive work we do through member benefits, resources and events can continue. Individual membership costs just $50 a year.
Not a GSA member? Join us.
Author
-

Corresponding author and Ph.D. student
Physics Department, University of Strathclyde, Glasgow G4 0NG, UK
Related Posts
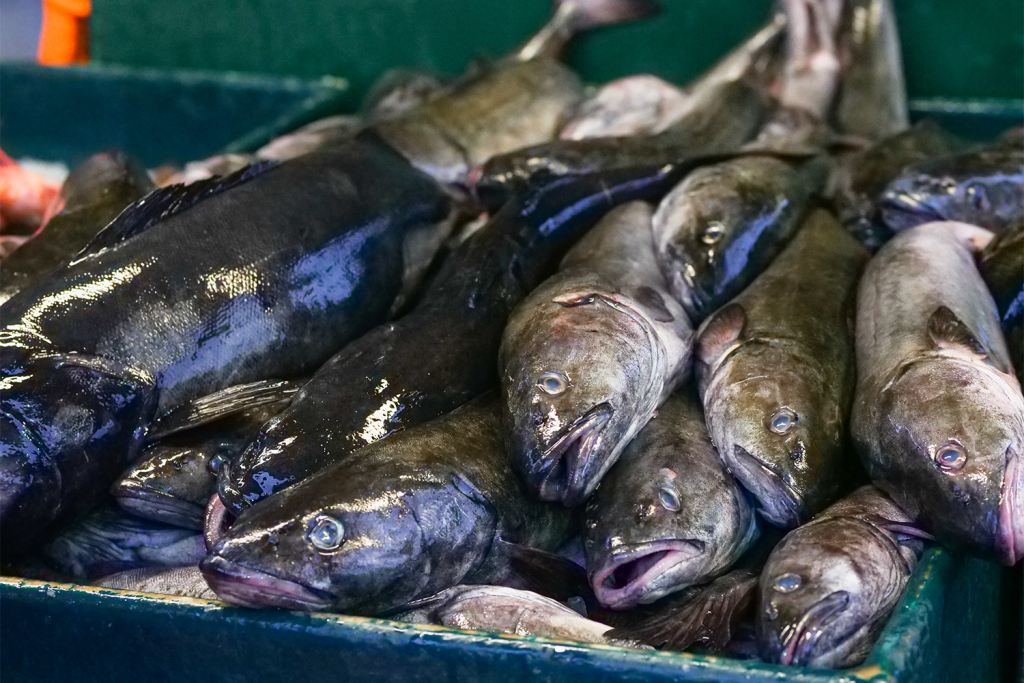
Fisheries
Distinct stocks of Atlantic cod face different climate change challenges
Distinct stocks of North Atlantic cod are being stressed by different factors of varying management severity due to the impacts of climate change.
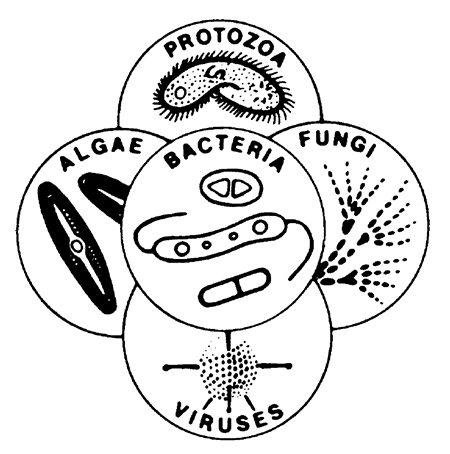
Responsibility
Aquaculture and the microbial world
Microorganisms reside in the sediment and other substrates, and in the water of aquaculture facilities, as well as in and on the cultured animals.
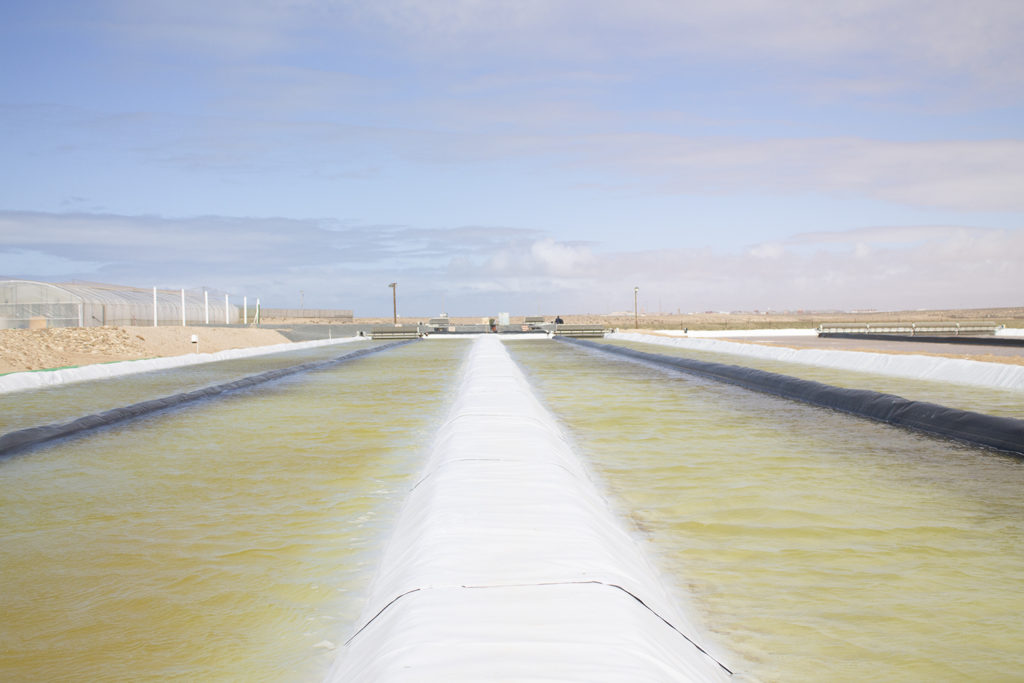
Aquafeeds
Sunlight, seawater and wind: A simple recipe for ambitious algae grower Susewi
Utilizing proven large-scale pond engineering, Susewi aims to become the world’s largest producer of algal biomass, with its sights set on aquafeeds.
Innovation & Investment
Algae innovators aim to freeze out early-stage shrimp losses
A greenhouse in Belgium believes its innovative shrimp feed product, made from freeze-dried microalgae, packs the necessary nutrients for the crustacean’s most vulnerable life stage: the first three days of its life.