Embodied resource use in feed-based aquaculture
Greatest impacts typically assigned to production facilities
Life cycle analysis (LCA) is becoming popular for accounting the total amount of resources used and the cumulative negative environmental impacts for producing and using products. In LCA, products are usually assessed “from cradle to grave.” A product is made, used and disposed of, with each step requiring resources and having impacts.
Several LCAs have been published for aquaculture products. They reveal much greater use of inputs for producing aquaculture products than those used at the farm level – even if the LCA is conducted only to the farm gate.
Much of the difference in use of resources estimated by LCA and the actual use of resources at the farm level results from what are called embodied, embedded or virtual resources used in producing the inputs used at the production facility. These embodied resources include water, land, nutrients, energy, equipment and other materials necessary to produce and use the farm-level inputs.
The LCA concept is an eloquent and technically correct way of assessing the total impacts of a product. However, in evaluating the use of resources and impacts of aquaculture production, there is a danger of the entire array of embodied resources and impacts being assigned to the aquaculture production facility.
![Ad for [Aquademia]](https://www.globalseafood.org/wp-content/uploads/2025/07/aquademia_web2025_1050x125.gif)
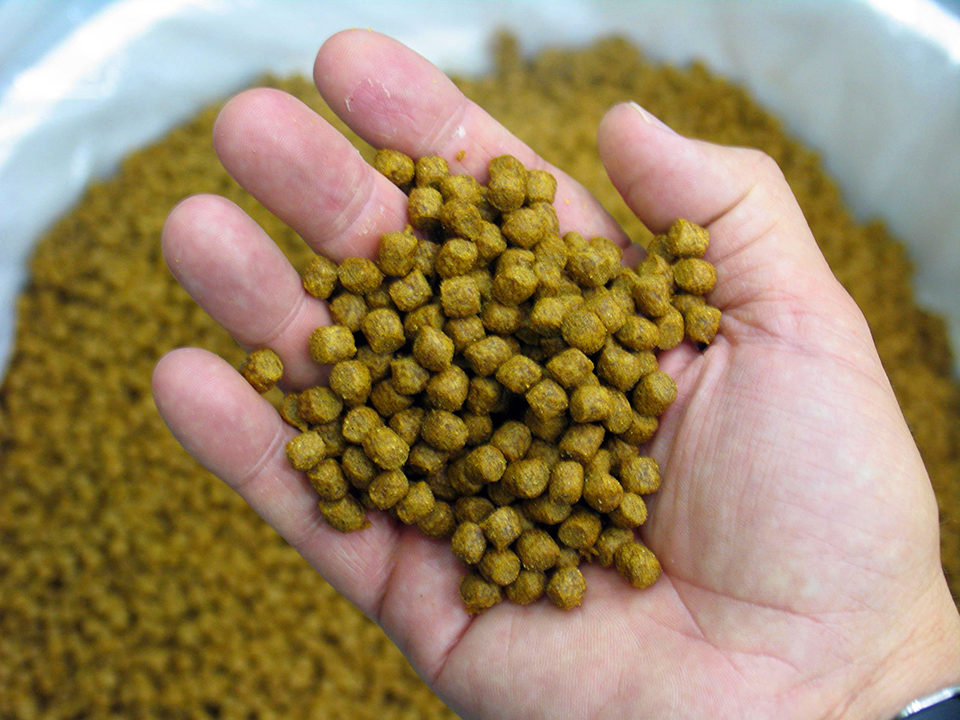
Catfish feed, FCR example
Feed production and use for ictalurid catfish farming in Alabama, USA, provides a good example of how embodied resources can influence overall resource use at the farm level. Each metric ton (MT) of feed for ictalurid catfish production in Alabama, has embodied in it 0.311 hectares of land, 314 cubic meters of water and 27.8 kg nitrogen and 4.13 kg phosphorus from fertilizers that were used to produce the plant ingredients included in it. It also has 5.04 gigajoules (GJ) of embodied energy in processing feed ingredients, manufacturing and transportation. This does not include the embodied resources necessary for manufacturing the machinery and vehicles used in providing and using the feed.
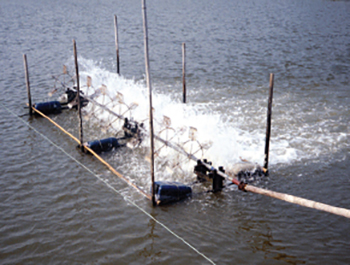
At the farm, the producer uses feed, but has no control over the resources or impacts associated with its production and delivery. The only direct, farm-level energy use associated with ictalurid catfish feed is the small amount used in mechanical feed application. Of course, catfish farms also use energy for other purposes – mostly mechanical aeration.
The sum of resources used is much greater for total resources (embodied plus farm-level use) than for resources used directly on the farm (Table 1). Producers can have an important role in lessening the total amount of embodied resources consumed in aquaculture production up to the farm gate level.
Boyd, Use of resources, Table 1
| Resource | Direct Use | Embodied Use | Total Use |
|---|---|---|---|
| Land (ha)* | 0.208 | 0.595 | 0.803 |
| Water (m3)** | 3,000 | 682 | 3,682 |
| Energy (gigajoules) | 6.01 | 10.08 | 16.09 |
| Nitrogen (kg) | 0 | 27.8 | 27.8 |
| Phosphorus (kg) | 0 | 4.13 | 4.13 |
Consider two ictalurid catfish farms, one whose fish production reflects an average feed-conversion ration (FCR) of 1.6 by virtue of good feed management and one that has an FCR of 2.3 because of overfeeding – a typical occurrence. Since catfish farms with different FCRs often have similar production, it will be assumed that both farms produce the average 6,000 kg/ha of fish per year typically achieved by catfish farms in Alabama. The actual farm-level contributions to embodied resource use in feed are illustrated for the two FCRs in Table 2. The reduction in resource use by decreasing the FCR from 2.3 to 1.6 is about 30 percent. The reductions per 0.1 unit improvement in FCR also are given in Table 2.
Boyd, Feed and embodied resource,Table 2
| Variable | Feed-Conversion Ratio 2.3 | Feed-Conversion Ratio 1.6 | Embodied Resource Use (%/0.1 FCR improvement) |
|---|---|---|---|
| Feed use (kg/mt fish) | 2,300 | 1,600 | -100 |
| Embodied resources Land (ha/mt fish) | 0.715 | 0.500 | -0.031 |
| Water (m3/t fish) | 722.0 | 502.0 | -31.4 |
| Energy (GJ/mt fish) | 11.59 | 8.06 | -0.50 |
| Nitrogen (kg/mt fish) | 63.90 | 44.50 | -2.80 |
| Phosphorus (kg/mt fish) | 9.90 | 6.60 | -0.47 |
In addition to lessening the embodied resources and associated impacts, reducing FCR also lowers the amounts of nitrogen and phosphorus discharged to the environment in farm effluent. Moreover, reduction in FCR lessens the amount of feed needed to produce a unit weight of fish, thereby lowering production costs. In the example in Table 2, 700 fewer kilograms of feed are needed to produce 1 MT of fish at an FCR of 2.3 than at 1.6. At current feed costs, this represents a savings of around U.S. $385/MT fish produced.
Efficiency benefits
The benefits of improving the efficiency of aquaculture present a win-win situation for both producers and conservation of resources and ecosystems. Nevertheless, some may see the embodied and direct use of resources for feed necessary for intensification of aquaculture as a reason to promote less-intensive aquaculture – especially aquaculture based on natural productivity in ponds. Of course, most of the species internationally traded are produced with feed and do not contribute a great deal to feeding the undernourished. However, the use of feeds for aquaculture species sold in domestic markets in developing countries is increasing.
The production of aquaculture must essentially double by 2050, and much of this increase will be in the culture of lower-trophic-level species for domestic markets in developing countries. But there is simply not enough land available to allow sufficient expansion of aquaculture based on natural productivity – even if productivity is stimulated by manure application or chemical fertilization. Thus, feed-based aquaculture is extending to pond culture of tilapia, carp and other lower-trophic-level species produced as a protein source for low-income families in developing countries.
According to the Alltech Global Feed Survey, 34.4 million MT of feed were used in aquaculture in 2012. At an average feed-conversion ratio for all species of 1.6, this equates to 21.5 million MT of production. The total production of species that potentially can be raised on feed was 51.5 million MT. This suggests that about two-thirds of the current production of species that can be reared on feed are indeed based on feeding. A similar estimate has been made by the Food and Agriculture Organization of the United Nations.
Perspectives
Unfortunately, intensification of aquaculture (and agriculture) is not a panacea that will assure plenty of food for the future. There may not be enough resources to allow production of the increasing quantity of food needed by the growing population. Moreover, the earth may not be able to absorb the accumulated impacts of this production and avoid changes in climate and ecosystems that will negatively affect both food production and human life.
The different sectors of the world food system, as well as the production of other human necessities, compete with each other for resources, so the culprit in resource use and ecosystem degradation is not food production per se, but the growing human population and its demands for goods and services.
There is urgent need to provide human necessities for the future using no more than or even fewer resources than those currently used. Thus, the management practices necessary to assure efficiency in land, water, feed and energy use should be given highest priority in efforts to promote responsible aquaculture.
Editor’s Note: The authors of this article recently wrote “Aquaculture, Resource Use and the Environment,” a book published in February 2015 by Wiley-Blackwell. Embodied resource use, a major topic in the book, is a critical concept that is increasingly being used to evaluate food production systems.
(Editor’s Note: This article was originally published in the May/June 2015 print edition of the Global Aquaculture Advocate.)
Now that you've reached the end of the article ...
… please consider supporting GSA’s mission to advance responsible seafood practices through education, advocacy and third-party assurances. The Advocate aims to document the evolution of responsible seafood practices and share the expansive knowledge of our vast network of contributors.
By becoming a Global Seafood Alliance member, you’re ensuring that all of the pre-competitive work we do through member benefits, resources and events can continue. Individual membership costs just $50 a year.
Not a GSA member? Join us.
Authors
-

School of Fisheries, Aquaculture and Aquatic Sciences
Auburn University
Auburn, Alabama 36830 USA -

Director, Aquaculture
World Wildlife Fund
Washington, D.C., USA
Related Posts
Responsibility
Calcium and magnesium use in aquaculture
Aquatic plants and animals get the essential nutrients calcium and magnesium from water and food. Calcium concentrations impact the hydration and development of eggs in a hatchery, where calcium carbonate precipitation can be troublesome.
Health & Welfare
Common salt a useful tool in aquaculture, part 2
The preventive use of common salt (sodium chloride) by commercial producers of freshwater fishes has many benefits, including helping with the routine prevention of losses due to diseases, stress and mishandling during transport, harvesting, grading, counting, weighing and induced spawning.
Responsibility
Efficiency of mechanical aeration
Although relatively expensive, mechanical aeration increases production. Asian-style paddlewheel aerators are widely used but are inefficient. Testing has led to more efficient designs that are now widely used in U.S. catfish and shrimp ponds.
Health & Welfare
The importance of iron in aquaculture systems
Iron is the fourth most abundant element in the earth’s crust, but occurs at very low concentrations in surface waters and oceans. It is an essential element for many organisms as part of many enzymes, and also has an important role in plant photosynthesis.