Effects of aquaculture on China’s marine fisheries over the past 30 years
Study provides a broad assessment on the impacts of aquaculture development on marine wild fisheries in all coastal provinces
Globally, China is the largest capture fisheries and aquaculture producer, accounting for more than 19 percent of global marine capture fishery production and more than 61 percent of global aquaculture production. Aquaculture in China has developed rapidly in the past few decades and the country is the leading aquaculture producer in the world since the 1990s.
How China develops its aquaculture sector and whether such development can relieve pressure on wild fisheries are past and future contentious issues. Both sides on this argument have their own views, and neither side has directly explored the statistical relationship between China’s aquaculture and marine wild fisheries resources. But there are no disputes on the existence of a link, positive or negative, between China’s aquaculture and wild fish resources in the past decades.
Whether the country’s efforts to improve its aquaculture industry has relieved pressure on wild fisheries in recent decades must be analyzed, because the relationships between the development of China’s aquaculture and the demand of marine wild fisheries resources are poorly understood.
This article – adapted and summarized from the original publication (Zhao K. et al. 2021. Aquaculture Impacts on China’s Marine Wild Fisheries Over the Past 30 Years. Front. Mar. Sci. 8:710124) – reports on a study to explore the impact of aquaculture development in different periods on marine wild fisheries resources under the background of the rapid development of China’s fishery industry over the past 30 years.
![Ad for [BSP]](https://www.globalseafood.org/wp-content/uploads/2025/07/BSP_B2B_2025_1050x125.jpg)
Study setup
We collected official data for marine wild fish catches (1990–2019) for all the country’s coastal provinces (representing 68.9 percent of the total aquaculture production) from the Ministry of Agriculture and Rural Affairs of the People’s Republic of China. Twenty-eight marine fish species or groups in the China Seas were reported, according to province, in the Chinese National Fishery Statistics Yearbook. Since 1989, 16 species or species groups have been reported continuously, accounting for more than 84 percent of the reported fish species catch over the past three decades. The catch data of these 16 marine wild fish species or species groups were collected in 11 coastal province administrative regions (Tianjin, Hebei, Liaoning, Shanghai, Jiangsu, Zhejiang, Fujian, Shandong, Guangdong, Guangxi, and Hainan) to reflect the demand of marine wild fish resources from 1989 to 2018.
According to human uses, 16 marine wild fish species or species groups were divided into two categories: one was high-valued edible economic fish (i.e., Japanese scad, large yellow croaker, small yellow croaker, pike conger, ilisha, grouper, snapper, hairtail, golden threadfin bream, mackerel, pomfret, and black scraper); and the other category included low-value forage fish (i.e., anchovies, sardines and herrings) – these three forage fish species are the most typical, mainly used as the raw material to process fishmeal in China, although small amounts are used for direct feeding. Although these species cannot represent all the utilized wild fisheries resources, the fishing practices in China are largely indiscriminate (∼50 percent trawl fisheries) and there is little discard because a market exists for a wider range of species and sizes than are typically saleable in other locales. Thus, these 16 recorded fish species were chosen as indicator species of the demand for marine wild fisheries resources.
Mariculture production (MAP) and freshwater aquaculture production (FAP) variables were selected to represent aquaculture development in China, and official data were obtained for each province from the Ministry of Agriculture and Rural Affairs of the People’s Republic of China (1990–2019). Fishery gross product (FGP) measures the size of the fishery economy and represents the development of China’s fishery industry, and the data were extracted from the National Bureau of Statistics of China (1990–2019).
For additional details of the dataset used in our study, and information on the statistical analyses used, refer to the original publication.
Results and discussion
Results of our study provide a broad assessment on the impact of aquaculture development in different periods on marine wild fisheries, based on aquaculture and marine wild fish catch data from all the coastal provinces of China.
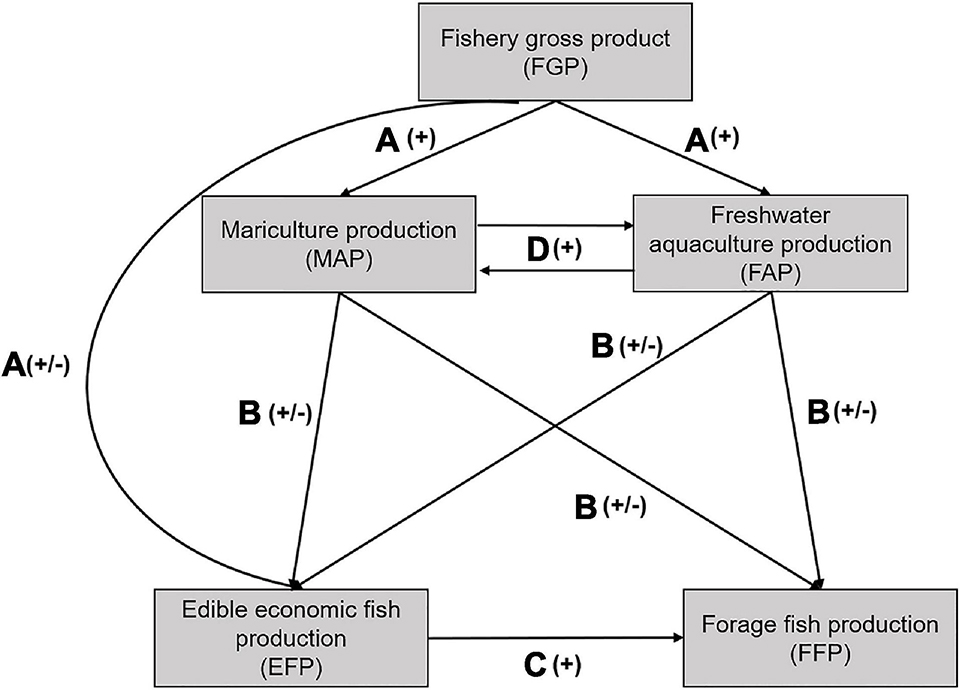
We developed a conceptual meta-model [used for the analysis, construction and development of the frames, rules, constraints, models and theories applicable and useful for modeling a predefined class of problems] to test the relationship between aquaculture and marine wild fisheries (Fig. 1). Fishery gross product (FGP) was predicted to drive mariculture production (MAP), freshwater aquaculture production (FAP) and marine edible economic fish production (EFP). MAP and FAP were predicted to drive EFP and marine forage fish production (FFP). MAP and FAP were predicted to accelerate each other. Finally, EFP was predicted to drive FFP. Our research is a broad assessment, because the complex relationship between aquaculture structure, fisheries resource utilization and the unidentified “nei” species (not elsewhere included or unidentified species) and trash fish species are not considered.
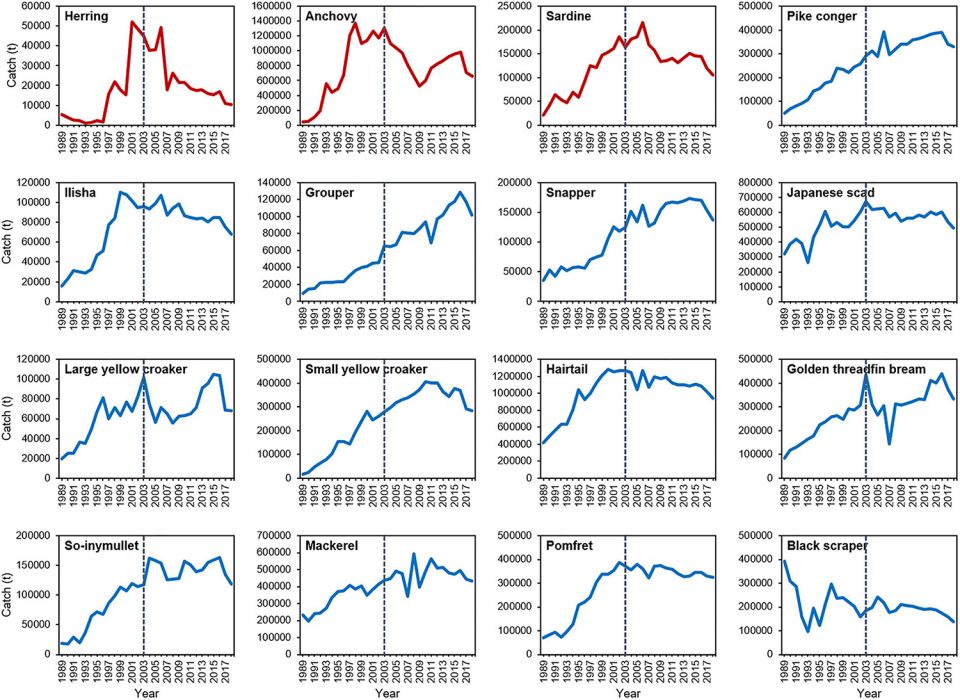
Regarding the shift dynamics of marine wild fish catch, according to the total sum of shift counts per province, seven statistically significant assemblage breaks occurred from 1996 to 2013, and the major break was 2003. Hence, 2003 was selected as the node, and the marine wild fish catches were divided into two periods over the past 30 years (Fig. 2). In the first period (1989–2002), all species or species groups fluctuated and increased, except for the catch of black scraper that was decreased. During the second period (2003–2018), the catch of all three forage species or species groups declined. Other edible economic fish – such as ilisha, Japanese scad, hairtail, pomfret, and black scraper – also showed a downward trend. The catch of large yellow croaker, golden threadfin bream and mackerel fluctuated greatly, and for all fish species or species groups, the catch continued to decline from 2017 to 2018.
Evaluating the impact of aquaculture development on marine wild fisheries, during the first period (1989–2002) the relationship between all variables was significantly positive, except for FGP to EFP, FAP to EFP, and EFP to FFP (Fig. 3A, C). In the second period (2003–2018), fisheries development negatively affected the EFP and still positively affected the output of aquaculture (Fig. 3B, D). Unlike in the first period, the MAP in the second period was not significantly correlated with the EFP and FFP. Furthermore, the FAP positively affected the EFP, but the effect on the FFP was changed to negative. The EFP had a positive influence on the FFP from 2003 to 2018 and had been strengthened over the past three decades. A significant positive relationship was found between the MAP and FAP, except for the effect of FAP on the MAP from 2003 to 2018 (Fig. 3A, D).
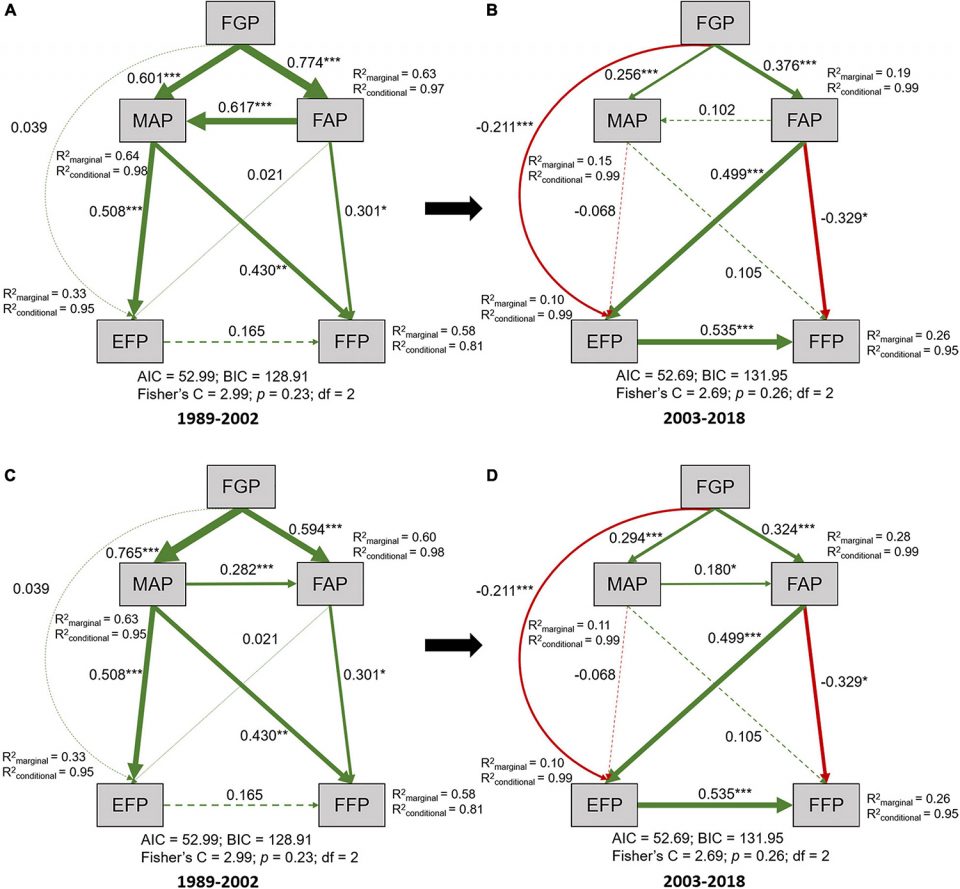
In the first study period, fisheries development promoted the increase in aquaculture production, which further enhanced the increase in the FFP (Fig. 3A, C). In 1986, the Fishery Law of the People’s Republic of China formally established the principle of “giving priority to aquaculture with simultaneous efforts in aquaculture, fishing and processing, taking measures in accordance with local conditions, with respective priorities,” thereby marking the official determination of China’s “giving priority to aquaculture” policy in seafood production. This policy promoted the rapid growth of China’s aquaculture industry, and in 1988, China became the only country in the world where aquaculture production exceeded the marine wild catch.
In the second period, the relationship between aquaculture production and marine wild fish catch changed. We found no substantial correlation with the MAP for the EFP and FFP (Fig. 3B, D), which does not indicate that mariculture did not depend on any marine wild fisheries resources because many of the trash fish and “nei” species used for direct feeding and fishmeal processing were not considered here. The weakening of the relationship between mariculture and marine wild fish catches is a clear sign that mariculture is becoming less dependent on forage fisheries. China’s mariculture mainly involves mollusk and algae species that require no external feed inputs. The main fishmeal-fed species in mariculture are crustaceans, sea bass, flatfish, large yellow croaker, grouper and other marine fish, which only account for approximately 5.5 percent of the total aquaculture production.
The trophic level of farmed crustaceans decreased from 3.5 in 1985 to 2.89 in 2014 due to the increase in the proportion of compound aquafeeds and the decrease in trash fish use. The trophic level of fishes also decreased from 4.5 in 1985 to 3.77 in 2014, and that of other species also decreased from 3.00 in 1985 to 2.31 in 2014. Increased knowledge on the digestive processes and nutritional requirements of farmed species and on the processing of raw material combined with the use of alternative proteins has led to significant reductions in fishmeal inclusions in aquafeeds and improvements in feed conversions in cultured species.
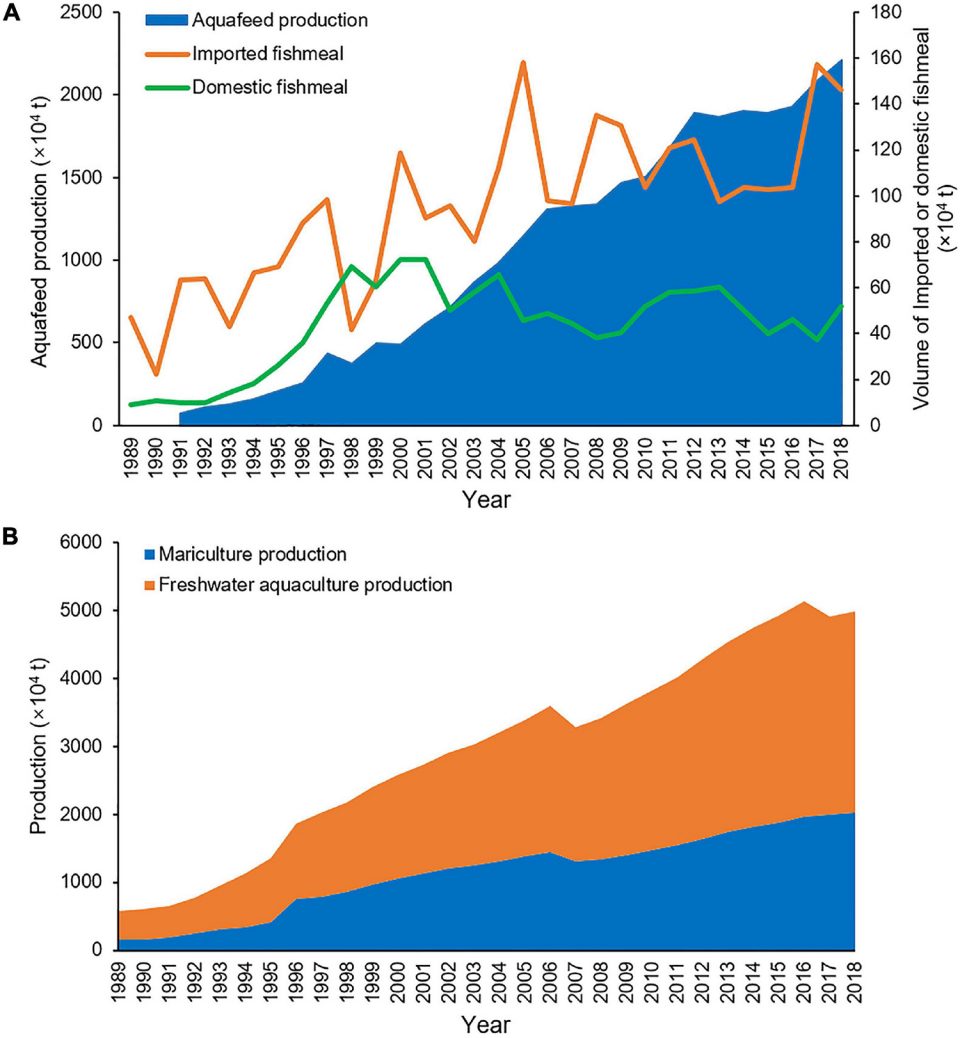
Examining China’s aquafeeds and aquaculture production and fishmeal usage, from 1989 to 2005 the volume of imported fishmeal showed a fluctuating upward trend, but trended stable from 2006 to 2018. The trend of domestic fishmeal is similar to that of imported fishmeal, which increased first and then slightly decreased. China’s aquafeeds and aquaculture production have continued to grow rapidly from 1989 to 2018 (Fig. 4).
Because of the use of compound aquafeeds, the trophic level of freshwater aquaculture also decreased. In 2014, 35.2 percent of China’s FAP was obtained from non-fed species (fish, molluscs and algae). More than 82 percent of finfish in freshwater aquaculture are filter feeding, herbivorous and omnivorous species and thus do not depend on fishmeal to any significant extent. Our results indicate that FAP had a significant negative effect on the FFP and a significant positive effect on the EFP (Fig. 3B, D), thus suggesting that the demand for marine fisheries resources has not been reduced so far due to the large volume of freshwater aquaculture.
The negative effect of FGP on EFP suggests that the economic upsurge in China has increased the living standards and consumption of high-valued seafood species and caused most edible economic fish species or species groups resources to be unstable and decline. And the positive effect of the EFP on FFP changed from non-significant to significant, implying that the forage fish bycatch increased substantially. This finding was consistent with the changes in the domestic marine catch composition from a predominance of relatively large-sized, high-valued, high trophic level, demersal species to multiple small, low-valued, short-lived and low trophic level.
China is a world leader in low trophic level aquaculture production, and its aquafeeds and aquaculture production have continued to grow without the need to increase the imported and domestic fishmeal usage from around 2000 to 2018 (Fig. 4). Since 2000, only 50 to 60 percent of the fishmeal consumed annually in China was used for aquaculture, and 35 to 38 percent for swine and poultry. Moreover, processing wastes from aquatic products have accounted for 25 to 35 percent of the raw materials in fishmeal and fish oil manufacturing, and freshwater fishmeal showed an increasing trend with freshwater fish production. Researchers have estimated that fish processing wastes could meet almost half, and potentially two-thirds, of China’s current demand for fishmeal in aquafeeds. Given that Asian fishmeal manufacturing increasingly tends to use by-products from the fish food industry, the dependence on low-valued fish/trash fish for fishmeal production could be further decreased.
Our results also demonstrate a shift in dependence on marine wild fisheries from mariculture to freshwater aquaculture over the past 30 years. Although our results indicated that there is still a great demand for marine fisheries resources due to the large quantity of freshwater aquaculture, but low trophic level fish are the main species in freshwater aquaculture, with trophic level from 2.0 (around 65 percent) to 3.5 (around 35 percent) accounting for around 100 percent. In China, aquaculture production is dominated by plants, non-fed molluscs and fish, herbivores and omnivores, which have a very low fish-in-fish-out ratio and showed an overall downward trend, particularly for freshwater aquaculture. Consequently, China’s aquaculture is transforming to a sustainable development pattern with low input and high output.
From the early 2000s to the present, fishery development policies have undergone great changes in the fishing and aquaculture industries. The fishery-related policies aim to control the fishing capacity and resource utilization intensity, and the aquaculture policies have shifted from focusing on quantity growth to quality improvement. There are a series of initiatives implemented since 2016 to improve the mechanisms and methods for marine fishery management, and the Chinese government has invested extensive efforts into reviewing and reforming its legislation, institutional arrangements, and governance of marine capture fisheries. These measures have resulted in a sustained and substantial decline in total domestic fishing production from 2017 to 2018. And China’s national development philosophy has gradually shifted from emphasizing economic growth to highlighting ecological protection, and the fisheries resource conservation has become a top priority of marine fishery management in China.
Perspectives
This study provides the first large-scale statistical evidence on the links between China’s aquaculture and marine wild fish catches changes over the past 30 years. Although aquaculture still puts pressure on marine wild fisheries resources, it provides food for China and the world and reduces the huge demand for marine capture fisheries.
Results indicate that China’s aquaculture is transforming to a sustainable development pattern with low input and high output, and this shift has started to exhibit positive effects. Such evidence is important for evaluating the impact of China’s aquaculture on marine wild fisheries resources and contributes to the sustainable management of China’s aquaculture and marine capture fisheries.
Now that you've reached the end of the article ...
… please consider supporting GSA’s mission to advance responsible seafood practices through education, advocacy and third-party assurances. The Advocate aims to document the evolution of responsible seafood practices and share the expansive knowledge of our vast network of contributors.
By becoming a Global Seafood Alliance member, you’re ensuring that all of the pre-competitive work we do through member benefits, resources and events can continue. Individual membership costs just $50 a year.
Not a GSA member? Join us.
Authors
-

Donghu Experimental Station of Lake Ecosystems, State Key Laboratory of Freshwater Ecology and Biotechnology of China, Institute of Hydrobiology, Chinese Academy of Sciences, Wuhan, China; and University of Chinese Academy of Sciences, Beijing, China
-
Hubei Provincial Engineering Laboratory for Pond Aquaculture, College of Fisheries, Freshwater Aquaculture Collaborative Innovation Center of Hubei Province, Huazhong Agricultural University, Wuhan, China
-
Donghu Experimental Station of Lake Ecosystems, State Key Laboratory of Freshwater Ecology and Biotechnology of China, Institute of Hydrobiology, Chinese Academy of Sciences, Wuhan, China; and University of Chinese Academy of Sciences, Beijing, China
-
Donghu Experimental Station of Lake Ecosystems, State Key Laboratory of Freshwater Ecology and Biotechnology of China, Institute of Hydrobiology, Chinese Academy of Sciences, Wuhan, China; and University of Chinese Academy of Sciences, Beijing, China
-
Donghu Experimental Station of Lake Ecosystems, State Key Laboratory of Freshwater Ecology and Biotechnology of China, Institute of Hydrobiology, Chinese Academy of Sciences, Wuhan, China; and University of Chinese Academy of Sciences, Beijing, China
-
Donghu Experimental Station of Lake Ecosystems, State Key Laboratory of Freshwater Ecology and Biotechnology of China, Institute of Hydrobiology, Chinese Academy of Sciences, Wuhan, China; and University of Chinese Academy of Sciences, Beijing, China
-
Corresponding author
Donghu Experimental Station of Lake Ecosystems, State Key Laboratory of Freshwater Ecology and Biotechnology of China, Institute of Hydrobiology, Chinese Academy of Sciences, Wuhan, China; and
State Key Laboratory of Marine Resource Utilization in South China Sea, Hainan University, Haikou, China; and Laboratory for Marine Fisheries Science and Food Production Processes, Qingdao National Laboratory for Marine Science and Technology, Qingdao, China