Current knowledge about fumonisins in aquaculture
Globally predominant mycotoxin contaminant found in raw material, finished feeds
This article on current knowledge about fumonisins in aquaculture is adapted from and summarizes the original BIOMIN report, first published in Aqua Culture Asia Pacific (Vol 15, # 1 Jan/Feb 2019). Fumonisins (FUM) are a group of mycotoxins discovered in 1988 in South Africa. The group includes FB1, FB2 and FB3. They are mainly produced by a number of Fusarium species, notably F. verticillioides (formerly F. moniliforme = Gibberella fujikuroi), F. proliferatum, and F. nygamai. The most abundantly produced mycotoxin of the Fusarium family is fumonisin B1 (FB1).
FUM are characterized as having a long-chain hydrocarbon unit, similar to that of sphingosine and sphinganine, which plays a role in their toxicity. Fumonisins inhibit the sphinganine (sphingosine) N-acyltransferase (ceramide synthase), a key enzyme in lipid metabolism, resulting in disruption of this pathway. This enzyme catalyzes the acylation of sphinganine in the biosynthesis of sphingolipids. Sphingolipids are important for the membrane and lipoprotein structure and also for cell regulations and communications.
Mycotoxin prominence
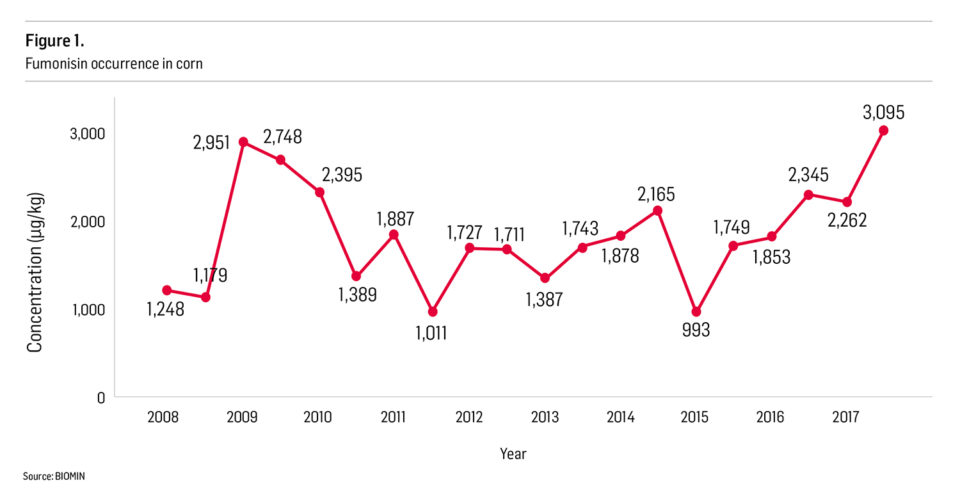
The occurrence, level of contamination and implications of mycotoxins entering the feed chain through cereal grains have gained global attention in recent years, and the aquaculture industry is no exception to this rise in awareness. Fig. 1 shows the occurrence of fumonisins in corn, one of the major commodities affected by this group of toxins. Since 2015, there has been a global trend towards increasing fumonisin levels in corn. This trend is also reflected in other commodities commonly used for aquafeed production.
![Ad for [BSP]](https://www.globalseafood.org/wp-content/uploads/2025/07/BSP_B2B_2025_1050x125.jpg)
Table 1 shows the mycotoxin contamination in important commodities and finished feeds sampled worldwide between January and December 2017. Corn, corn gluten meal (CGM), dried distillers with solubles (DDGS) and rice bran samples presented the highest occurrence of FUM. With the exception of rice bran, which had a relatively low level of contamination (161 ppb), corn, CGM and DDGS were contaminated with FUM levels of over 2,900 ppb. As FUM is relatively stable against high temperature and processing conditions, it is expected that FUM will be found in finished feeds, as confirmed by analyses of finished feed samples taken in the same reporting period (Table 1.5). In 2017, FUM was the most predominant mycotoxin, present in 81 percent of the collected samples with an average contamination level of 1,352 ppb.
Gonçalves FUM Table 1a.
| Corn samples | Afla | ZEN | DON | FUM | OTA |
|---|---|---|---|---|---|
| Number of samples tested | 5,367 | 5,064 | 4,032 | 4,480 | 1,492 |
| Contaminated samples (%) | 23 | 47 | 79 | 86 | 5 |
| Avg. of positive (ppb) | 24 | 154 | 749 | 3,189 | 25 |
| Median of positive (ppb) | 4 | 58 | 470 | 1,380 | 2 |
| Maximum (ppb) | 762 | 6,082 | 51,374 | 218,883 | 889 |
Gonçalves FUM Table 1b.
| DDGS samples | Afla | ZEN | DON | FUM | OTA |
|---|---|---|---|---|---|
| Number of samples tested | 243 | 250 | 256 | 255 | 207 |
| Contaminated samples (%) | 21 | 84 | 95 | 91 | 16 |
| Avg. of positive (ppb) | 10 | 299 | 2,725 | 2,972 | 3 |
| Median of positive (ppb) | 3 | 252 | 2,190 | 1,319 | 2 |
| Maximum (ppb) | 277 | 1,329 | 14,252 | 28,605 | 44 |
Gonçalves FUM Table 1c.
| Corn gluten samples | Afla | ZEN | DON | FUM | OTA |
|---|---|---|---|---|---|
| Number of samples tested | 70 | 79 | 81 | 69 | 44 |
| Contaminated samples (%) | 40 | 81 | 89 | 90 | 32 |
| Avg. of positive (ppb) | 46 | 1,031 | 1,251 | 3,547 | 9 |
| Median of positive (ppb) | 4 | 319 | 559 | 1,838 | 4 |
| Maximum (ppb) | 503 | 5,416 | 8,871 | 16,976 | 37 |
Gonçalves FUM Table 1d.
| Rice bran samples | Afla | ZEN | DON | FUM | OTA |
|---|---|---|---|---|---|
| Number of samples tested | 67 | 69 | 69 | 66 | 63 |
| Contaminated samples (%) | 63 | 68 | 290 | 85 | 40 |
| Avg. of positive (ppb) | 17 | 107 | 293 | 161 | 2 |
| Median of positive (ppb) | 3 | 43 | 47 | 89 | 1 |
| Maximum (ppb) | 306 | 954 | 1,836 | 878 | 9 |
Gonçalves FUM Table 1e.
| Finished feed samples | Afla | ZEN | DON | FUM | OTA |
|---|---|---|---|---|---|
| Number of samples tested | 4,545 | 4,888 | 4,926 | 4,594 | 2,579 |
| Contaminated samples (%) | 20 | 46 | 79 | 81 | 29 |
| Avg. of positive (ppb) | 43 | 67 | 502 | 1,352 | 5 |
| Median of positive (ppb) | 4 | 34 | 401 | 740 | 2 |
| Maximum (ppb) | 10,918 | 7,080 | 9,805 | 290,517 | 270 |
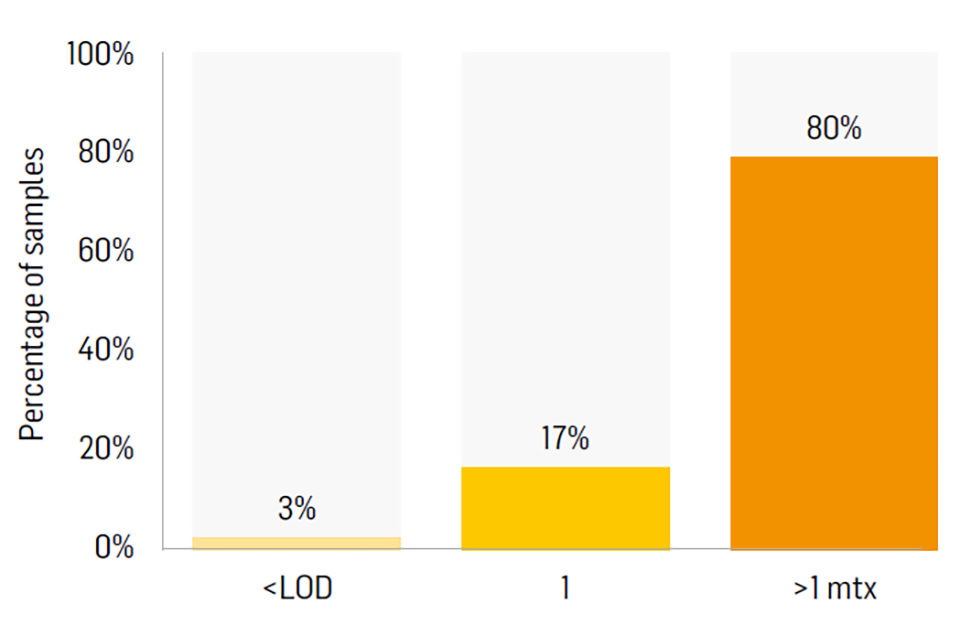
An important factor that also negatively affects aquaculture species is the co-occurrence of mycotoxins; the simultaneous presence of more than one mycotoxin in the same sample. 80 percent of finished feed samples collected in 2017 were contaminated by more than one mycotoxin (Fig. 2).
Fumonisin occurrence in Asia: A glimpse at 2018 samples
Table 2 shows the mycotoxin contamination in plant commodities and finished feeds sampled in Asia between January and March 2018. Samples from China and India are shown in Tables 3 and 4, respectively. The trend observed in the first quarter of 2018 continues the 2017 trend. Samples from China showed the highest contamination level for FUM in both plant commodities (2,767 ppb) and finished feeds (1,765 ppb).
Gonçalves FUM Table 2a.
| Plant meal samples | Afla | ZEN | DON | FUM | OTA |
|---|---|---|---|---|---|
| Number of samples tested | 338 | 346 | 346 | 323 | 292 |
| Contaminated samples (%) | 48 | 45 | 63 | 78 | 33 |
| Avg. of positive (ppb) | 36 | 130 | 503 | 1,244 | 11 |
| Median of positive (ppb) | 9 | 36 | 250 | 569 | 5 |
| Maximum (ppb) | 917 | 2,612 | 7,715 | 27,352 | 124 |
Gonçalves FUM Table 2b.
| Finished feeds | Afla | ZEN | DON | FUM | OTA |
|---|---|---|---|---|---|
| Number of samples tested | 129 | 137 | 137 | 129 | 120 |
| Contaminated samples (%) | 76 | 51 | 74 | 901 | 62 |
| Avg. of positive (ppb) | 29 | 86 | 315 | 1,103 | 11 |
| Median of positive (ppb) | 10 | 51 | 139 | 695 | 5 |
| Maximum (ppb) | 697 | 2,089 | 5,391 | 27,352 | 124 |
Gonçalves FUM Table 3a.
| OVERALL | Afla | ZEN | DON | FUM | OTA |
|---|---|---|---|---|---|
| Number of samples tested | 66 | 74 | 74 | 51 | 20 |
| Contaminated samples (%) | 58 | 88 | 100 | 98 | – |
| Avg. of positive (ppb) | 44 | 160 | 651 | 2,767 | – |
| Median of positive (ppb) | 4 | 36 | 452 | 1,724 | – |
| Maximum (ppb) | 411 | 2,612 | 2,945 | 21,428 | – |
Gonçalves FUM Table 3b.
| Finished feeds | Afla | ZEN | DON | FUM | OTA |
|---|---|---|---|---|---|
| Number of samples tested | 9 | 17 | 17 | 9 | 0 |
| Contaminated samples (%) | 89 | 100 | 100 | 100 | – |
| Avg. of positive (ppb) | 23 | 85 | 486 | 1,765 | – |
| Median of positive (ppb) | 12 | 62 | 461 | 1,750 | – |
| Maximum (ppb) | 54 | 339 | 1,025 | 2,783 | – |
Gonçalves FUM Table 4a.
| OVERALL | Afla | ZEN | DON | FUM | OTA |
|---|---|---|---|---|---|
| Number of samples tested | 74 | 74 | 74 | 74 | 74 |
| Contaminated samples (%) | 86 | 18 | 38 | 89 | 80 |
| Avg. of positive (ppb) | 32 | 30 | 72 | 690 | 15 |
| Median of positive (ppb) | 11 | 22 | 52 | 488 | 9 |
| Maximum (ppb) | 697 | 58 | 241 | 4,267 | 124 |
Gonçalves FUM Table 4b.
| Finished feeds | Afla | ZEN | DON | FUM | OTA |
|---|---|---|---|---|---|
| Number of samples tested | 55 | 55 | 55 | 55 | 55 |
| Contaminated samples (%) | 98 | 24 | 51 | 89 | 96 |
| Avg. of positive (ppb) | 36 | 30 | 72 | 555 | 14 |
| Median of positive (ppb) | 12 | 22 | 52 | 484 | 7 |
| Maximum (ppb) | 697 | 58 | 241 | 1,562 | 124 |
Toxicity to aquaculture species
In aquaculture, FUM has been generally associated with reduced growth rate, lower feed consumption, poor feed efficiency ratios, and impaired sphingolipid metabolism. However, information on the effects of FUM in the most important aquaculture species is scarce, with most of the available research focusing on freshwater species. Channel catfish is the most studied species, and the scientific literature reports it can tolerate relatively high levels of FUM, with a sensitivity level of around 10 ppb.
The liver tissue of rainbow trout is sensitive to FUM, inducing changes in sphingolipid metabolism at levels lower than 100 µg/kg and inducing cancer in one-month-old trout. The study also reported observations that all fish (including those in the control group) had very poor feed intake and growth, presenting specific growth rate values two to six times lower than the average reported in other studies.
The adverse effects of FUM-contaminated diets have also been reported in common carp. One-year-old carp showed signs of toxicity at 10,000 µg FB1/kg feed. The experiments reported the presence of scattered lesions in the exocrine and endocrine pancreas and inter-renal tissue, probably due to ischemia and/or increased endothelial permeability. In another study, one-year-old carp consumed pellets contaminated with 500, 5,000 or 150,000 µg FB1/kg of body weight, resulting in a loss of body weight and alterations of hematological and biochemical parameters in target organs.
For tropical species, Tuan et al. (2003) demonstrated that feeding FB1 at 10, 40, 70 or 150 mg/kg feed for eight weeks affected the growth performance of Nile tilapia fingerlings. In the same experiment, fish fed diets containing FB1 at levels of 40,000 µg/kg or higher showed decreased average weight gains. Hematocrit was only decreased in tilapia fed diets containing 150,000 µg FB1/kg. The ratio between free sphinganine and free sphingosine (Sa:So ratio) in the liver increased when 150,000 µg FB1/kg was present in the fish feed.
Fumonisin B1 has not been extensively studied as a shrimp feed contaminant. However, the few studies available suggest that Pacific whiteleg shrimp are sensitive to FB1. García-Morales et al. (2013) showed that white leg shrimp fed FB1 at 20 to 200 µg/kg had a reduced soluble muscle protein concentration and reported changes in myosin thermodynamic properties after 30 days of FUM exposure. The same authors reported marked histological changes in tissue samples of shrimp fed a diet containing 200 µg FB1/kg and meat quality changes after 12 days of ice storage when fish were fed diets containing more than 600 µg FUM per kg of feed.
Determining sensitivity of marine species
All the FUM-sensitive aquaculture species tested so far, are all omnivorous or herbivorous, and all are freshwater species. In contrast to freshwater species, the liver in marine fish plays an essential role in lipid metabolism. It is a sensitive organ reflecting any lipid metabolism changes, which might influence the essential pathways of n-3 long-chain polyunsaturated fatty acids (EPA and DHA) biosynthesis and metabolism. The known mode of action of FUM is inhibition of ceramide synthase, a key enzyme in lipid metabolism. It is therefore expected that FUM has a negative impact on the lipid metabolism of marine species.
Based on this theoretical rationale, BIOMIN performed some ground-breaking studies in marine species. As expected, these studies showed that marine species were highly sensitive to FUM, affecting growth performance and immune status at relatively low FUM levels (< 5,000 µg/kg). However, according to the European Commission (EC), the guidance values for FUM (fumonisins B1 + B2) in complementary and complete feeding stuffs for fish is 10 ppm. This is a reason for concern, as new BIOMIN data suggests that the guidance values might be too high, at least for marine species.
Synergism the most important concept
FUM is the most predominant mycotoxin in plant meals and consequently in finished feeds. However, 80 percent of all finished feed samples tested during 2017 were contaminated with more than one mycotoxin (Fig. 2). It is important to know the effects of FUM in addition to its interaction with other mycotoxins present in the feed. Synergism, i.e., the interaction of two or more mycotoxins to produce a combined effect greater than the sum of their separate effects, is not very well described in aquaculture. However, studies have shown that Aflatoxin B1 (AFB1) and FUM have a synergistic effect in fish and shrimp
The study conducted by McKean et al. (2006) in mosquitofish describes well the synergistic effect between AFB1 and FUM. The authors observed that mortality started to increase only above 2,000 ppb of FUM reaching 17 percent. A similar mortality rate was obtained for AFB1 levels of 215 ppb. However, when combining both mycotoxins, the authors observed that mortality increased to 75 percent at concentrations of 1,740 ppb of FUM combined with 255.4 ppb of AFB1. The same synergistic effect was also observed in other species as detailed in Table 5.
Gonçalves FUM Table 5
| Species | AFB1 level (ppb) | FB1 level (ppb) | Source |
|---|---|---|---|
| Rainbow trout (Oncorhynchus mykiss) | 100 | 3,200 | Carlson et al., 2001 |
| Pacific white shrimp (Litopenaeus vannamei) | 300 | 1,400 | Pérez-Acosta et al., 2016 |
| African catfish (Clarias gariepinus) | 7.3 | 15,000 | Adeyemo et al., 2018 |
Direct mortality, especially in short-term feeding trials (up to four weeks), is an extreme consequence of the combined levels of AFB1 and FB1. Under commercial aquaculture conditions, lower levels of AFB1 and FB1 are expected to generate a decrease in growth performance and an increase in disease vulnerability.
Perspectives
The 2017 BIOMIN Mycotoxin Survey showed that fumonisins were present in the majority of raw materials sampled, a trend that is likely to continue based on the analysis of samples gathered in early 2018.
Although research into fumonisins is infrequent, fumonisin contamination has been directly linked to decreased performance levels in aquaculture. Most research is focused on freshwater species, but new BIOMIN data that is soon to be published conducted in marine species suggests that sensitivity levels may be lower than previously thought.
Most samples of finished feeds are contaminated with more than one mycotoxin, highlighting both the importance of understanding mycotoxin synergisms when diagnosing performance problems and also the importance of constructing mycotoxin mitigation strategies.
References available from authors.
Now that you've reached the end of the article ...
… please consider supporting GSA’s mission to advance responsible seafood practices through education, advocacy and third-party assurances. The Advocate aims to document the evolution of responsible seafood practices and share the expansive knowledge of our vast network of contributors.
By becoming a Global Seafood Alliance member, you’re ensuring that all of the pre-competitive work we do through member benefits, resources and events can continue. Individual membership costs just $50 a year.
Not a GSA member? Join us.
Authors
-

Aquaculture scientist
BIOMIN Holding GmbH
Erber Campus 1, 3131 Getzersdorf, Austria -

Product Manager
BIOMIN Holding GmbH
Erber Campus 1, 3131 Getzersdorf, Austria
Related Posts
Aquafeeds
Mycotoxin prevention in aquaculture feeds
Mycotoxins are naturally occurring, toxic chemical compounds produced by molds. When they infect aquaculture feeds and feed ingredients, mycotoxins can affect growth, reproduction and immunity in fish.
Aquafeeds
Mycotoxins in feed affect fish health, performance
Nutritious and cost-effective aquafeeds can be formulated using high levels of plant feedstuffs. However, this may increase the risk of exposure to mycotoxins.

Responsibility
Aquaculture Exchange: Alan Shaw, Calysta
Turn fuel into animal food? Calysta can do that. The California biotech company is now hoping for greater buy-in from aquaculture, its target market. CEO Alan Shaw talks about the potential of FeedKind and its ambitious plans for 2016 and beyond.
Aquafeeds
Can corn fuel aquaculture’s growth? Veramaris says yes
The benefits of omega-3 fatty acids to human health are well known. Fish need them too. To supplement current supplies from wild-caught fish, one innovative venture is turning to the corn fields of Nebraska – yes, Nebraska – for answers.