Understanding the oxygen demand of aquafeeds
Proper aquafeed quality, management key to minimizing dissolved oxygen and stress levels
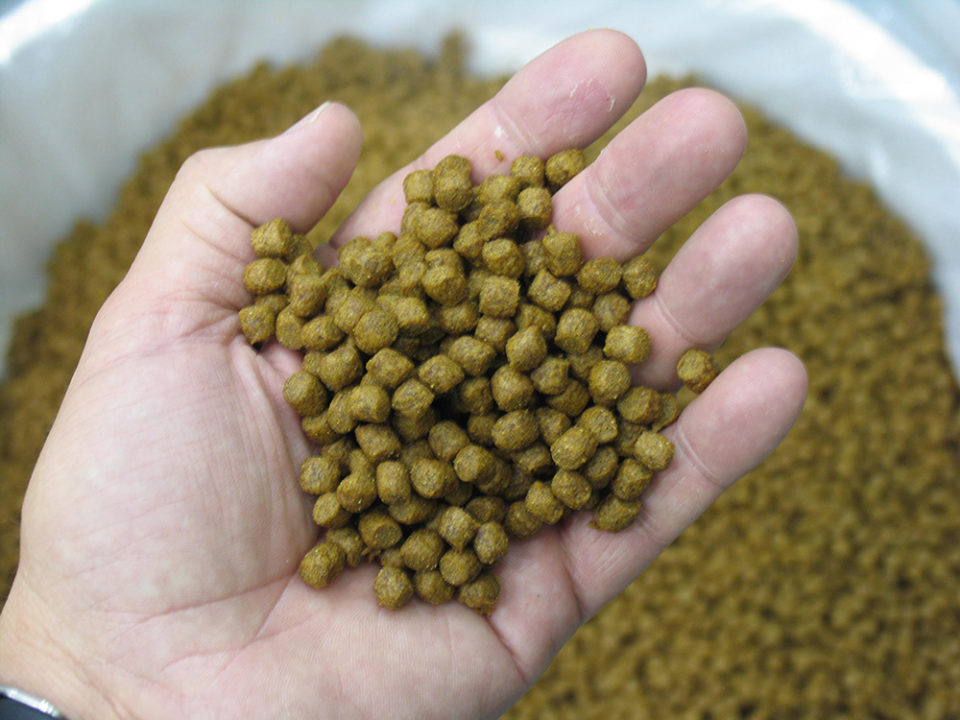
Feed allows a great increase in the amount of aquaculture production possible in a given volume of water. But feed also results in an oxygen demand that can cause unacceptably low dissolved oxygen concentrations is culture systems and pollution in water bodies receiving aquaculture effluents.
Fate of aquafeed and oxygen demand
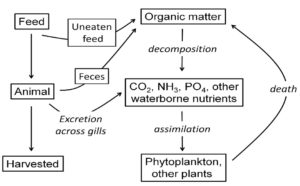
A portion of the feed applied (usually 5 to 10 percent in fish culture and 20 to 40 percent in shrimp culture) goes uneaten (Fig. 1). Of the feed consumed by the culture animals, the smaller portion becomes biomass of the culture animals that are harvested. The larger portion is excreted as metabolites, mainly carbon dioxide, ammonia, and phosphate. Uneaten feed and feces are decomposed by bacteria and other microorganisms to the same metabolites produced by the culture animals.
The metabolites are plant nutrients and stimulate phytoplankton production in ponds or in water bodies containing aquaculture cages. Phytoplankton produce dissolved oxygen, but use oxygen in respiration, and when they die and decay, dissolved oxygen is required (Fig. 1). In the long run, the oxygen produced by phytoplankton photosynthesis is used in phytoplankton respiration or in the respiration of organisms decomposing phytoplankton or their remains.
Feed typically contains about 10 percent water (moisture), 10 percent mineral matter (ash), and 80 percent organic matter. Organic matter contains around 50% carbon, and the carbon concentration in feed is around 40 percent carbon [(1 kg feed X 0.8 kg organic matter/kg feed X 0.5 kg carbon/kg organic matter) X 100].
Organic and inorganic components of feed not contained in aquaculture animals at harvest or not removed from the culture system during the crop period enter the culture system. The organic carbon is oxidized to carbon dioxide by the culture species and microorganisms that decompose uneaten feed and feces. The culture animals and microorganisms also excrete ammonia in the water that is nitrified to nitrate by certain bacteria.
The oxidation of organic matter by the culture species and by bacteria and other organisms of decay is a complex process involving glycolysis and the Kreb’s cycle. However, the potential oxygen demand of the organic matter in feed can be calculated by the following simple equation:
Organic carbon + O2 ® CO2 + H2O.
Carbon has a molecular weight of 12 and the molecular weight of molecular oxygen (O2) is 32. Hence, 2.67 (32/12) kg of oxygen are needed to oxidize one kilogram of organic C.
Ammonia from the nitrogen in feed is oxidized by nitrifying bacteria by the following summary equation:
NH4+ + 2O2 ® NO3– + 2H+ + H2O.
One molecular weight of nitrogen weighs 14 grams and two molecules of oxygen weigh 64 grams. Hence, each molecule of ammonia oxidized to nitrate requires two molecules of molecular oxygen. Hence, each kilogram of ammonia nitrogen oxidized requires 4.57 (64/14) kg of molecular oxygen.

Calculating potential oxygen demand
It follows that the potential oxygen demand of feed can be calculated from the amounts of carbon and nitrogen in feed minus the amounts of these two elements in the culture species as follows:
Feed Oxygen Demand (kg O2/kg feed) = [(% carbon in feed/100) – (FCE)(% carbon in culture animals/100)]2.67 + [(% nitrogen in feed/100) – (FCE)(% nitrogen in culture animals/100)]4.57
where FCE = feed conversion efficiency (net kg culture species/ kg feed applied) or 1/feed conversion ratio (FCR). For example, if a feed contains 40 percent carbon and 6 percent nitrogen, and the culture animals contain 15 percent carbon and 2.75 percent nitrogen, and the FCE is 0.6, the feed oxygen demand will be:
Feed oxygen demand (kg O2/kg feed) = [40/100 – 0.6(15/100)]2.67 + [6/100 – 0.6(2.75/100)]4.57 = 0.828 + 0.199 = 1.03.
The feed oxygen demand will vary with feed composition, feed conversion efficiency (FCE), and composition of the culture species. It usually will be slightly more than 1.0 kg O2/kg feed at typical FCE values as illustrated for some common species (Table 1). However, the feed oxygen demand for producing 1 kg of the culture animals varies considerably because of the differences in typical FCE values for different species.
Boyd, Feed Oxygen Demand, Table 1
| Species | FCE | FCR | FOD (kg O2/mt feed) | FOD (kg O2/mt production) |
|---|---|---|---|---|
| Channel catfish | 0.5 | 2.0 | 1.05 | 2.12 |
| Tilapia | 0.57 | 1.7 | 1.02 | 1.73 |
| Atlantic salmon | 0.77 | 1.3 | 1.05 | 1.36 |
| Rainbow trout | 0.83 | 1.2 | 1.03 | 1.24 |
| Whiteleg shrimp | 0.67 | 1.5 | 1.00 | 1.50 |
Effect of feed conversion efficiency
The feed conversion efficiency has a rather minor effect on the feed oxygen demand (FOD) per kilogram of feed as illustrated in Table 2 using calculations of the feed and culture species composition from the example above. However, the FCE has a major influence on the amount of feed needed to produce a unit weight of the culture species.
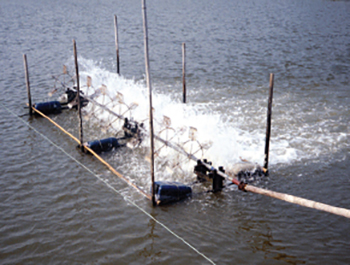
Increasing the FCE from 0.5 to 0.7 (reducing FCR from 2.0 to 1.43) would lessen the input of feed to produce 5,000 kg of the culture species from 10,000 to 7,150 kg and reduce the total oxygen demand on the culture system from 10,800 kg O2 to 6,936 kg O2. This would decrease the amount of mechanical aeration required per unit of production. It also would provide considerable savings in feed costs.
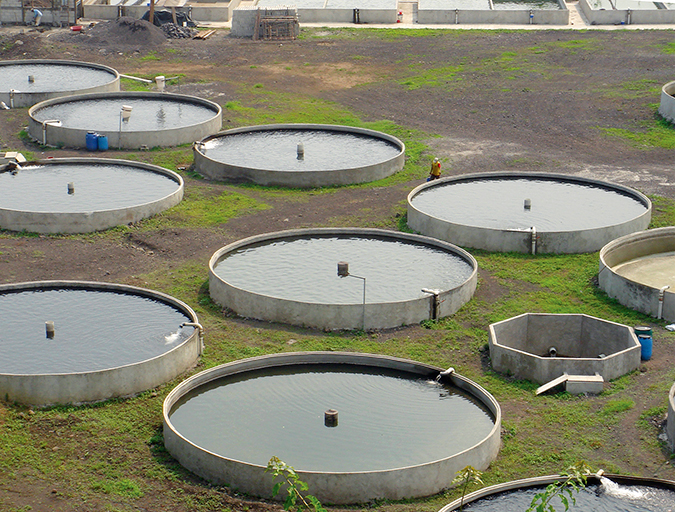
The entire feed oxygen demand is not released into receiving water other than in the case of cage or net pen culture. In ponds, considerable oxygen demand is expressed within the pond itself – usually about 70 to 80 percent of the feed oxygen demand. In raceways and water recirculating systems some of the solids (uneaten feed and feces) are removed and disposed in terrestrial habitat.
Boyd, Feed Oxygen Demand, Table 2
| FCE | FCR (1/FCE) | Feed oxygen demand (kg O2/kg feed) | Feed applied (kg) | Resulting oxygen demand in culture system (kg O2) |
|---|---|---|---|---|
| 0.4 | 2.5 | 1.13 | 12,500 | 14,125 |
| 0.5 | 2.0 | 1.08 | 10,000 | 10,800 |
| 0.6 | 1.67 | 1.03 | 8,350 | 8,498 |
| 0.7 | 1.43 | 0.97 | 7,150 | 6,936 |
| 0.8 | 1.25 | 0.92 | 6,250 | 5,750 |
Perspectives
There is not much that can be done to reduce the oxygen demand inherent in a kilogram of feed. However, by improving the FCE (or FCR), the feed needed to produce 1 kg of aquaculture animals in an aquaculture production system can be appreciably reduced. This will lower the oxygen demand imposed per unit of aquaculture production and lessen feed costs. It also will lessen the pollution potential per unit of aquaculture production.
Authors
-

School of Fisheries, Aquaculture and Aquatic Sciences
Auburn University
Auburn, Alabama 36849 USA
-

School of Fisheries, Aquaculture and Aquatic Sciences
Auburn University
Auburn, Alabama 36849 USA
-
School of Fisheries, Aquaculture and Aquatic Sciences
Auburn University
Auburn, Alabama 36849 USA
Related Posts
Responsibility
Calcium and magnesium use in aquaculture
Aquatic plants and animals get the essential nutrients calcium and magnesium from water and food. Calcium concentrations impact the hydration and development of eggs in a hatchery, where calcium carbonate precipitation can be troublesome.
Responsibility
Efficiency of mechanical aeration
Although relatively expensive, mechanical aeration increases production. Asian-style paddlewheel aerators are widely used but are inefficient. Testing has led to more efficient designs that are now widely used in U.S. catfish and shrimp ponds.
Responsibility
The importance of water analysis in aquaculture
Proper monitoring of water quality in aquaculture production systems is critical to enable appropriate and timely management decisions. It requires reliable equipment, trained technicians that follow instructions and apply quality control measures, proper reagents and calibrated equipment, and appropriately collected water samples that are promptly analyzed.
Responsibility
The complex principles of redox measurement
Keep adequate concentrations of dissolved oxygen in the culture water by balancing stocking and feeding rates with the amount of mechanical aeration applied. To prevent anaerobic conditions at the sediment-water interface, aerators should be positioned to promote the flow of oxygenated water across the pond bottom.