How feed and water additives are used on Egypt’s Nile tilapia farms
Survey results indicate limited use of manually mixed feed and water additives
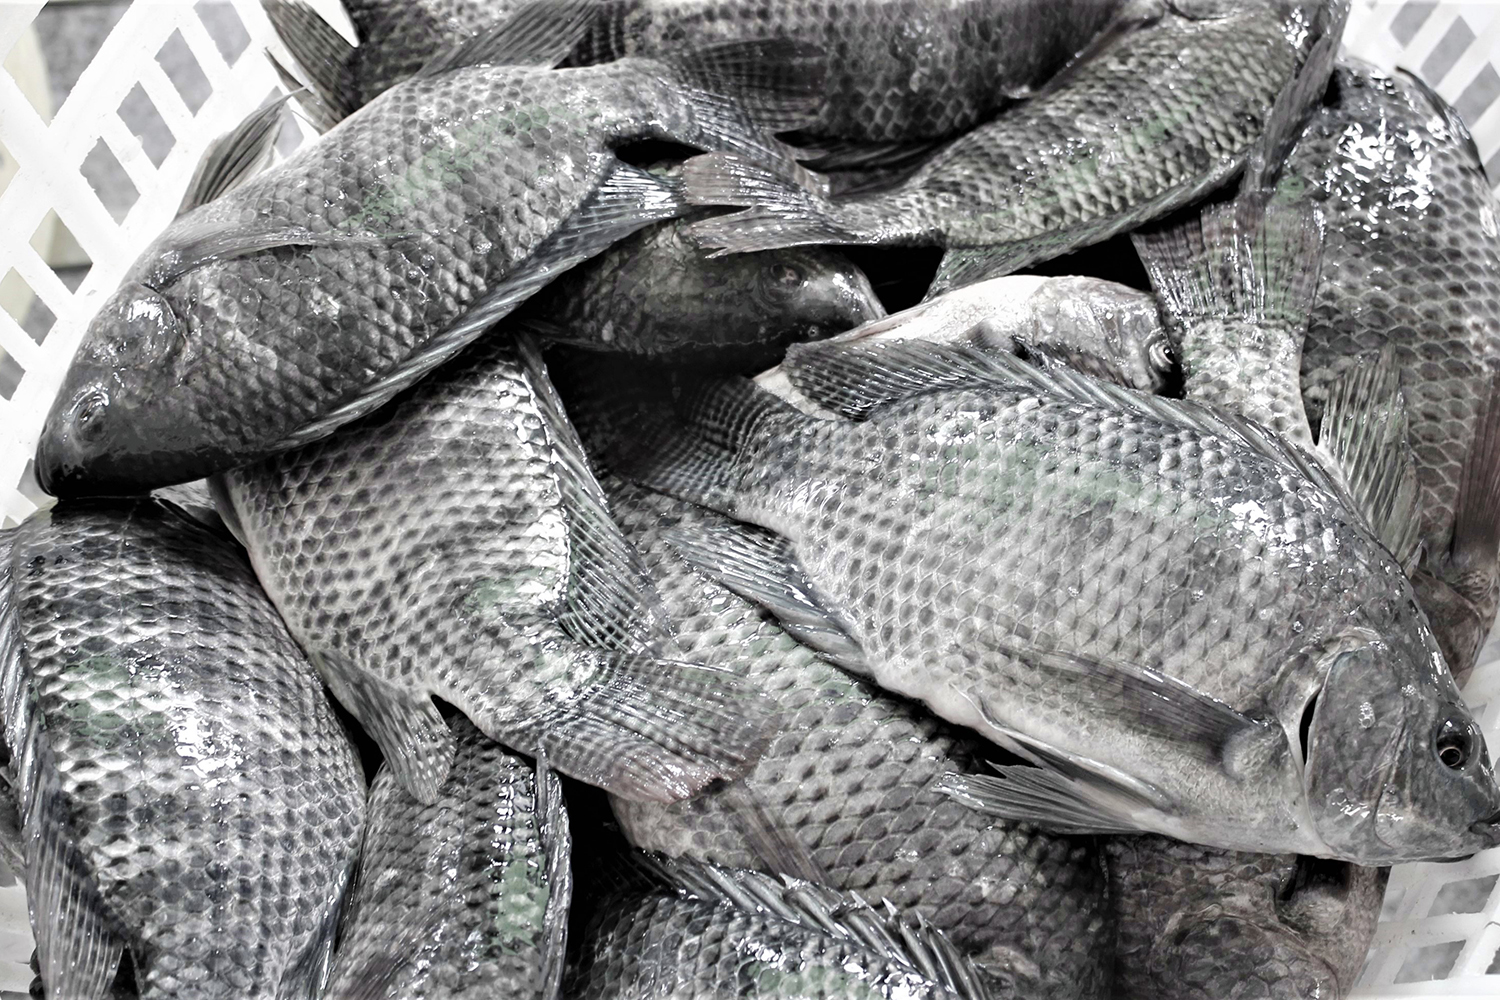
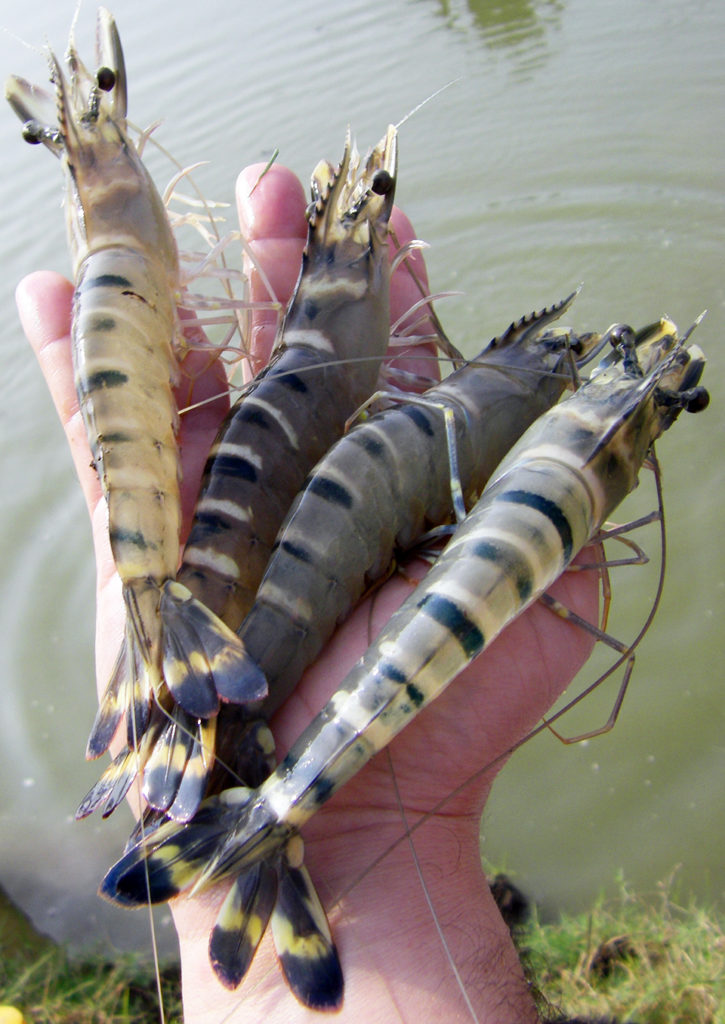
The Egyptian aquaculture industry has seen substantial growth in recent decades and Egypt is now the top producer in Africa. Egypt is also the world’s eighth-largest aquaculture producer, according to the Food and Agriculture Organization of the United Nations (FAO), producing more than 1.6 million tons in 2019, of which the vast majority (66 percent) is Nile tilapia (Oreochromis niloticus).
As the sector has undergone intensification with larger numbers of fish being cultured, farmers have reported more frequent outbreaks of infectious diseases. Such outbreaks typically necessitate the use of therapeutic treatments such as antibiotics (and disinfectants which are incorrectly used as therapeutants). In many countries, the use of natural and synthetic chemicals such as antibiotics and probiotics are used to prevent and treat diseases, improve water quality and promote growth.
Many aquafeed manufacturers (and fish farm operators that formulate their own feed) add “sensory” additives to improve palatability, “technological” additives such as antioxidants or emulsifiers or “zootechnical” additives such as enzymes and microorganisms to improve growth performance of reared animals. Additives may also be added to pond water. Although such practices were initially developed and introduced into more intensive aquaculture systems in industrialized nations, this trend now seems to have expanded into the small-scale fish farming sector in developing countries.
Considering the absence of clear regulations and of centralized government censuses to monitor trends, there was a need to better understand the current state of water and feed treatment in Egyptian tilapia culture. Amongst other benefits, understanding such trends could mitigate against potential poor productivity caused by the incorrect use of additives, reduce the risk of propagating antimicrobial resistance, and help benchmark the sector against typical best management practices.
![Ad for [BSP]](https://www.globalseafood.org/wp-content/uploads/2025/07/BSP_B2B_2025_1050x125.jpg)
This article – adapted and summarized from the original publication (Emam, W. et al. 2022. Trends in the use of feed and water additives in Egyptian tilapia culture. Aquaculture Research. 2022; 00:1–6) ̶ reports the results of a survey on the use of additives in Egypt’s largest fish farming region, the Kafr El-Sheikh Governorate. The objectives of this survey were to describe the use of additives in the country’s aquaculture sector and explore potential relationships with production.
Study setup
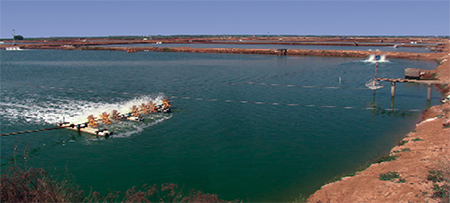
The survey was conducted in Kafr El-Sheikh governorate in the Egyptian Nile Delta given its prominence in the Egyptian tilapia production sector (more than 55 percent of the total national production of farmed fish). Kafr El-Sheikh is located at the north end of the Nile Delta, bordering the Mediterranean Sea and the brackish Lake Burullus to the North. Interviews covered both production and marketing seasons. The main bulk of the production cycle typically takes place in the warmer months (March to October) and the market supply peaks between September and December.
The survey was conducted by asking a series of questions to 120 active tilapia farms in the study area. This number of farms was selected by reviewing an inventory of the number of documented farms in the area held by Kafr El-Sheikh University. During the interviews, farmers were asked about various feed and water additives used as well as production metrics and farm management practices. The fish farms were selected by proximity wherein interviewers walked from one farm to another (within a distance of 1 to 5 km). If selected fish farmers opted not to take part in the survey, they were thanked by the interviewers who then moved on to the next farm.
For detailed information on the survey design, data collection and data analyses, refer to the original publication.
Productive performance of Nile tilapia juveniles in water reused from biofloc systems
Results and discussion
Most farmed production of freshwater fish in Egypt (more than 85 percent) use earthen ponds located within and around the Nile Delta and its associated lakes. In our survey, the average size of the surveyed farms was 11 hectares (±10 SD). The majority (around 72 percent) of respondents practiced polyculture, stocking mostly Nile tilapia fingerlings (typically over 90 percent of fish stocked) alongside a small number of grey mullet (Mugil cephalus) and thinlip mullet (Mugil ramada) fingerlings.
Mean stocking density of the surveyed farms was around 4.16 (±2.04 SD) fish per square meter. Surveyed farms had one of five sources of water for their ponds: (1) agricultural drainage water; (2) irrigation canal water; (3) water pumped from the nearby Lake Burullus; (4) ground water; and (5) “mixed water” – a mixture of two or more water sources. The most common source of water was agricultural drainage water (over 71 percent), followed by water from irrigation canals (10 percent), lake water (8.3 percent), mixed water (6.7 percent) and groundwater (about 4 percent). Farmers reported carrying out between 5 and 50 percent water exchanges on a daily basis (25 percent ± 12 SD on average). Table 1 summarizes the key characteristics of the farms surveyed.
Emam, feed additives, Table 1
| Parameter | Minimum | Maximum | Average (±SD) |
|---|---|---|---|
| Farm size (hectares) | 0.6 | 57 | 11 (±9.6) |
| Size of largest pond in farm (ha) | 0.32 | 44 | 5.6 (±4.9) |
| Total number of ponds in farm | 1 | 38 | 6 (±5) |
| Stocking density (fish per square meter) | 1.67 | 11.19 | 4.16 (±2.04) |
| Reported total marketable yield in previous production cycle (tons) | 2 | 7 | 3.7 (±0.97) |
| Weight of fingerlings stocked (grams) | 2 | 47 | 6 (±11) |
| Reported survival rate in previous production cycle (%) | 40 | 100 | 76 (±9) |
| Daily water exchange in ponds (%) | 5 | 50 | 25 (±12) |
Farms typically stocked Nile tilapia fingerlings weighing an average of 6 grams (±11 SD) and produced an average of 1.6 (±0.97 SD) metric tons (MT) of Nile tilapia per hectare. The survival rate of fish during the previous production cycle as reported by the surveyed farmers was on average 76 percent (±9 SD). There was no significant association between the source of water used in the farm and the survival rate.
Similarly, there was no significant difference between the use of agricultural drainage water and the use of other water sources in terms of total marketable yield. The majority (>83 percent) of respondents reported significant fish mortalities in the previous production cycle. However, this does not correspond with the average survival rate of 76 percent estimated in this study. The highest mortality rates were reported during the warmest months of summer (45 percent). Farmers frequently mentioned (although this was not officially recorded) that their perception was that mortalities had been particularly high in the previous 5 to 7 years. Just over half (51 percent) of the respondents attributed the mortalities in their farm to (perceived) disease outbreaks. However, most of those farmers (79 percent) did not send samples of dead fish to a veterinarian or to a laboratory for analysis.
Only 30 percent of surveyed farms used in-water additives. These were separated by those added to the culture water and those added to feed. No relationships were observed between the use of additives and the size of the farm, the species stocked or the source of water used. Fish farmers in Egypt generally resort to the use of pharmaceutical additives in a reactive manner during disease outbreaks or at times of high mortality. These additives are manually mixed into manufactured feed on the same day it is used.
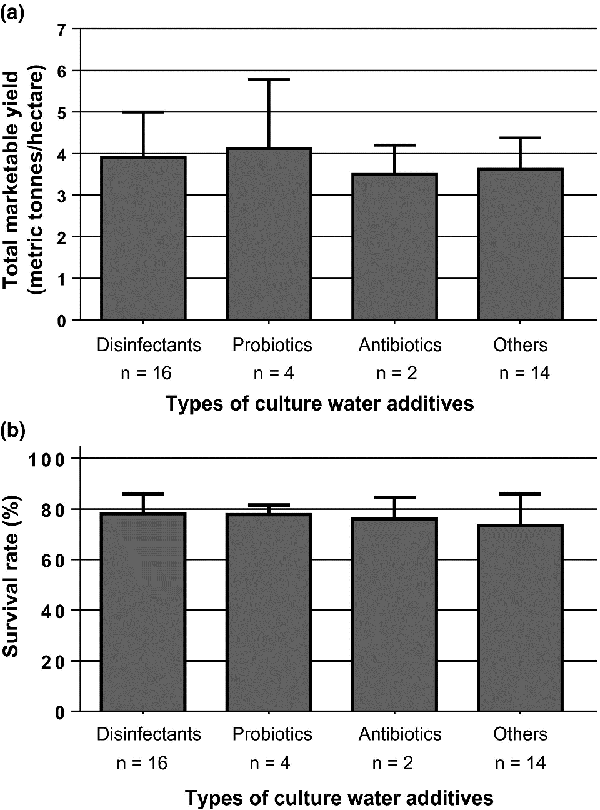
Among that 30 percent of farmers that used in-water additives, the most used type of in-water additive was a form of disinfectant (e.g., limestone) which was most frequently used alone and added before restocking. Probiotics were the most common additive used during the actual production cycle followed by antibiotics. No significant association was observed between the use of in-water additives and total marketable yield (Fig. 1a). Similarly, no significant association was observed between the use of in-water additives and reported fish survival rates. Reported survival rates in farms that used disinfectants before stocking were not significantly different to those in farms that did not use disinfectant (Fig. 1b).
Farmers that reported using in-water additives were significantly more likely to have experienced an apparent disease outbreak in the previous production cycle (67 percent versus 51 percent of those who did not use additives).
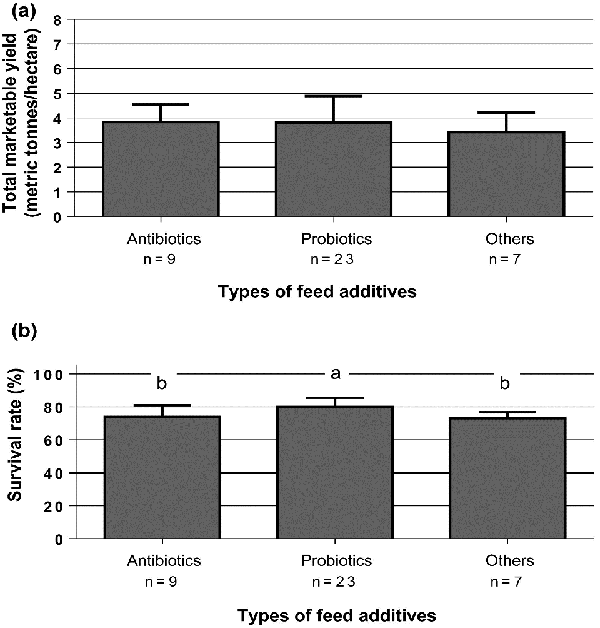
As regards to feed additives, only 33 percent of surveyed farms used additives in feed. The majority of those farms (82 percent of the 33 percent) reported using antibiotics either alone (23 percent) or in combination with probiotics (59 percent). No significant association was observed between the different types of feed additives and total marketable yield (Fig. 2a). However, a significant difference was observed between the type of feed additives used and the reported survival rates (Fig. 2b). In contrast to water additives, there was no association between the use of feed additives and farmers having experienced an apparent disease outbreak in the previous production cycle.
Although these data were not officially collected (since farmers were either unable or unwilling to recall specific details), a number of farms (11 percent) reported adding vitamins and minerals to their formulated feed of which zinc and selenium were the most commonly mentioned. It is interesting that some respondents mentioned the addition of vitamins and minerals to their feeds since this has not been documented previously. However, it is difficult to analyze or evaluate this further given that the farmers in question were unable to provide specific details.
The range of farms covered by this survey can be considered representative of the typical semi-intensive tilapia farms occurring throughout the Egyptian Nile Delta. The average farm sizes, stocking densities, type of aquaculture practiced (i.e., light polyculture) and typical sources of water (i.e., predominantly agricultural drainage water) reported in this survey are in line with what is generally known about the Egyptian tilapia farming sector. Similarly, the rates of farm productivity and fish survival rates reported by respondents in this study are consistent with the average yields and mortality rates observed by the authors of this study in their general farm veterinary consultation work.
In general, small landholders were more open to using additives than larger landholders, because a small pond size meant that it was more cost-effective and the impact of financial loss through disease and mortality on these farmers was generally greater so they were more eager to minimize mortalities. The reported low use of both feed and water additives was surprising given that anecdotal evidence suggested such use was rather widespread. It may have been expected that farms with perceived “dirtier” sources of culture water such as agricultural drainage water would be more inclined or incentivized to use water treatments. However, neither of these was detected in the survey. Instead, the survey did detect a greater tendency (albeit non-significant) for the use of water additives amongst farmers who had reported (perceived) disease outbreaks in their previous production cycle.
The use of disinfectants by tilapia farmers has been previously documented as has the recent increase in the use of probiotics in Egyptian aquaculture.
Perspectives
From the results of our study, the limited use of manually mixed feed and water additives we reported suggests that it is not such a widespread practice in the Egyptian tilapia sector. Where their use was reported, it was mostly reactive, in the context of responding to a perceived disease outbreak or a mass mortality event. It was particularly reassuring that relatively low levels of antibiotic use were reported, helping dispel common misperceptions about rampant overuse of antimicrobial agents in the fish farming sector.
Now that you've reached the end of the article ...
… please consider supporting GSA’s mission to advance responsible seafood practices through education, advocacy and third-party assurances. The Advocate aims to document the evolution of responsible seafood practices and share the expansive knowledge of our vast network of contributors.
By becoming a Global Seafood Alliance member, you’re ensuring that all of the pre-competitive work we do through member benefits, resources and events can continue. Individual membership costs just $50 a year.
Not a GSA member? Join us.
Authors
-

Corresponding author
Institute of Aquaculture
University of Stirling
Stirling, UK -
Department of Aquaculture
Faculty of Aquatic and Fisheries Sciences
Kafrelsheikh University
Kafr El-Sheikh, Egypt -
Department of Aquaculture
Faculty of Aquatic and Fisheries Sciences
Kafrelsheikh University
Kafr El-Sheikh, Egypt -
Department of Aquaculture
Faculty of Aquatic and Fisheries Sciences
Kafrelsheikh University
Kafr El-Sheikh, Egypt -
Department of Aquaculture
Faculty of Aquatic and Fisheries Sciences
Kafrelsheikh University
Kafr El-Sheikh, Egypt
Related Posts
Health & Welfare
Antimicrobial resistance: Aquaculture to humans, humans to aquaculture?
The transfer of resistance from an aquaculture pathogen into a human enteric bacterium has been demonstrated in research and may be happening in the real-world environment.
Health & Welfare
Antimicrobial resistance: complex, unavoidable
Resistance to antibiotics is unavoidable because it is an aspect of bacterial evolution. Resistant microflora have been observed in water that has not had recent contact with antimicrobial agents.
Health & Welfare
Do probiotics work in aquaculture?
Probiotics administered in feeds provide competitive exclusion of pathogenic bacteria, create conditions unfavorable for pathogens and modulate intestinal immune responses.

Intelligence
10 takeaways from GOAL 2019 in Chennai, India
The Global Aquaculture Alliance held its GOAL conference in Chennai, India, and recruited a host of experts in various fields to share their expertise.