Effects of varied dietary lipid sources tested in tilapia study
Deficiency of essential fatty acids leads to decreased immune responses

Dietary lipids are an important source of highly digestible energy and the only source of essential fatty acids required for normal growth and development of fish. They are also carriers and assist in the absorption of fat-soluble nutrients such as sterols and vitamins A, D, E and K. In addition, dietary lipids serve as a source of phospholipids and participate in the synthesis of hormones, prostaglandin and other metabolically active compounds.
There is evidence that dietary lipids and their constituent fatty acids influence immune response and disease resistance in fish. A deficiency or excess of omega-3 fatty acids can suppress immune function and increase the susceptibility of fish to infectious pathogens.
Feed study
The authors recently conducted a study to evaluate the effects of different lipid sources on the growth performance, whole body proximate composition, immune response and resistance of Nile tilapia (Oreochromis niloticus) to Streptococcus iniae infection.
A casein gelatin-based diet with 34 percent protein was supplemented with corn oil, beef tallow, fish oil, linseed oil or combinations of fish oil, corn oil and beef tallow; or linseed oil, corn oil and tallow at a level of 7 percent. Twice daily for 12 weeks, each diet was fed to tilapia of 6.5 grams average weight stocked at 35 fish per aquarium in four replicate aquariums. The aquariums used flow-through dechlorinated city water heated to 27 to 28 degrees-C and continuous air stone aeration. Photoperiod was kept on a 12 hours light, 12 hours dark schedule.
Fish in each aquarium were group weighed and counted at two-week intervals. At the end of week 12, blood samples from four fish per aquarium were collected for measurement of hematology. Another group of four fish per aquarium was also bled to determine immune responses.
Fifteen fish per aquarium were challenged by intraperitoneal injection with 0.1 ml of 5 x 10⁶ colony-forming units/ml of S. iniae, with mortality recorded daily for 14 days. On day 15, blood samples from the surviving fish were collected to determine antibody levels.
Growth performance
The average final weight gain, dry matter feed intake, feed efficiency, protein efficiency, apparent protein utilization and survival rate are given in Table 1. Fish fed diets containing corn oil; fish oil; corn and fish oils plus tallow; and linseed and corn oils plus tallow had similar growth patterns throughout the feeding period. Fish fed diets with only linseed oil or beef tallow grew more slowly.
Lim, Growth performance and survival of Nile tilapia, Table 1
| Dietary Sources of Lipid Corn Oil | Dietary Sources of Lipid Beef Tallow | Dietary Sources of Lipid Fish Oil | Dietary Sources of Lipid Linseed Oil | Dietary Sources of Lipid Beef Tallow | Dietary Sources of Lipid Corn Oil, Beef Tallow |
|
|---|---|---|---|---|---|---|
| Weight gain (g) | 29.5 ± 4.1a | 11.2 ± 2.2b | 27.2 ± 2.3a | 26.6 ± 1.4a | 31.6 ± 0.4a | 34.6 ± 3.1a |
| Feed intake (g) | 27.8 ± 2.7a | 12.9 ± 1.6c | 24.3 ± 1.8ab | 22.2 ± 1.1b | 29.4 ± 0.7a | 29.6 ± 1.8a |
| Feed efficiency ratio | 1.1 ± 0.1b | 0.9 ± 0.1c | 1.1 ± 0.0ab | 1.2 ± 0.0a | 1.1 ± 0.0ab | 1.2 ± 0.0ab |
| Protein efficiency ratio | 3.1 ± 0.2a | 2.5 ± 0.2b | 3.3 ± 0.1a | 3.5 ± 0.1a | 3.2 ± 0.1a | 3.4 ± 0.1a |
| Apparent protein utilization | 47.8 ± 2.3a | 37.8 ± 3.2b | 51.0 ± 1.4 a | 53.4 ± 2.3a | 48.9 ± 0.7a | 52.6 ± 1.8a |
| Survival (%) | 97.1 ± 2.0a | 88.6 ± 3.5b | 93.6 ± 3.0ab | 99.3 ± 0.7a | 97.1 ± 2.9a | 99.3 ± 0.7a |
By week 6, the weight gain of these two groups of fish was significantly (P < 0.05) lower than those of the other test groups. Thereafter, growth of fish fed the tallow-supplemented diet remained consistently poorer, while fish fed the linseed oil-supplemented diet, although still inferior, followed the same trend as those of the other fish.
The mean final weight gain of fish fed the tallow diet was significantly (P < 0.05) lower than those of fish fed the other diets. No significant difference in weight gain was found among the fish fed the other test diets.
Feed intake was a reflection of weight gain, with fish fed the tallow-supplemented diet having significantly lower intake than those fed the other diets. The feed intake of fish that received the linseed oil diet did not differ from that of fish fed the fish oil-supplemented diet but was significantly lower than for those fed the remaining diets.
Feed efficiency was significantly lowest for fish fed the tallow-supplemented diet. Although the feed-conversion ratio for the diet with added corn oil was lower than that for the diet with linseed oil, these values were not significantly different from those of the other diets.
The protein efficiency ratio and apparent protein utilization were significantly lowest for the beef tallow diet but statistically similar for the other diets. Survival was lowest for fish fed the diet with tallow, but this was not significantly lower than that of those fed the fish oil diet. There was no significant difference in survival among the remaining fish groups.
No significant (P < 0.05) difference was observed among the moisture and lipid contents of fish receiving various dietary lipid sources (Table 2). Crude protein content was significantly lowest and ash content highest for fish fed the diet with beef tallow, but the values of these parameters did not differ among fish fed the other diets.
Lim, Composition of Nile tilapia fed diets, Table 2
| Whole-Body Proximate Composition (% wet weight) | Dietary Sources of Lipid Corn Oil | Dietary Sources of Lipid Beef Tallow | Dietary Sources of Lipid Fish Oil | Dietary Sources of Lipid Linseed Oil | Dietary Sources of Lipid Fish Oil, Corn Oil, Beef Tallow | Dietary Sources of Lipid Fish Oil, Corn Oil, Beef Tallow |
|---|---|---|---|---|---|---|
| Moisture | 70.6 ± 0.6a | 70.9 ± 0.8a | 70.4 ± 0.3a | 70.9 ± 0.2a | 70.5 ± 0.6a | 70.5 ± 0.4a |
| Protein | 15.3 ± 0.1a | 14.6 ± 0.3b | 15.3 ± 0.2a | 15.2 ± 0.2a | 15.3 ± 0.1a | 15.3 ± 0.1a |
| Lipid | 8.5 ± 0.4a | 8.5 ± 0.5a | 8.7 ± 0.3a | 7.8 ± 0.1a | 8.8 ± 0.3a | 8.8 ± 0.2a |
| Ash | 3.2 ± 0.1b | 3.6 ± 0.1a | 3.2 ± 0.1b | 3.2 ± 0.1b | 3.2 ± 0.1b | 3.3 ± 0.1b |
Immune response, S. iniae challenge
Counts of red and white blood cells were significantly highest in fish fed the fish oil diet. These values did not differ significantly in fish fed the other dietary lipids. The sources of dietary lipid had no effect on hemoglobin and hematocrit. Serum protein, lysozyme activity and natural hemolytic complement activity were significantly lowest in fish fed the diet with beef tallow. The values of these parameters did not significantly differ among fish fed other diets.
Prechallenge antibody testing indicated that fish were seriologically negative for S. iniae. Postchallenge antibody titers were not influenced by the varied dietary source of lipid.
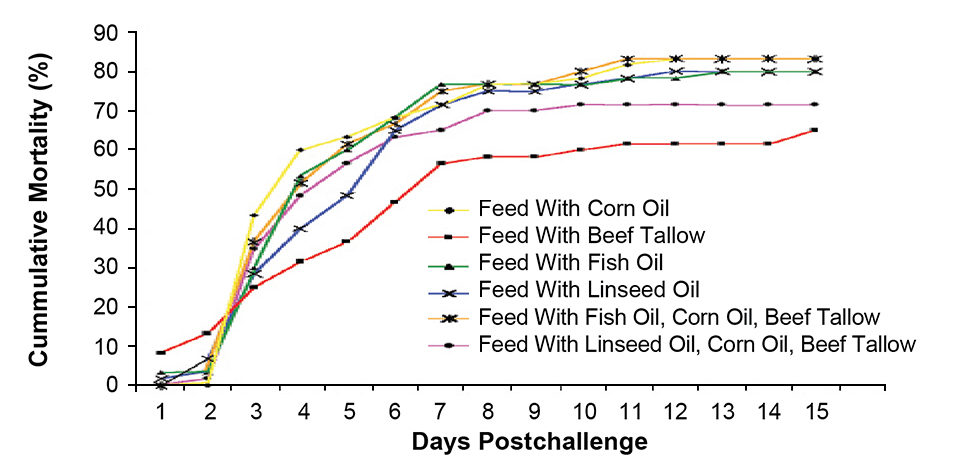
The daily mortality of the tilapia following challenge with S. iniae is presented in Fig. 1. Cumulative mortality at day 15 for the fish fed the tallow diet was significantly lower than those obtained in the groups fed the corn oil or fish oil/corn oil/beef tallow diets, but these values did not significantly differ from those of the other treatments.
Dietary requirements
The study appeared to indicate that Nile tilapia have dietary requirements for both omega-6 and omega-3 fatty acids. Fish fed the diet with beef tallow, which contained low levels of omega-6 and omega-3 (0.31 and 0.26 percent, respectively) exhibited poor growth performance. High dietary levels of either omega-6 or omega-3 may spare the requirement of the other, but omega-6 appeared to have a better growth-promoting effect than omega-3. Excessive levels of omega-3 highly unsaturated fatty acids in the diet with fish oil may lead to abnormally high red and white blood cell counts, and excessive mucus production.
Deficiency of essential fatty acids leads to decreased immune responses. However, this did not translate into reduced resistance of fish against S. iniae challenge.
(Editor’s Note: This article was originally published in the May/June 2008 print edition of the Global Aquaculture Advocate.)
Now that you've reached the end of the article ...
… please consider supporting GSA’s mission to advance responsible seafood practices through education, advocacy and third-party assurances. The Advocate aims to document the evolution of responsible seafood practices and share the expansive knowledge of our vast network of contributors.
By becoming a Global Seafood Alliance member, you’re ensuring that all of the pre-competitive work we do through member benefits, resources and events can continue. Individual membership costs just $50 a year.
Not a GSA member? Join us.
Authors
-

Aquatic Animal Health Research Laboratory
990 Wire Road
Auburn, Alabama 36831 USA -
Aquatic Animal Health Research Laboratory
990 Wire Road
Auburn, Alabama 36831 USA -
Aquatic Animal Health Research Laboratory
990 Wire Road
Auburn, Alabama 36831 USA -
Aquatic Animal Health Research Laboratory
990 Wire Road
Auburn, Alabama 36831 US
Related Posts
Health & Welfare
10 paths to low productivity and profitability with tilapia in sub-Saharan Africa
Tilapia culture in sub-Saharan Africa suffers from low productivity and profitability. A comprehensive management approach is needed to address the root causes.

Health & Welfare
A look at tilapia aquaculture in Ghana
Aquaculture in Ghana has overcome its historic fits and starts and is helping to narrow the gap between domestic seafood production and consumption. Production is based on Nile tilapia.
Aquafeeds
A look at corn distillers dried grains with solubles
Corn distillers dried grains with solubles are an economical source of energy, protein and digestible phosphorus to reduce feed costs and fishmeal usage.
Aquafeeds
A look at India’s fish feed industry
India's fish-farming industry makes limited use of modern feeds, providing potential for the feed sector to grow. Commercial feeds are predominantly used for pangasius farming, followed by a rising popularity in carp culture.