Coastal fisheries management and novel modeling
Probabilistic model couples key fish populations with complex trophic, environmental and geomorphological factors
Fisheries management has historically focused on the population elasticity – a type of sensitivity analysis that measures the effect of a variable on model outcomes – of target fish based primarily on demographic modeling, with the key assumptions of stability in environmental conditions and static trophic relationships. The predictive capacity of this fisheries framework is poor, especially in closed systems where the benthic diversity and other effects are important and the stock levels are low.
Ecosystem-based modeling approaches to fisheries management require models that can include the fundamental interaction present in the fisheries systems. Even for relatively simple fisheries regions, such as the Baltic Sea, models can be improved if they account for localized diversity, species interactions at chosen trophic levels, environmental drivers, and human pressures. Indeed, many models have extended their complexity to achieve this level of comprehension.
There still is a mismatch between modeling output and fisheries management ̶ particularly in the spatial realm of marine reserve design, local seasonal closures, and real-time probabilistic assessment of fish biomass given field observations. Many fisheries models, despite containing many complex interaction components, still consider the fisheries ecosystem as a single homogeneous resource pool. Spatial interactions of biota with the habitat and benthic structure are simplified or ignored in order to maintain traction with complicated mechanistic models.
This article – adapted and summarized from the original publication [Kininmonth, S. et al. 2022. Is Diversity the Missing Link in Coastal Fisheries Management? Diversity 2022, 14(2), 90] – presents a probabilistic model [that can assess risk in process] that couples key fish populations with a complex suite of trophic, environmental and geomorphological factors.
![Ad for [BSP]](https://www.globalseafood.org/wp-content/uploads/2025/07/BSP_B2B_2025_1050x125.jpg)
Study setup
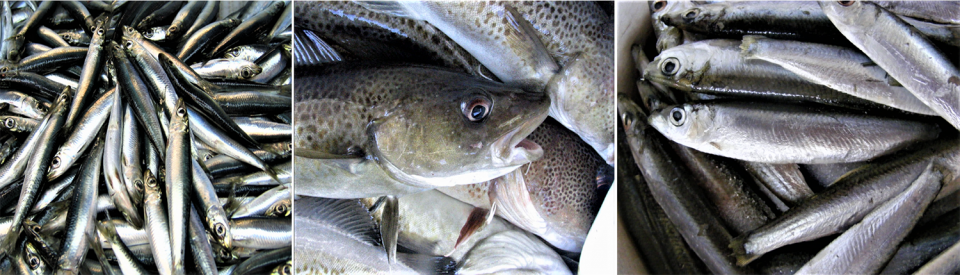
Using 41 years of observations, authors modeled the changes in eastern Baltic cod (Gadus morhua), herring (Clupea harengus) and Baltic sprat (Sprattus sprattus balticus) for the Baltic Sea within a Bayesian Network [a probabilistic graphical model used for examining a past event and predicting the likelihood that any one of several possible known causes was the contributing factor].
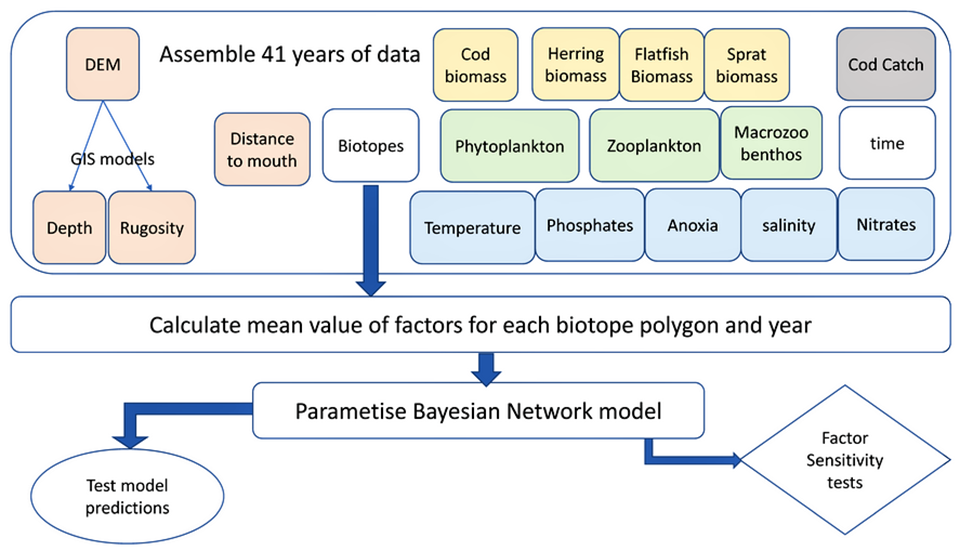
With this model (Fig. 1), two questions were addressed: (1) Are changes in diversity through alteration of biotopic [a biotope is an area of uniform environmental conditions offering living conditions for a specific assemblage of plants and animals, like a habitat] conditions the key to shaping cod dynamics? And (2) Are trophic, environmental, and biotopic feedbacks – and, consequently cod biomasses – non-stationary [models used for data with changing distributions ]?
For detailed information on the study setup and study area; the modeling framework used; and the development and application of the Bayesian Network model, refer to the original publication.
Results and discussion
This use of 41 years of environmental and biotic data within a Bayesian Network (BN) demonstrates that biotopic information increases predictive capacity for this enclosed region. Understanding the benthic character and incorporating this information into a BN model shows that biotopic conditions are important to developing a spatially explicit and temporally bound model of cod dynamics in the Baltic Sea.
Removing this biotopic information or aggregating the model spatial resolution in order to ignore the biotopic boundaries degraded the predictive capacity of the model. In particular, the model was able to accurately predict (within the periods observed) cod biomass across the region, although some predictions with insufficient data were discarded. The BN model was not suitable to predict into the future, given the uncertainty of the underlying abiotic and biotic factors, but various future scenarios can be rapidly explored.
Using a variance reduction method to evaluate the contribution of the model factors to the prediction of cod biomass highlighted that trophic, environmental, and biotopic feedbacks – and thus cod biomasses – were non-stationary. Factors such as macro-zoobenthos, flatfish and others only became influential in the later years of the data, and when environmental factors were different. In contrast, the cod catch factor remained stable in terms of influence, highlighting the fact that while fish catch data were a contributing factor in cod biomass predictions, the model was stationary for this factor. This was despite the substantial decrease in cod catches across this period.
While our model addresses 41 years of observations, it is possible to predict outside this time period (with the addition of extra observational data), and this places extra emphasis on the importance of the non-stationary capacity of the model. Particularly as climate change alters the relationships commonly observed, the inclusion of dynamics in parameter coefficients is required in order to better capture possible future trajectories.
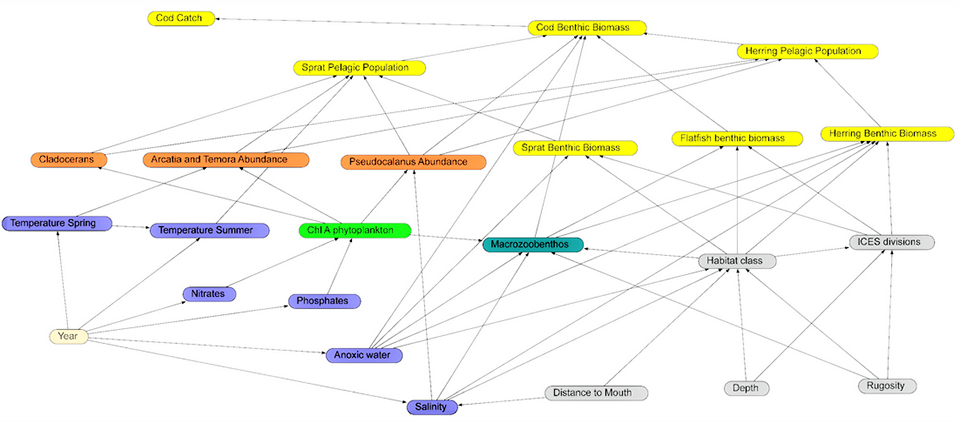
The BN model presented here (Fig. 2) represents one class of model that was employed to understand and predict changes in the biomass of fished species; it is a statistical model, trained on data, and there are numerous examples of different types of statistical models used for similar purposes. The strength of the BN approach is that it includes explicit description of the interaction of dependent factors; this was relevant in our study to evaluate the importance of biotopic information that directly affected cod biomass in the Baltic BN.
Fisheries decisions that are based on environmental flows, fish catch statistics, or simple trophic indicators are limited in their management confidence. Including a range of parameters that can characterize the linkage of fish dynamics as a function of overall system characteristics is more likely to generate meaningful advice on fish catch quotas and restrictions. The BN model shown here – although having a number of assumptions and limitations – was able to integrate a wide array of observations while also using the marginal probabilities to assist with predictions, despite missing data.
Our model was able to make predictions (within the periods specified) without the knowledge of past observations and, despite this limitation, the implicit incorporation of past trends was expected to increase the accuracy of the model.
Perspectives
Fisheries science has struggled to accurately inform the management of coastal fisheries. We suggest that this is due to the absence of two key factors: benthic coupling [processes that connect the benthic zone and the pelagic zone through the exchange of energy, mass, or nutrients], and non-stationary modeling [used for data with changing distributions ]. The role of the benthic environment as expressed by biotope models provides a linkage to the structural components of the marine interaction.
The model presented here using a Bayesian Network (BN) approach was able to integrate the structural, environmental and biotic components of the system. Critically, the use of biotope information in the form of polygons of variable shape and size, rather than repeated rectangles, increased the ecological linkages within the model, resulting in enhanced predictive capacity.
Coastal systems have commonly undergone change during the short and long term; consequently, the nature of variable interactions needed to be dynamic. The BN model can adjust the relationships across the modeled periods and, hence, enable the inclusion of variables that are important only in certain situations.
Our results strongly suggest that fisheries management that is able to encompass a spatially relevant suite of abiotic and biotic factors is likely to improve sustainable fisheries programs.
Now that you've reached the end of the article ...
… please consider supporting GSA’s mission to advance responsible seafood practices through education, advocacy and third-party assurances. The Advocate aims to document the evolution of responsible seafood practices and share the expansive knowledge of our vast network of contributors.
By becoming a Global Seafood Alliance member, you’re ensuring that all of the pre-competitive work we do through member benefits, resources and events can continue. Individual membership costs just $50 a year.
Not a GSA member? Join us.
Author
-

Corresponding author
Stockholm Resilience Centre, Stockholm University, SE-106 91 Stockholm, Sweden; and
Heron Island Research Station, University of Queensland, Gladstone, QLD 4680, Australia; and
School of Agriculture Geography Environment Oceans and Natural Sciences, University of the South Pacific, Suva, Fiji
Related Posts

Fisheries
Can a data-sharing tool eliminate IUU fishing and make seafood supply chains more reliable?
The Sustainable Fisheries Partnership’s new data-sharing tool helps users identify environmental risks and eliminate IUU fishing in seafood supply chains.
Responsibility
Integration, modeling key to advancing aquaculture
Careful assessments, modeling and integration of juvenile releases with other fisheries management measures can help restore stocks in objectively planned enhancement programs.
Aquafeeds
Modeling microalgae production cost in aquaculture hatcheries
A modeling evaluation of microalgae production costs in aquaculture hatcheries, along with cost reduction and optimization methods.
Responsibility
Modeling aquaculture carrying capacity in Southeast Asia
The modeling of common water bodies to determine aquaculture carrying capacity has been identified as a critical need for countries in Southeast Asia.