An assessment of brown shrimp stock and fishery dynamics in the German Bight
LPUE changes correlate well with biomass changes, although CPUE has an even stronger relationship to the combined biomass index, representative of exploitable biomass
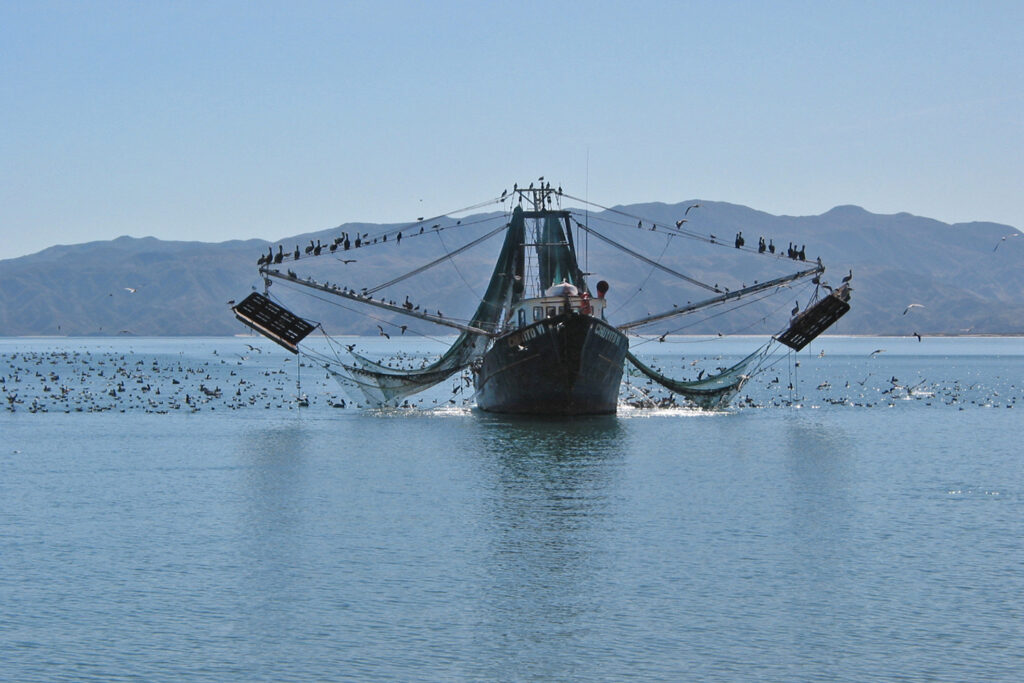
The brown shrimp (Crangon crangon) is a very abundant species in the Wadden Sea, supporting significant fisheries in Belgium, the Netherlands, Germany, and Denmark, with Germany and the Netherlands contributing the most to landings. The fishery – primarily using beam trawls with small mesh sizes (≥20 mm) to target shrimp ≥50 mm – peaks from September to November, with exploitable biomass dominated by the current year class, which is recruited in late spring to early summer and experiences faster individual growth over the warmer summer months. Given these characteristics, the short-lived species exhibits strong fluctuations in abundance and biomass across both seasonal and interannual cycles.
The fishery has adopted a management plan with sustainability measures, including monthly landings per unit of effort (LPUE, an abundance index) thresholds to prevent recruitment overfishing by maintaining spawning stock levels. LPUE and catch per unit of effort (CPUE, the amount of catch obtained per unit of fishing effort, like per fishing boat) are used as stock biomass indicators, though hyperstability can lead to overestimation at low biomass levels. Hyperstability occurs when catch rates remain high even as fish populations decline.
Several studies have shed some light on the relative impact of the fishery on an annual basis, but seasonal dynamics may be just as important for management. In particular, the characteristics of fast growth, short lifespan, and a prolonged recruitment period drive the seasonal dynamics of the stock and its fishery. Simulation studies have been able to reproduce these seasonal landings patterns to a degree, but more direct assessment have been hindered by a lack of data at higher temporal and spatial resolutions.
This article – summarized from the original publication (Taylor, M.H. et al. 2025. Estimation of brown shrimp stock and fishery dynamics in the German Bight using a novel biomass index. Fisheries Research Volume 291, November 2025, 107547) – uses survey data from the German Bight area of the Wadden Sea in a study that presents a novel species distribution model to estimate annual stock biomass changes for different size fractions (‘small’ <50 mm; ‘large’ >50 mm; and ‘combined’, all sizes), which are compared to fishery-based indices of LPUE and CPUE.
![Ad for [Aquademia]](https://www.globalseafood.org/wp-content/uploads/2025/07/aquademia_web2025_1050x125.gif)
Brown shrimp byproduct is a suitable ingredient for Pacific white shrimp diets
The present study reconstructs monthly biomass time series in the German Bight using a novel species distribution model incorporating depth, topography, and spatiotemporal autocorrelation. It evaluates LPUE and CPUE as unbiased biomass indicators and reconstructs historical exploitable biomass (2000–2023) to estimate fishing exploitation rates. The approach offers potential for data-limited stock assessments, such as surplus production models, applicable to other short-lived species.
For detailed information on the study area, experimental design, sea trials and fishing gear used, biomass estimates and models used, and data collection and analysis, refer to the original publication.
Biomass index
Results of the study presents a novel exploitable biomass estimate for brown shrimp in the German Bight using a state-of-the-art species distribution model (SDM; predicts the distribution of a species across geographic space and time using environmental data) that incorporates spatiotemporal information and the region’s complex topography. A first-order autocorrelation model performed best across all biomass size fractions, though an independent and identically distributed model showed similar predictive performance, likely due to low autocorrelation reflecting the shrimp’s short lifespan and unique annual distributions. However, despite this inter-annual variability in distribution, study results show that there is a clear preference for shallower nearshore areas, where biomass is concentrated (Fig. 1).
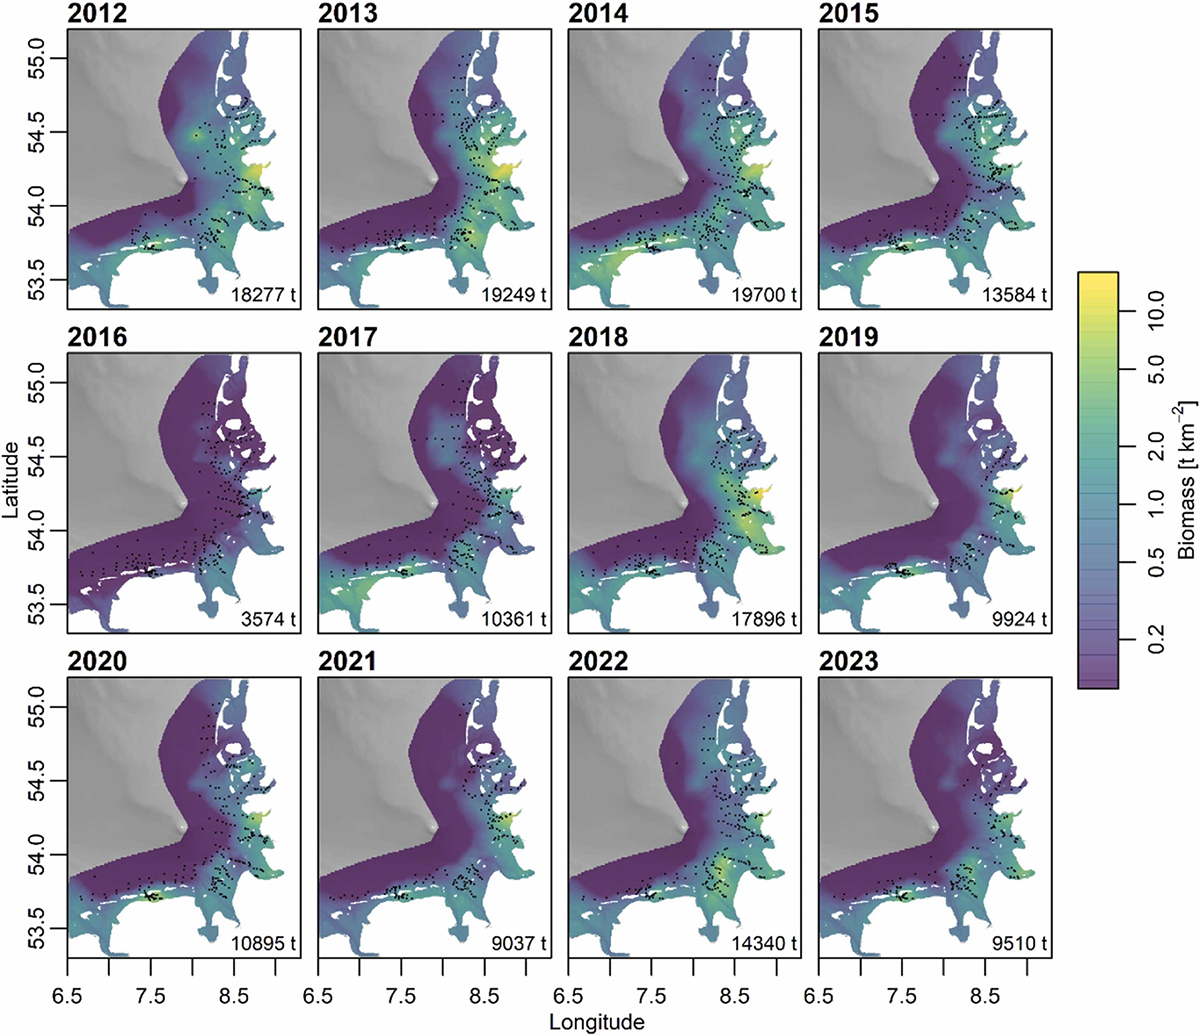
Compared to the biomass estimates for brown shrimp by Tulp et al. (15,000–30,000 tons from 1970–2015 across the Netherlands to Denmark), the present study estimates 15,000–20,000 tons for the German Bight alone during overlapping years (2012–2015). The similarity in estimates, despite differing spatial scopes, may stem from the SDM’s ability to capture fine-scale patterns and extrapolate into unsampled inshore areas. Unlike Tulp et al., who adjusted biomass upward using a 37 percent catchability efficiency factor from other authors, the present study assumes high catchability for exploitable biomass (sizes vulnerable to fishery capture) without correction, interpreting Reiss et al. as reflecting incomplete retention of shrimp <50 mm and consistent with the data reported by other researchers.
LPUE as an indicator of stock size
The North Sea brown shrimp management plan uses landings per unit effort (LPUE) as a proxy for stock biomass, with monthly thresholds set to suit the species’ short lifespan, similar to the lowest observed spawning stock reference point for data-rich stocks where there is no evidence of impaired recruitment or clear relationship between stock and recruitment. However, it is known that catch-based indices like LPUE can be biased if catchability varies with stock size, potentially leading to hyperstability where catch rates remain high despite low biomass, as seen when stocks contract to preferred habitats at low sizes. Results show some hyperstability in LPUE, though not significantly deviating from a proportional relationship with biomass (Fig. 2), suggesting catchability is not strongly tied to stock size.
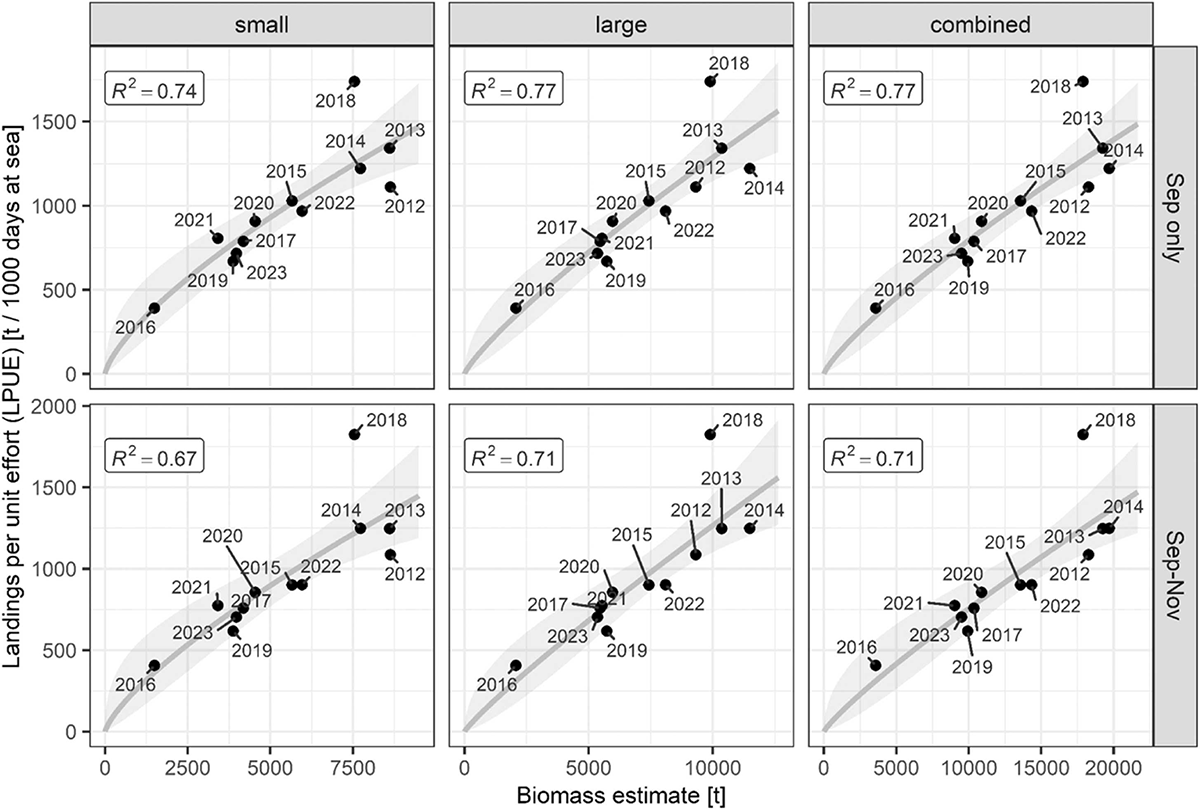
The biomass-LPUE relationship is strongest in September (survey month) but remains a reliable predictor of LPUE from September to November. The catch per unit effort (CPUE) relationship is even stronger, highlighting the importance of seasonal and annual discard rate variability, driven more by seasonal recruitment cycles than interannual changes. While CPUE better reflects total exploitable biomass, LPUE effectively tracks variability in larger, mature shrimp, making it suitable for setting thresholds to protect spawning stock.
Historical reconstruction of fishing dynamics
The reconstruction of historical monthly fishery dynamics for North Sea brown shrimp uses the relationship between catch per unit effort (CPUE) and exploitable biomass, enabling monthly harvest rate calculations and annual fishing mortality (F) estimates from 2000 onward, when effort data are available. This approach differs from earlier methods reported by several authors that used length-frequency data for total mortality (Z) estimates or annual catch-to-biomass ratios as F proxies. Results show that fishing effort peaks from March to November, with most landings from August to November, driven by larger, marketable shrimp surviving winter and lower discard rates in spring. And monthly harvest rates average from 25 to 40 percent of exploitable biomass during the main fishing season, supported by the species’ high productivity, fast growth, and prolonged spawning.
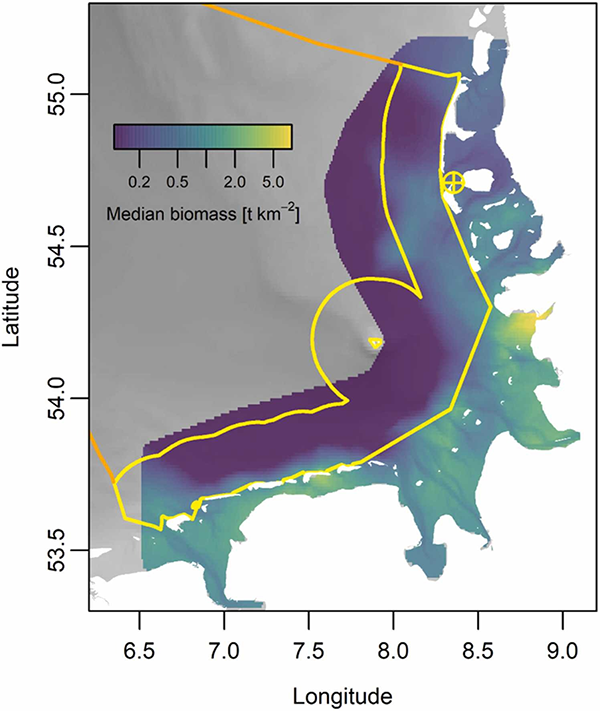
Results also showed that annual F values ranged from 3.5–5 until 2018, then decreased, higher than Temming and Hufnagl 2015’s estimates (2–6 for 2000–2010) due to methodological differences, including their focus on marketable sizes (>50 mm). Estimates by other authors, also focusing on larger sizes, are slightly higher but use a catch-to-biomass ratio that is not equivalent to instantaneous F. If assumptions of high survey catchability are used, this may lower F estimates compared to other adjusted biomass scenarios. Regarding potential biases to consider, these would include unaccounted survival of discarded shrimp, with recent studies suggesting higher discard mortality, and unaccounted catches from Dutch and Danish fleets in the 3–12 nautical mile zone of the German Bight, though German vessels dominate within the 3 nm exclusive zone where biomass is highest (Fig. 3).
Implications for management and future work
This research introduces a novel approach to estimate North Sea brown shrimp stock and fishery dynamics by integrating fisheries-dependent and -independent data, reconstructing high-resolution (monthly) time series to account for the species’ short lifespan, seasonal productivity, prolonged recruitment, and fishery dynamics, which complicate cohort-based assessments. It shows that using exploitable biomass rather than just marketable sizes offers a comprehensive view of fishery impacts and supports surplus production models (SPMs; one of the most basic population dynamics models) that incorporate recruitment, maturity, growth, mortality, and density-dependent effects. Seasonally adjusted SPMs are particularly suitable for short-lived species like brown shrimp, enabling biologically based reference points for sustainable management.
Finally, while focused on the German Bight, extending biomass modeling to the broader Wadden Sea could enhance understanding of spatial stock dynamics and fishery impacts. Spatially resolved fishing data would enable estimation of fishing mortality across time and space, supporting targeted management measures, such as reduced effort in critical recruitment or spawning areas and habitat protection.
Perspectives
The results of this study indicate that changes in LPUE are well correlated with biomass changes, although CPUE is shown to have an even stronger relationship to the combined biomass index, representative of exploitable biomass. This relationship is used to reconstruct monthly historical stock dynamics and estimate fishing exploitation rates (monthly harvest rate and annual fishing mortality).
Estimated fishing rates reflect changes in fishing effort, which varies seasonally, in response to recruitment and subsequent exploitable biomass dynamics, and inter-annually, relating to reductions in fleet size and shorter-term pauses in effort. The resulting time series serve as a basis for further stock assessment models that can provide more biologically-based advice for the stock.
The study methodology combining survey and fisheries-dependent data should be of interest to other data-limited applications, particularly for short-lived species where seasonal dynamics of the stock and fishery are of importance.
Now that you've reached the end of the article ...
… please consider supporting GSA’s mission to advance responsible seafood practices through education, advocacy and third-party assurances. The Advocate aims to document the evolution of responsible seafood practices and share the expansive knowledge of our vast network of contributors.
By becoming a Global Seafood Alliance member, you’re ensuring that all of the pre-competitive work we do through member benefits, resources and events can continue. Individual membership costs just $50 a year.
Not a GSA member? Join us.
Authors
-

Corresponding author
Thünen Institute of Sea Fisheries, Bremerhaven, Germany -
Thünen Institute of Sea Fisheries, Bremerhaven, Germany
-
Thünen Institute of Sea Fisheries, Bremerhaven, Germany
-
Thünen Institute of Sea Fisheries, Bremerhaven, Germany
Related Posts
Fisheries
Can marine protected areas provide biodiversity advantages in well-regulated fisheries?
Whether marine protected areas increase biodiversity depends on the presence of highly sensitive species and on management priorities.
Fisheries
Fisheries in Focus: Recent paper in Science confirms basic fisheries science, conjures causality
Sustainable Fisheries-UW: Better fisheries management requires enforcement of already-in-place limits, not new regulations that also go unenforced.
Fisheries
How aging uncertainty of major tuna species impacts the estimation of growth functions
Aging error and age range influences the uncertainty of growth estimation in major tuna species, necessitating improved accuracy of age analysis.

Fisheries
Study: Climate change may lead to shifts in vital Pacific Arctic fisheries
Climate change could cause commercially important marine species to shift northward, threatening Pacific Arctic fisheries.